G O V E R N M E N T A C T I O N S I N M A R K E T S 1 1 1
A n s w e r s t o t h e R e v i e w Q u i z z e s
Page 154
1. Describe the situation in the market for a good or service that the United
States imports.
The goods and services the United States will import are those in which the United
States has a higher opportunity cost of production relative to other countries. In
2. Describe the situation in the market for a good or service that the United
States exports.
The goods and services the United States will export are those in which the United
States has a lower opportunity cost of production relative to other countries. In
Page 156
1. How is the gain from imports distributed between consumers and domestic
producers?
2. How is the gain from exports distributed between consumers and domestic
producers?
3. Why is the net gain from international trade positive?
The net gain from international trade is positive because the gain to the winners
exceeds the losses to the losers. For instance, in the case of an imported good, all
the loss of producer surplus is transferred to consumers as consumer surplus. In
© 2016 Pearson Education, Inc.
7 GLOBAL MARKETS
IN ACTION
111
112
Page 163
1. What are the tools that a country can use to restrict international trade?
A country can use tari,s, import quotas, other import barriers such as health,
2. Explain the e,ects of a tari, on domestic production, the quantity bought,
and the price.
3. Explain who gains and who loses from a tari, and why the losses exceed the
gains.
Domestic consumers lose consumer surplus from the tari,. Domestic producers
gain producer surplus from the tari,. The government also gains revenue from the
4. Explain the e,ects of an import quota on domestic production, consumption,
and price.
5. Explain who gains and who loses from an import quota and why the losses
exceed the gains.
Domestic consumers lose consumer surplus from the import quota. Domestic
producers gain producer surplus from the import quota. The importers also gain
Page 167
1. What are the infant industry and dumping arguments for protection? Are they
correct?
The attempt to stimulate the growth of new industries is the infant-industry
argument for protection, which states that it is necessary to protect a new industry
from import competition to facilitate the growth of that industry, making it
competitive in the world markets. This argument is based on the idea that as =rms
mature they become more productive. However this argument for protection only
works if the bene=ts also spill over into other industries and other parts of the
112
G O V E R N M E N T A C T I O N S I N M A R K E T S 1 1 3
the domestic market is inelastic and the export market is elastic (which is almost
always the case) then it is natural for a =rm to price the domestic goods higher
2. Can protection save jobs and the environment and prevent workers in
developing countries from being exploited?
There are many myths about trade restrictions. The problem mentions three of
them, all false reasons often o,ered as reasons to restrict international trade.
These arguments are:
Trade restrictions save domestic jobs: Free international trade does, indeed,
cost jobs in the import-competing markets. But this argument ignores the fact
that, under free trade, consumers in the exporting country will have greater
disposable income. These consumers will use part of their higher income to buy
goods and services from other countries, thereby increasing employment in the
exporting sector of the nation. So, although international trade rearranges jobs
—decreasing them in import-competing markets and increasing them in
exporting markets—it does not, on net, cost jobs.
3. What is o,shore outsourcing? Who bene=ts from it and who loses?
O,shore outsourcing occurs when a =rm in the United States buys =nished goods,
components, or services from =rms in other countries. Workers who have skills for
4. What are the main reasons for imposing a tari,?
There are two main reasons for imposing tari,s on imports. First the government
receives tari, revenues from imports, which can be useful when revenues from
5. Why don’t the winners from free trade win the political argument?
Trade restrictions are enacted despite the inherent ine>ciency because of the
political actions of rent seeking groups, which fear that foreign competition might
© 2016 Pearson Education, Inc. 113

114
have a negative impact on their industry, =rm, or jobs. The anti-trade groups are
114
A n s w e r s t o t h e S t u d y P l a n P r o b l e m s a n d
A p p l i c a t i o n s
Use the following data to work
Problems 1 to 3.
Wholesalers buy and sell roses in
containers that hold 120 stems. The
table provides information about the
roses at auction in Aalsmeer, Holland,
for $125 per container.
1. a. Without international trade, what would be the price of a container of roses
and how many containers of roses a year would be bought and sold in the
United States?
b. At the price in your answer to part (a), does the United States or the rest of
the world have a comparative advantage in producing roses?
2. If U.S. wholesalers buy roses at the lowest possible price, how many do they
buy from U.S. growers and how many do they import?
The price of roses in the United States is $125 per container. At this price, U.S. rose
growers supply 2 million containers per year and U.S. wholesalers demand 12
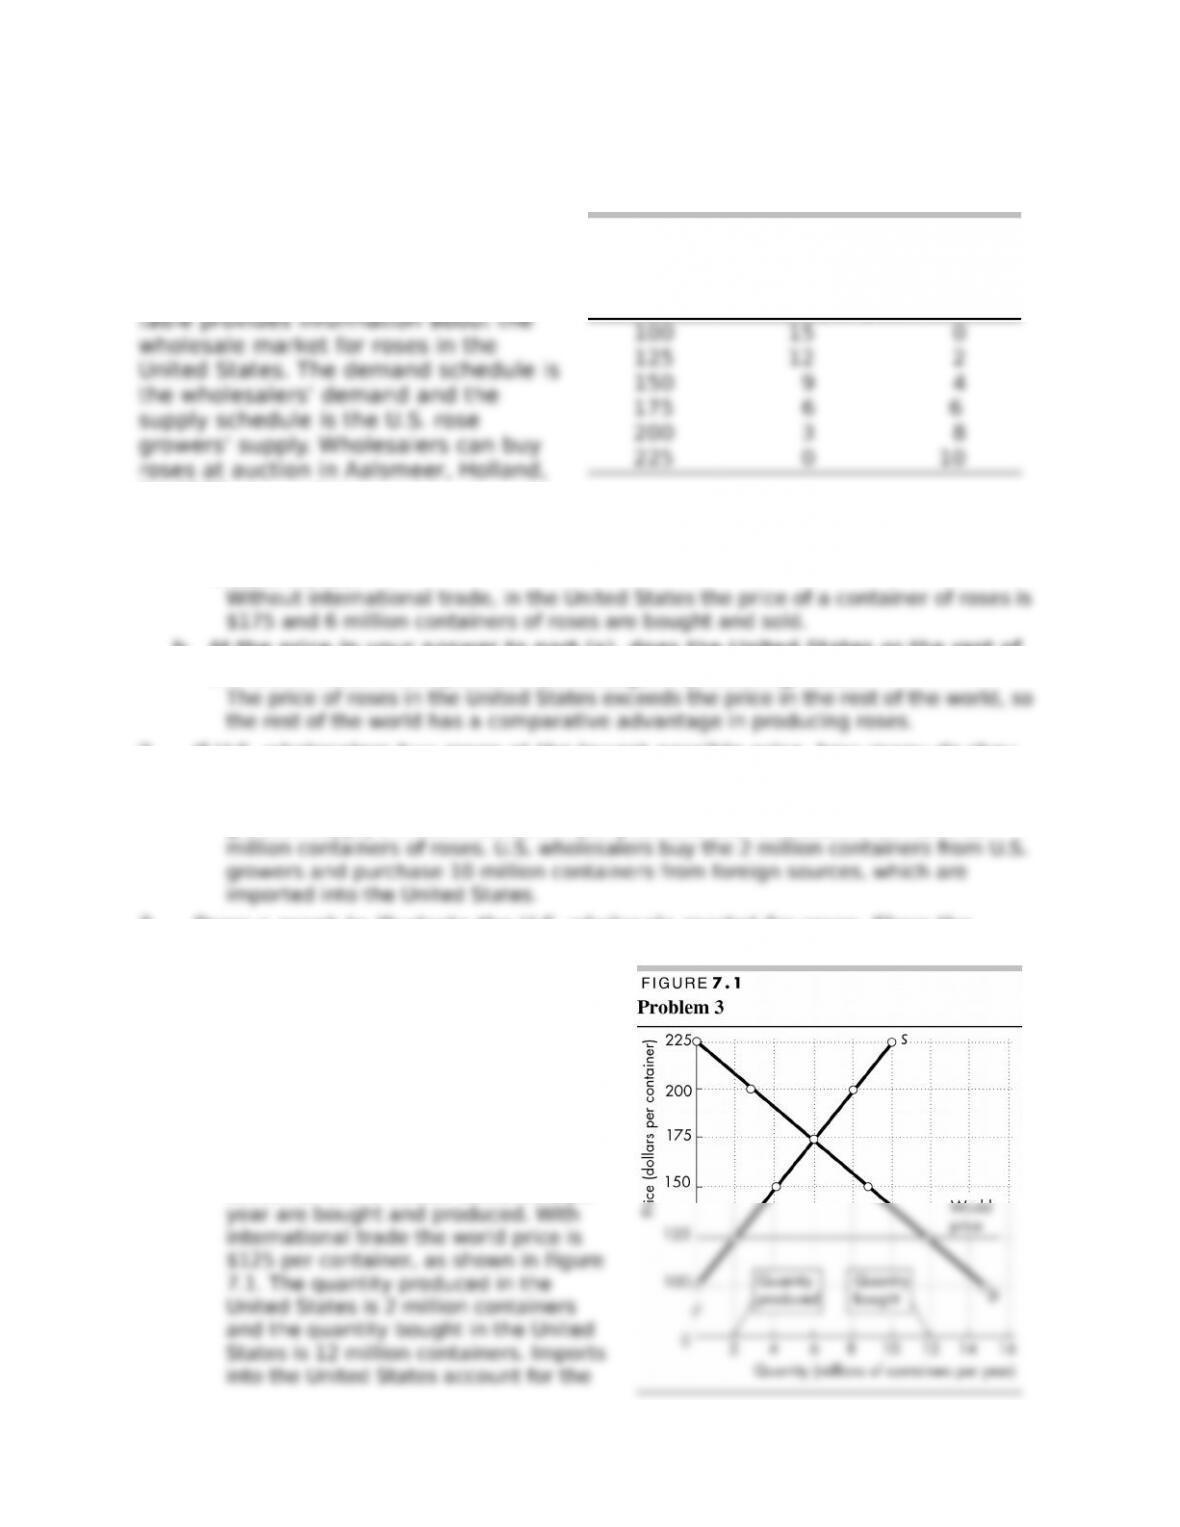
3. Draw a graph to illustrate the U.S. wholesale market for roses. Show the
equilibrium in that market with no international trade and the equilibrium with
free trade. Mark the quantity of roses
produced in the United States, the
quantity imported, and the total
quantity bought.
In Figure 7.1, the equilibrium without
international trade is determined at the
intersection of the demand curve and
the supply curve. Without international
trade the equilibrium price is $175 per
container and 6 million containers per
Price
(dollars
per
container)
Quantity
demanded
Quantity
supplied
(millions of containers
per year)
4. Use the information on the U.S. wholesale market for roses in Problem 1 to
a. Explain who gains and who loses from free international trade in roses
compared to a situation in which Americans buy only roses grown in the
United States.
U.S. rose wholesalers, who are the consumers in the problem, gain from free
b. Draw a graph to illustrate the gains
and losses from free trade.
Figure 7.2 illustrates the market with free
trade. Consumer surplus before
international trade is equal to area A;
c. Calculate the gain from international
trade.
The gain from international trade is area
Use the information on the U.S. wholesale market for roses in Problem 1 to work
Problems 5 to 10.
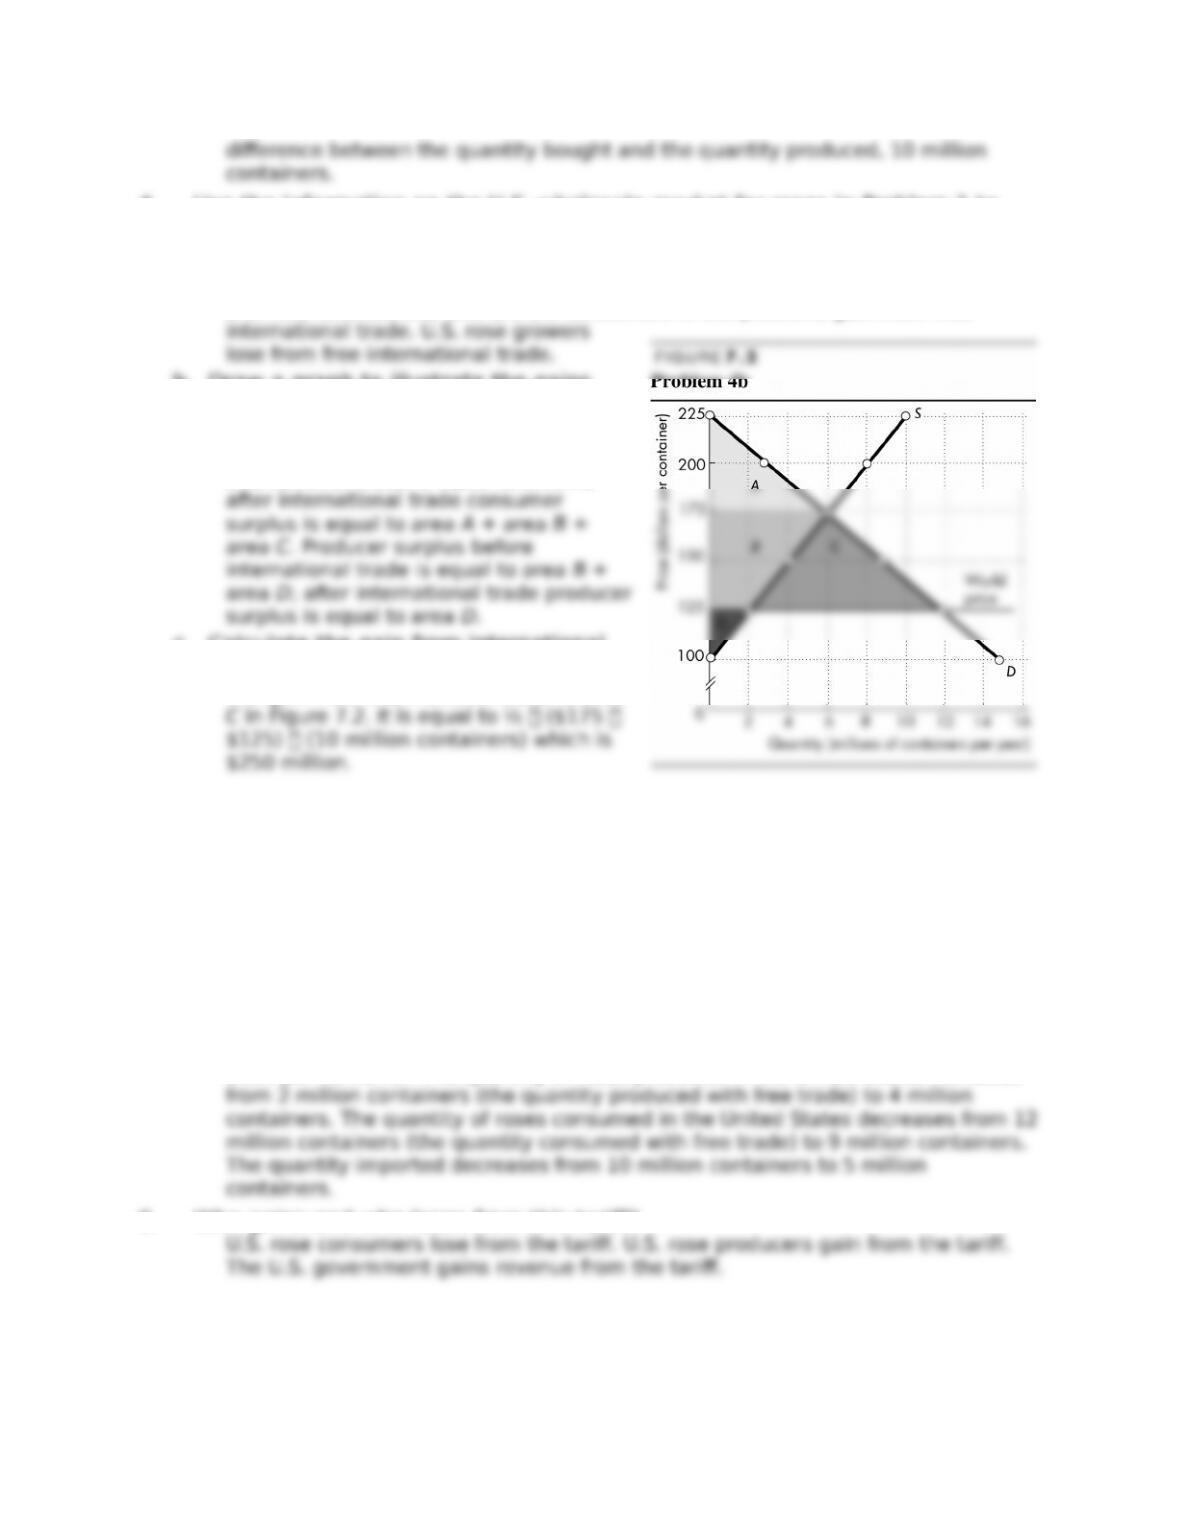
5. If the United States puts a tari, of $25 per container on imports of roses,
explain how the U.S. price of roses, the quantity of roses bought, the quantity
produced in the United States, and the quantity imported changed.
The U.S. price of roses rises from $125 per container (the price with free trade) to
$150 per container. The quantity of roses produced in the United States increases
6. Who gains and who loses from this tari,?
© 2016 Pearson Education, Inc.
9 0 C H A P T E R 7
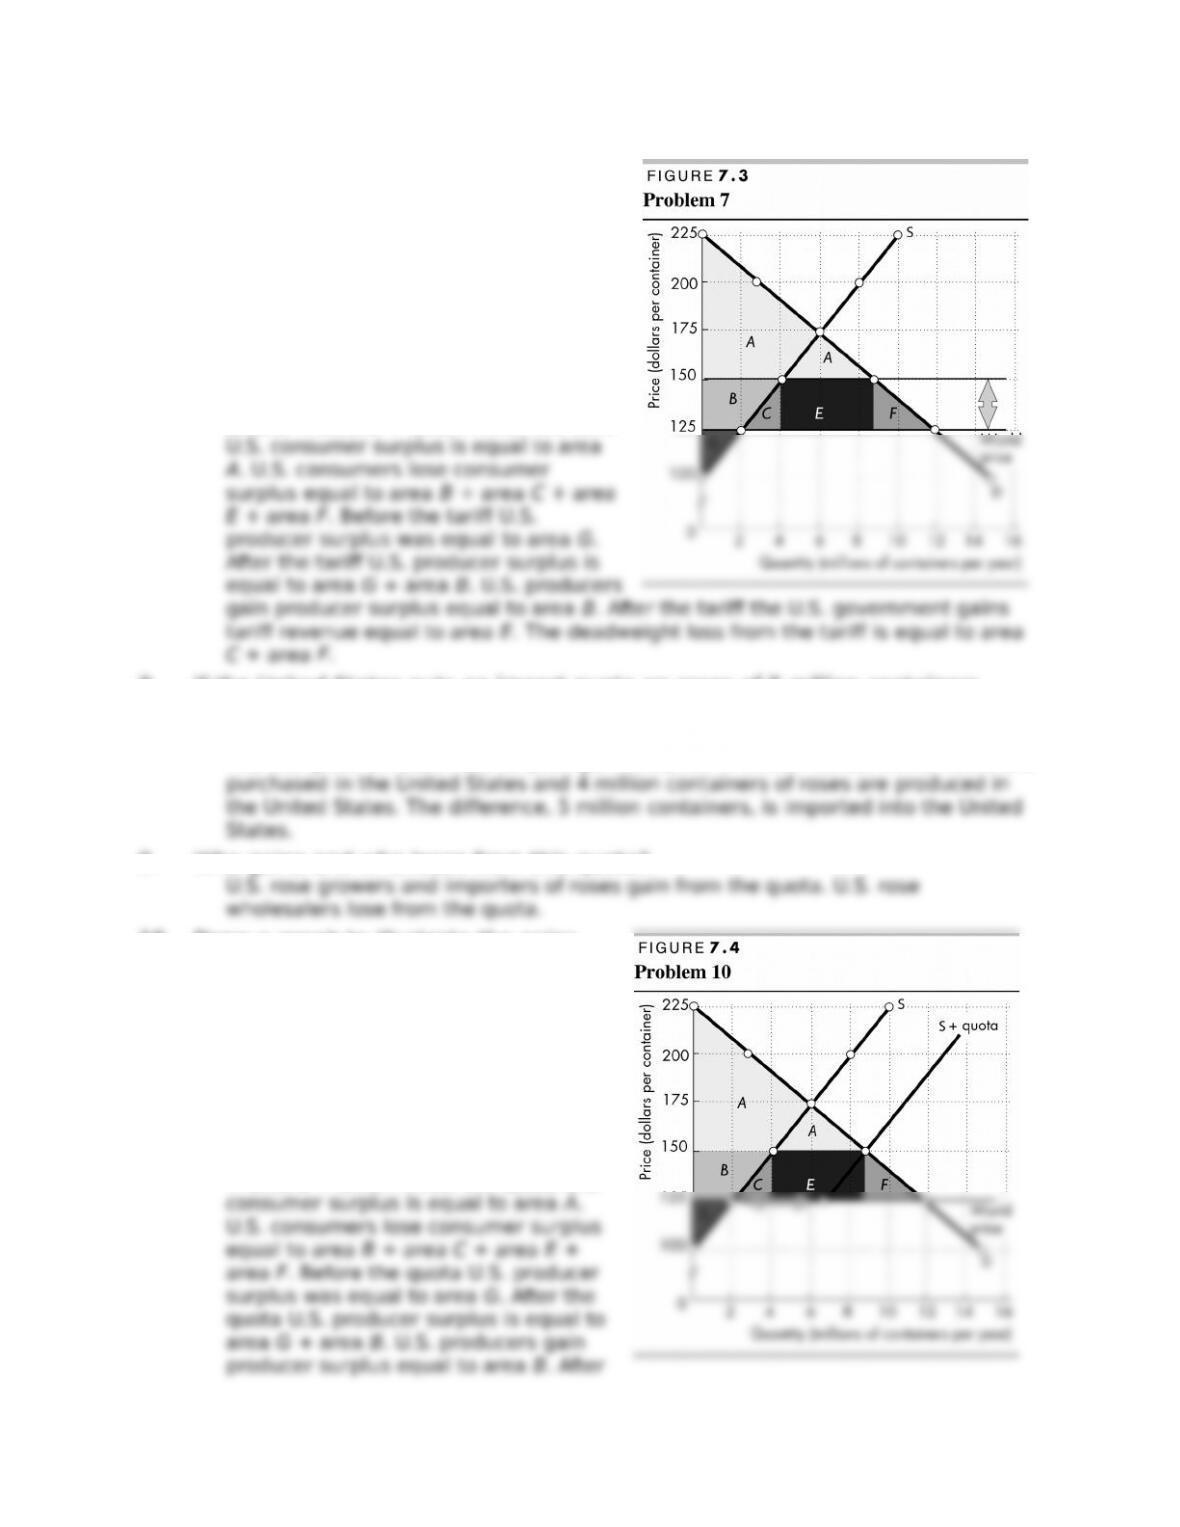
7. Draw a graph of the U.S. market for
roses to illustrate the gains and losses
from the tari, and on the graph
identify the gains and losses, the tari,
revenue, and the deadweight loss
created.
Figure 7.3 shows the e,ect of the tari,.
The amount of the tari, per container is
equal to the height of the light gray
arrow. Before the tari, U.S. consumer
surplus was equal to area A + area B +
area C + area E + area F. After the tari,
8. If the United States puts an import quota on roses of 5 million containers,
what happens to the U.S. price of roses, the quantity of roses bought, the
quantity produced in the United States, and the quantity imported?
The U.S. price of roses rises to $150 per container. 9 million containers of roses are
9. Who gains and who loses from this quota?
10. Draw a graph to illustrate the gains
and losses from the import quota and
on the graph identify the gains and
losses, the importers’ pro=t, and the
deadweight loss.
Figure 7.4 shows the e,ect of the
import quota. The amount of the quota
is equal to the length of the gray arrow.
Before the quota U.S. consumer surplus
was equal to area A + area B + area C
+ area E + area F. After the quota U.S.

© 2016 Pearson Education, Inc.
9 2 C H A P T E R 7
11. Chinese Tire Maker Rejects Charge of Defects
U.S. regulators ordered the recall of more than 450,000 faulty tires. The
Chinese producer of the tires disputed the allegations and hinted that the
recall might be an e,ort to hamper Chinese exports to the United States.
Source: International Herald Tribune, June 26, 2007
a. What does the news clip imply about the comparative advantage of
producing tires in the United States and China?
b. Could product quality be a valid argument against free trade? If it could,
explain how.
Product quality is not a valid argument against free trade. Quality is a valid
concern for consumers. If consumers cannot judge quality themselves, then
government inspection might be necessary. But in that case government
Answers to Additional Problems and Applications
12. Suppose that the world price of sugar is 10 cents a pound, the United States
does not trade internationally, and the equilibrium price of sugar in the
United States is 20 cents a pound. The United States then begins to trade
internationally.
a. How does the price of sugar in the United States change?
b. Do U.S. consumers buy more or less sugar?
c. Do U.S. sugar growers produce more or less sugar?
d. Does the United States export or import sugar and why?
13. Suppose that the world price of steel is $100 a ton, India does not trade
internationally, and the equilibrium price of steel in India is $60 a ton. India
then begins to trade internationally.
a. How does the price of steel in India change?
b. How does the quantity of steel produced in India change?
c. How does the quantity of steel bought by India change?
d. Does India export or import steel and why?
14. A semiconductor is a key
component in your laptop, cell
phone, and iPod. The table provides
information about the market for
semiconductors in the United
States. Producers of semiconductors
can get $18 a unit on the world
market.
a. With no international trade, what
would be the price of a
semiconductor and how many
semiconductors a year would be bought and sold in the United States?
b. Does the United States have a comparative advantage in producing
semiconductors?
15. Act Now, Eat Later
The hunger crisis in poor countries has its roots in U.S. and European policies
of subsidizing the diversion of food crops to produce biofuels like corn-based
ethanol. That is, doling out subsidies to put the world’s dinner into the gas
tank.
Source: Time, May 5, 2008
a. What is the e,ect on the world price of corn of the increased use of corn to
produce ethanol in the United States and Europe?
b. How does the change in the world price of corn a,ect the quantity of corn
produced in a poor developing country with a comparative advantage in
producing corn, the quantity it consumes, and the quantity that it either
exports or imports?
The higher world price of corn decreases the consumption of corn and increases
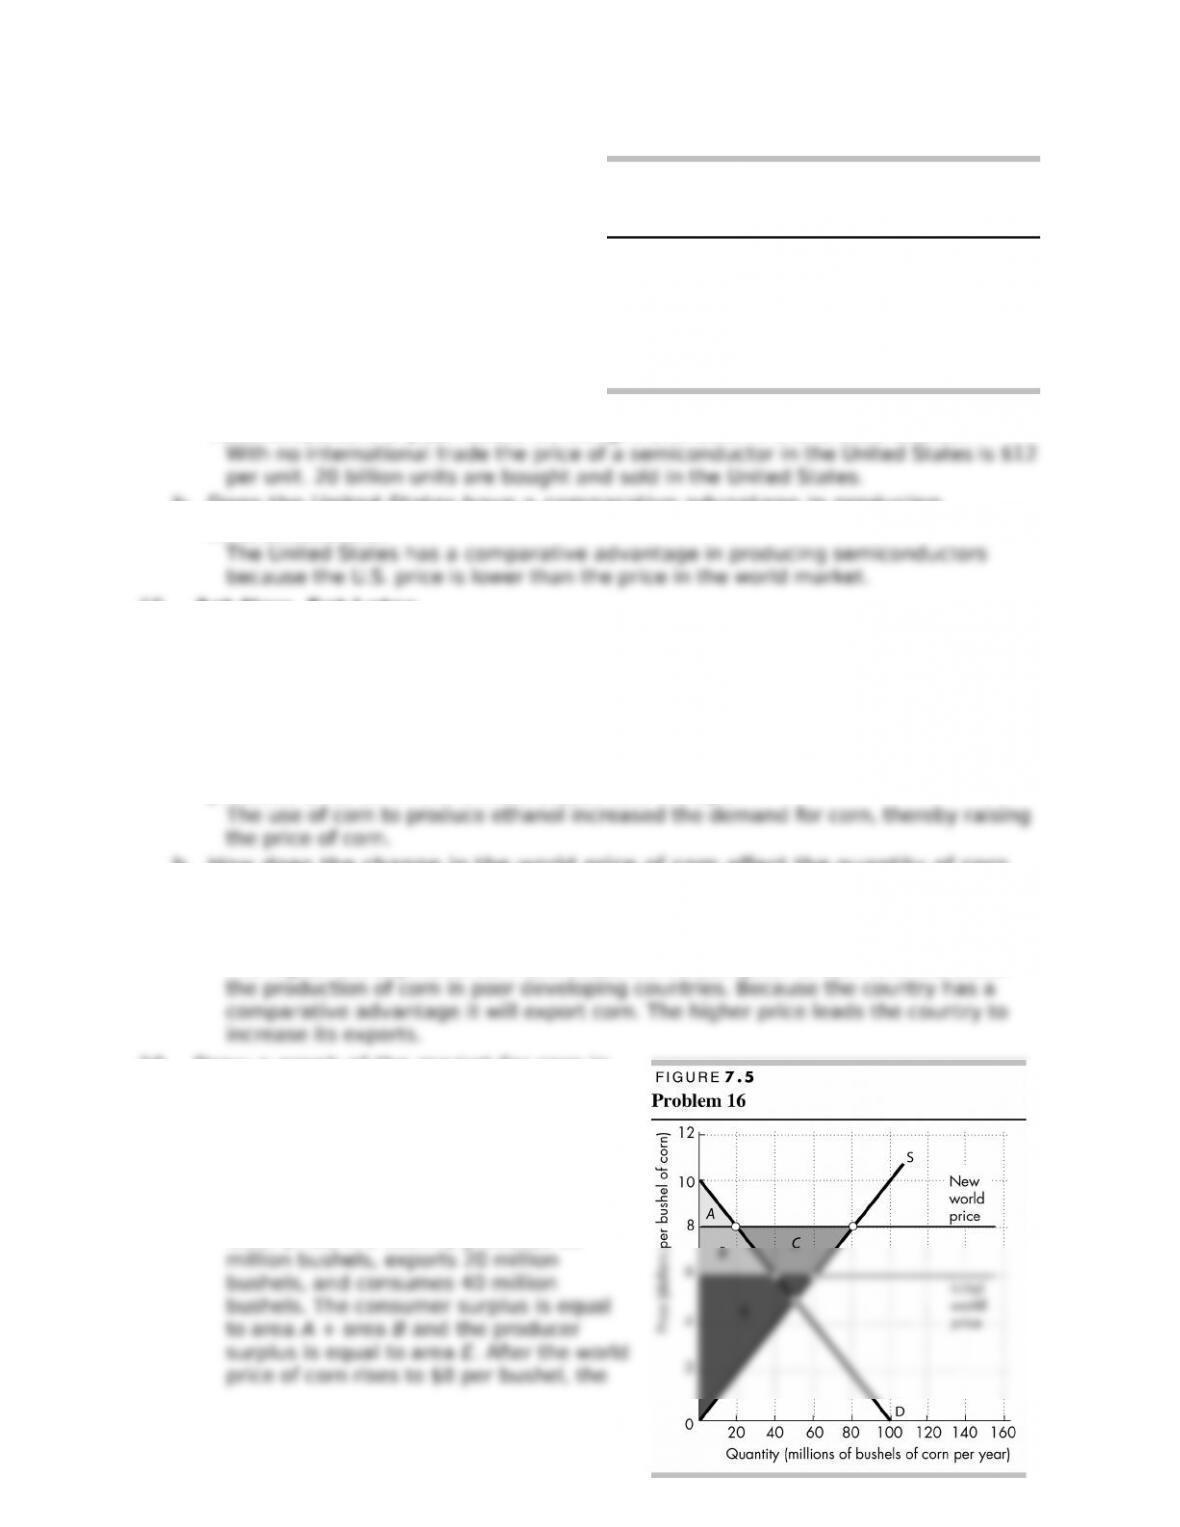
16. Draw a graph of the market for corn in
the poor developing country in Problem
15(b) to show the changes in consumer
surplus, producer surplus, and
deadweight loss.
Figure 7.5 shows the situation in the poor
country that exports corn. With the initial
lower price, the country produces 60
© 2016 Pearson Education, Inc.
Price
(dollars
per unit)
Quantity
demanded
Quantity
supplied
(billions of units per year)
10 25 0
12 20 20
14 15 40
16 10 60
18 5 80
20 0 100
9 4 C H A P T E R 7

Use the following news clip to work Problems 17 and 18.