W H AT I S E C O N O M I C S ? 9 5
A n s w e r s t o t h e R e v i e w Q u i z z e s
Page 130
1. What is a rent ceiling and what are its eects if it is set above the equilibrium
rent?
A rent ceiling is a speci&c example of a price ceiling. A rent ceiling is a government
imposed regulation that makes it illegal to charge a rent higher than a speci&ed
2. What are the eects of a rent ceiling that is set below the equilibrium rent?
If the rent ceiling is set below the equilibrium rent, the quantity of housing units
demanded by renters exceeds the quantity supplied by landlords. Since landlords
3. How are scarce housing resources allocated when a rent ceiling is in place?
With an eective rent ceiling, some means for allocation of housing units (other
than by price) becomes necessary. Some housing is allocated by &rst-come,
4. Why does a rent ceiling create an ine2cient and unfair outcome in the
housing market?
A rent ceiling creates ine2ciency because at the quantity of apartments that are
rented, the marginal social bene&t exceeds the marginal social cost. Rent ceilings
Page 133
1. What is a minimum wage and what are its eects if it is set above the
equilibrium wage?
A minimum wage is a price 6oor applied to the labor market. A minimum wage is a
government imposed regulation that makes it illegal to charge (or pay) a wage
6 GOVERNMENT
ACTIONS IN
MARKETS
95
9 6
2. What are the eects of a minimum wage set below the equilibrium wage?
If the minimum wage is set below the equilibrium wage, then the law has no
3. Explain how scarce jobs are allocated when a minimum wage is in place.
If a minimum wage is set above the equilibrium wage, the ability of the
competitive market to allocate resources is thwarted and other means must be
4. Explain why a minimum wage creates an ine2cient allocation of labor
resources.
A competitive labor market allowed to reach its equilibrium creates an e2cient
allocation of resources. At the equilibrium, the amount of employment is such that
the marginal social cost of labor to workers equals the marginal social bene&t from
5. Explain why a minimum wage is unfair.
Workers who receive wage hikes and retain their jobs gain from the minimum
wage but workers who lose their jobs and workers who must extensively search for
a job lose. Those who keep (or &nd) jobs are not necessarily the least well o, so
Page 138
1. How does the elasticity of demand in6uence the incidence of a tax, the tax
revenue, and the deadweight loss?
The more elastic the demand for a given supply, the smaller the increase in the
price paid by the buyers and the greater the decrease in the price received by the
2. How does the elasticity of supply in6uence the incidence of a tax, the
quantity bought, the tax revenue, and the deadweight loss?
The more elastic the supply for a given demand the larger the increase in the price
paid by the buyers and the smaller the decrease in the price received by the
3. Why is a tax ine2cient?
The imposition of a tax on a market causes a wedge to be driven between the price
received by the seller and the price paid by the buyer. This causes the marginal
96
W H A T I S E C O N O M I C S ? 9 7
4. When would a tax be e2cient?
A tax is e2cient, that is, creates no deadweight loss, when demand is perfectly
5. What are the two principles of fairness that are applied to tax systems?
The two principles of fairness are the bene&ts principle and the ability-to-pay
principle. The bene&ts principle asserts that people should pay taxes equal to the
Page 141
1. Summarize the eects of a production quota on the market price and the
quantity produced.
2. Explain why a production quota is ine2cient.
A production quota is ine2cient because it decreases production. As a result the
marginal social bene&t of the last unit produced exceeds the marginal cost.
3. Explain why a voluntary production quota is di2cult to operate.
A voluntary quota is di2cult to operate because a production quota results in a
massive incentive to “cheat” on the production quota by increasing production. A
production quota decreases the quantity produced. By decreasing the quantity
4. Summarize the eects of a subsidy on the market price and the quantity
produced.
A subsidy increases the price received by sellers, shifts the supply curve rightward,
and places a wedge between the marginal social bene&t and marginal social cost
5. Explain why a subsidy is ine2cient.
A subsidy creates ine2ciency because a subsidy leads to a lower price and
increased production. Marginal social bene&t equals the price and so the lower
97
9 8
Page 143
1. How does the imposition of a penalty for selling an illegal drug in6uence
demand, supply, price, and the quantity of the drug consumed?
If the penalty is levied on the seller, the penalty is added to the minimum price
required for supplying the good or service. The demand curve remains unchanged
but the supply curve shifts leftward, so that the vertical distance between the
2. How does the imposition of a penalty for possessing an illegal drug in6uence
demand, supply, price, and the quantity of the drug consumed?
If the penalty is levied on the buyer, the penalty is subtracted from the maximum
willingness to pay for the good. The supply curve remains unchanged and the
3. How does the imposition of a penalty for selling or possessing an illegal drug
in6uence demand, supply, price, and the quantity of the drug consumed?
If buyers and sellers face penalties, both the demand and supply curves shift
leftward. If the shift of the supply curve is larger, the equilibrium price rises and
4. Is there any case for legalizing drugs?
To reduce the consumption of drugs, they can be legalized and taxed. Legalizing
and then taxing drugs has the bene&t of raising funds for the government that
could be used to help educate people about the danger of consuming drugs.
98
A n s w e r s t o t h e S t u d y P l a n P r o b l e m s a n d
A p p l i c a t i o n s
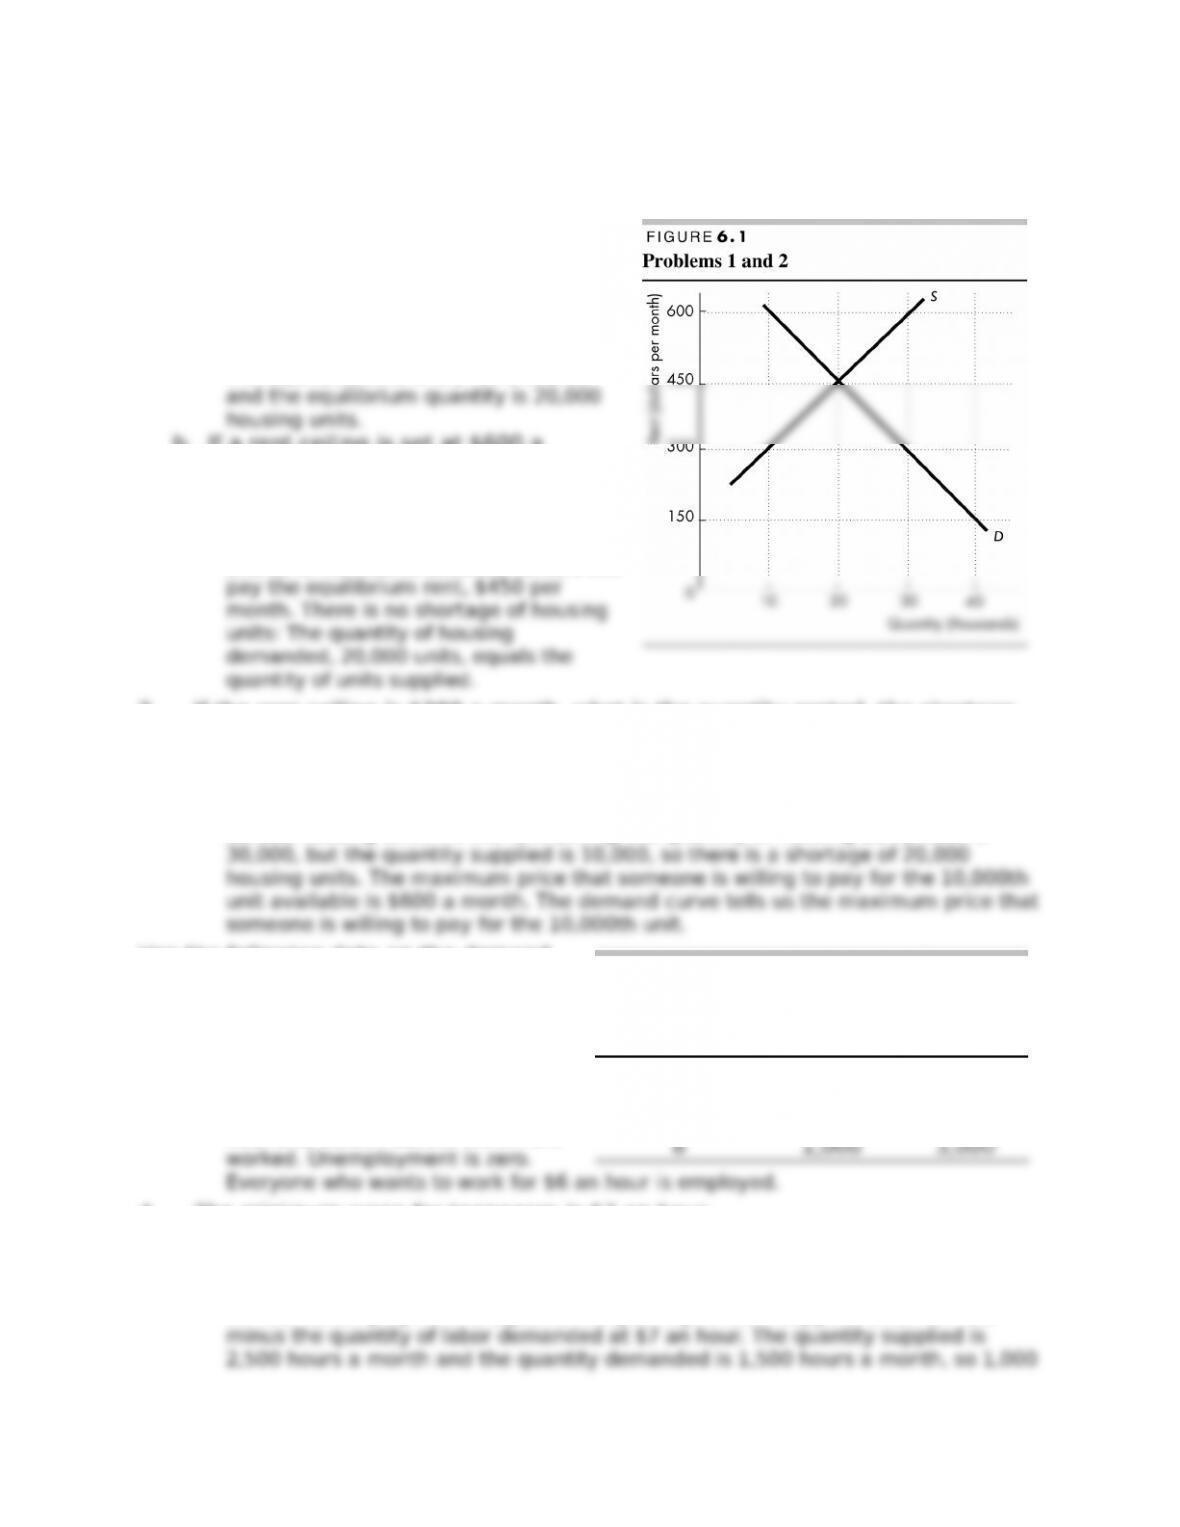
Use Figure 6.1, which shows the market for
rental housing in Townsville, to work
Problems 1 and 2.
1. a. What are the equilibrium rent and
equilibrium quantity of rental
housing?
The equilibrium rent is $450 a month
b. If a rent ceiling is set at $600 a
month, what is the rent paid? What is
the shortage of housing?
If the rent ceiling is set at $600 per
month, it is above the equilibrium rent
and so is ineective because renters still
2. If the rent ceiling is $300 a month, what is the quantity rented, the shortage
of housing, and the maximum price that someone is willing to pay for the last
unit of housing available?
The quantity rented is 10,000 housing units. The quantity of housing rented is
equal to the quantity supplied at the rent ceiling. The shortage of housing is
20,000 housing units. At the rent ceiling, the quantity of housing demanded is
Use the following data on the demand
and supply schedules of teenage labor
to work Problems 3 and4.
3. Calculate the equilibrium wage
rate, the hours worked, and the
quantity of unemployment.
The equilibrium wage rate is $6 an
hour and 2,000 hours a month are
4. The minimum wage for teenagers is $7 an hour,
a. How many hours are unemployed?
At $7 an hour, 1,500 hours a month are employed and 1,000 hours a month are
unemployed. The quantity of labor employed equals the quantity demanded at $7
an hour. Unemployment is equal to the quantity of labor supplied at $7 an hour
Wage rate
(dollars per
hour)
Quantity
demanded
Quantity
supplied
(hours per month)
5 2,500 1,500
6 2,000 2,000
7 1,500 2,500
8 1,000 3,000
b. If the demand for teenage labor increases by 500 hours a month, what is the
wage rate and how many hours are unemployed?
The wage rate is $7 an hour, and unemployment is 500 hours a month. At the
minimum wage of $7 an hour, the quantity demanded is 2,000 hours a month and
5. The table sets out the demand and
supply schedules for chocolate
brownies.
a. If sellers are taxed 20¢ a brownie,
what is the price and who pays
the tax?
The price paid by buyers, including
the tax, is 70 cents a brownie. The
b. If buyers are taxed 20¢ a brownie, what is the price and who pays the tax?
The price received by sellers, excluding the tax, is 50 cents a brownie, and 3
Use the following data to work Problems 6 and 7.
The demand and supply schedules for rice
are in the table.
Calculate the price, the marginal cost of
rice, and the quantity produced if the
government
6. Sets a production quota of 2,000 boxes
a week.
With a production quota of 2,000 boxes
a week, the price is $1.60 a box, the
marginal cost $1.30 a box, and the
7. Introduces a subsidy of $0.30 a box.
With a subsidy of $0.30 a box for rice, the price is $1.20 a box, the marginal cost
$1.50 a box, and the quantity produced is 3,000 boxes a week. The subsidy of
$0.30 lowers the price at which each quantity in the table is supplied. For example,
Price
(cents per
brownie)
Quantity
demande
d
Quantity
supplied
(millions per day)
50 5 3
60 4 4
70 3 5
80 2 6
Price
(dollars per
box)
Quantity
demande
d
Quantity
supplied
(boxes per week)
1.20 3,000 1,500
1.30 2,750 2,000
1.40 2,500 2,500
1.50 2,250 3,000
1.60 2,000 3,500
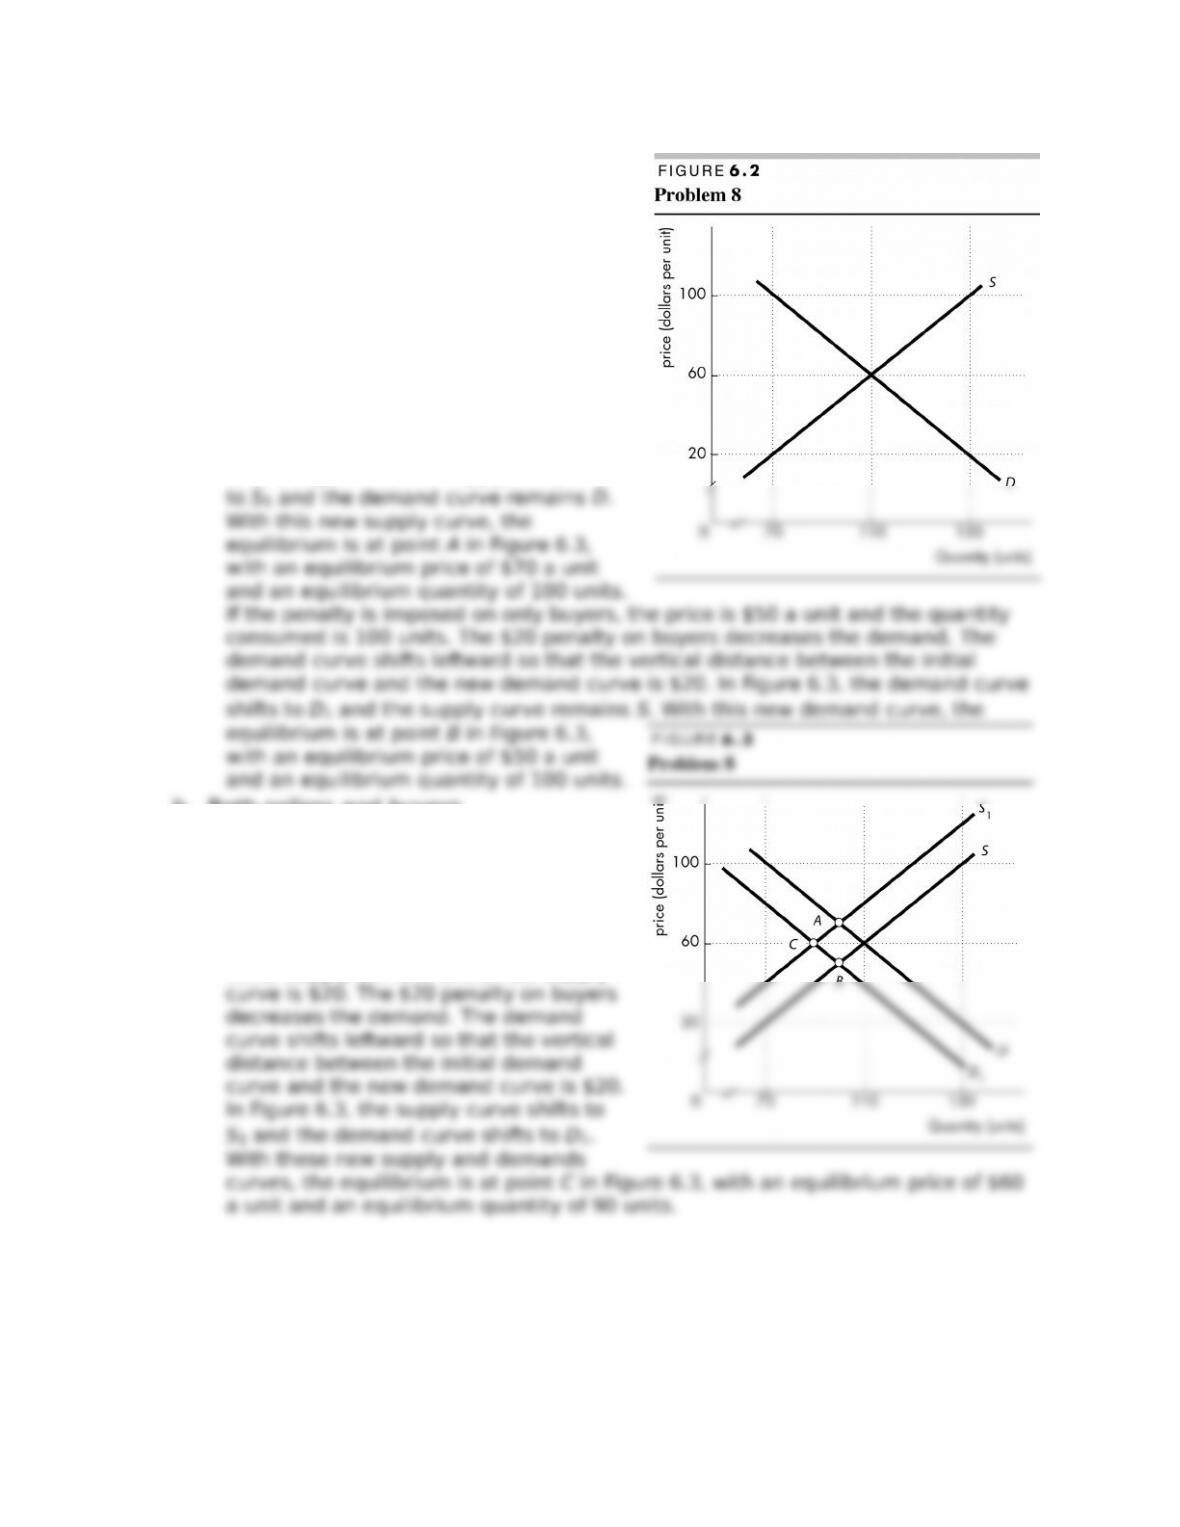
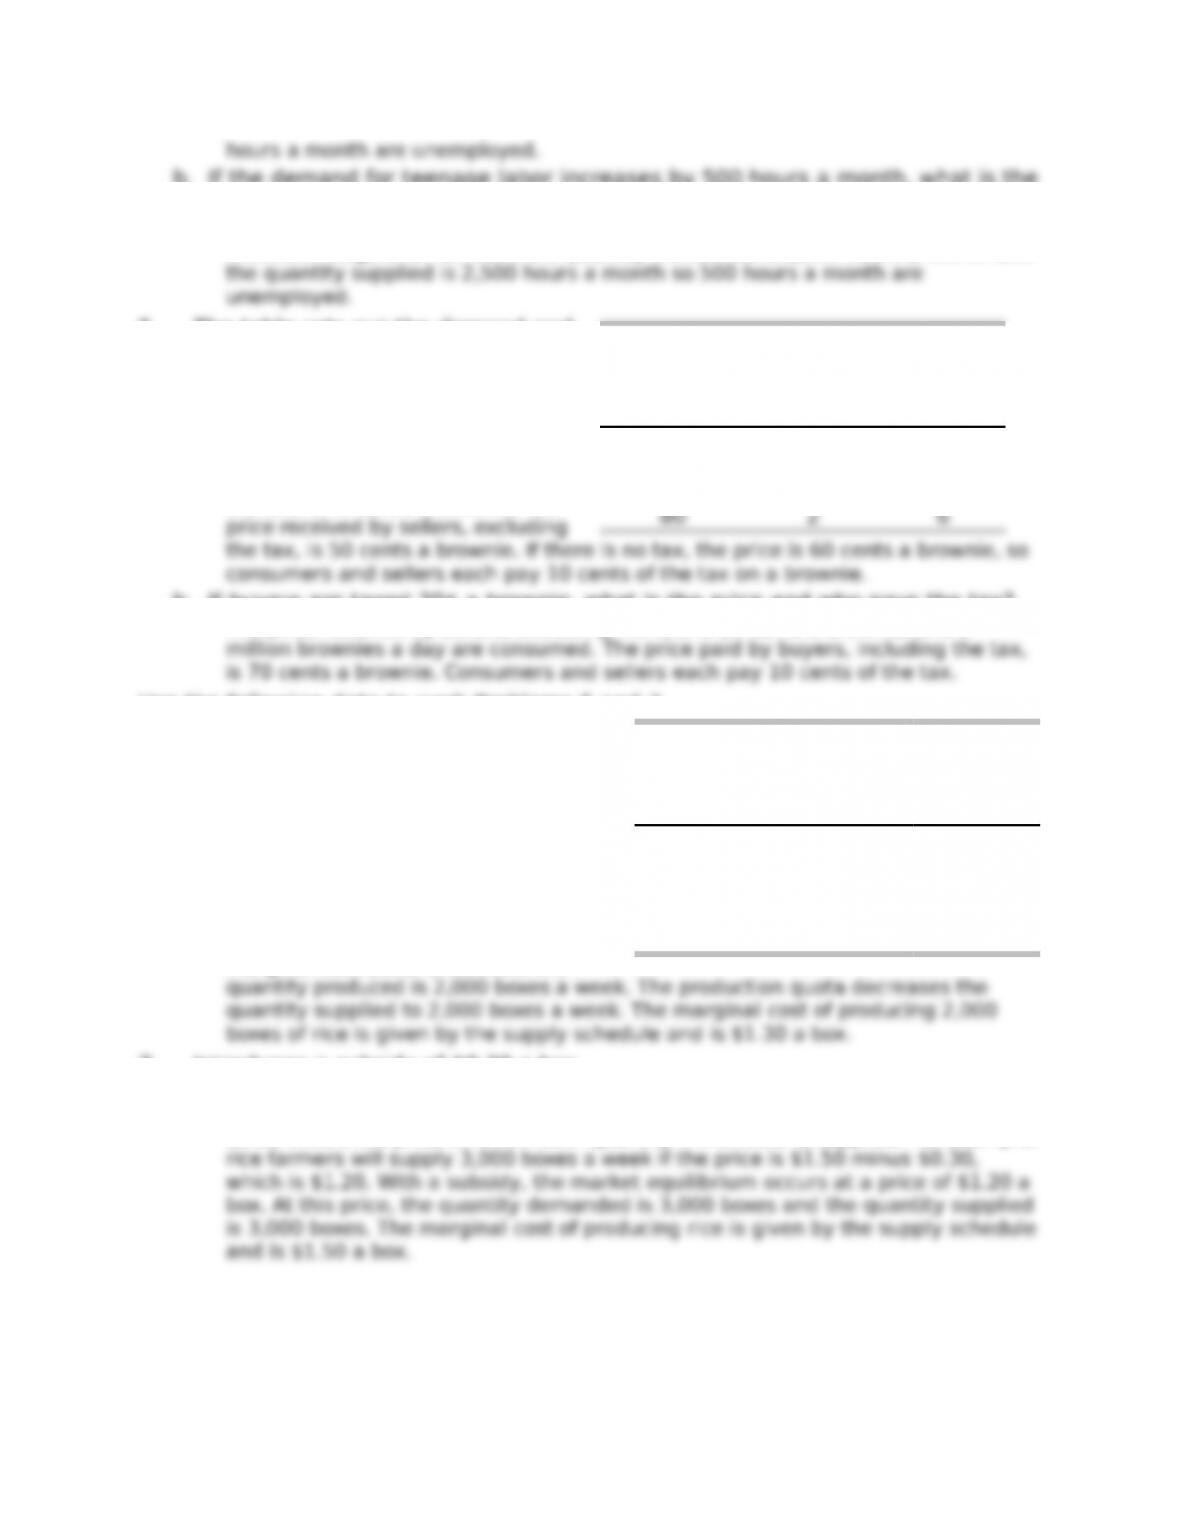
8. Figure 6.2 shows the market for an
illegal good.
Calculate the market price and the
quantity bought if a penalty of $20 a
unit is imposed on
a. Sellers only or buyers only.
With a penalty of $20 a unit on sellers,
the price is $70 a unit and the quantity
consumed is 100 units. The $20 penalty
on sellers decreases the supply. The
supply curve shifts leftward so that the
vertical distance between the initial
supply curve and the new supply curve is
$20. In Figure 6.3, the supply curve shifts
b. Both sellers and buyers.
With a penalty of $20 a unit on sellers
and on buyers, the price is $60 a unit
and the quantity consumed is 90 units.
The $20 penalty on sellers decreases the
supply. The supply curve shifts leftward
so that the vertical distance between the
initial supply curve and the new supply