A d d i t i o n a l P r o b l e m s
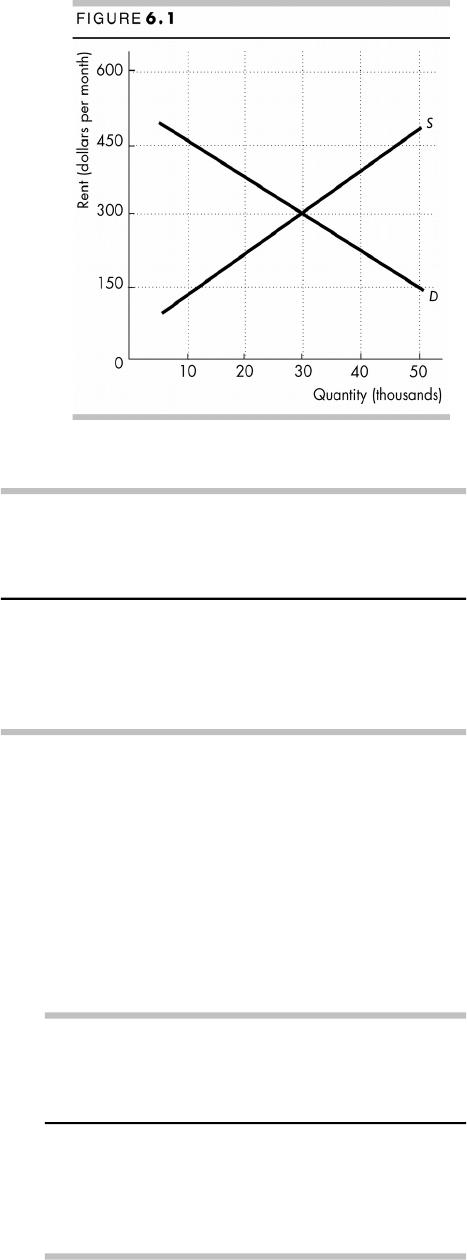
1. Figure 6.1 shows the demand for and
supply of rental housing in Township.
a. What are the equilibrium rent and
equilibrium quantity of rental housing?
If a rent ceiling is set at $150 a month, what is
b. The quantity of housing rented?
c. The shortage of housing?
d. The maximum price that someone is
willing to pay for the last unit available?
2. The table gives the demand
schedule and the supply schedule
for high school graduates.
a. What is the equilibrium wage and
the equilibrium quantity of
employment.
b. What is the number of hours of
labor unemployed?
c. If a minimum wage is set at $7
an hour, how many hours do high
school graduates work?
d. If a minimum wage is set at $7 an hour, how many hours of labor are
unemployed?
e. If a minimum wage is set at $9 an hour, what are the number of hours of
labor employed and the number of hours of labor unemployed?
f. If the minimum wage is $9 an hour and demand increases by 500 hours a
month, what is the wage rate paid to high school graduates and how many
hours of their labor are unemployed?
3. The demand and supply schedules for
co*ee are given in the table.
a. If there is no tax on co*ee, what is
the price of a cup of co*ee and how
much co*ee is bought?
b. If a tax of 75¢ a cup is introduced,
what is the price of a cup of co*ee
and how much co*ee is bought? Who
pays the tax?
Wage rate
(dollars per
hour)
Quantity
demande
d
Quantity
supplied
(hours per month)
6 9,000 4,000
7 8,000 5,000
8 7,000 6,000
9 6,000 7,000
10 5,000 8,000
Price
(dollars per
cup)
Quantity
demand
ed
Quantity
supplied
(cups per hour)
1.50 90 30
1.75 70 40
2.00 50 50
2.25 30 60
2.50 10 70
S o l u t i o n s t o A d d i t i o n a l P r o b l e m s
1. a. Equilibrium rent is $300 a month and the equilibrium quantity is 30,000 housing
units.
b. The quantity rented is 10,000 housing units. The quantity of housing rented is equal
to the quantity supplied at the rent ceiling.
c. The shortage of housing is 40,000 housing units. At the rent ceiling, the quantity of
housing demanded is 50,000, but the quantity supplied is 10,000, so there is a
shortage of 40,000 housing units.
d. The maximum price that someone is willing to pay for the 10,000th unit available is
$450 a month. The demand curve tells us the maximum price that someone is
willing to pay for the 10,000th unit.
2. a. The equilibrium wage rate is $8.50 an hour, and employment is 6,500 hours a
month.
b. Unemployment is zero. Everyone who wants to work for $8.50 an hour is employed.
c. They work 6,500 hours a month. A minimum wage rate is the lowest wage rate that
a person can be paid for an hour of work. Because the equilibrium wage exceeds the
minimum wage, the minimum wage is ine*ective. The wage rate will be $8.50 an
hour and employment is 6,500 hours.
d. There is no unemployment. The wage rate rises to the equilibrium wage—the
quantity of labor demanded equals the quantity of labor supplied. So there is no
unemployment.
e. At $9 an hour, 6,000 hours a month are employed and 1,000 hours a month are
unemployed. The quantity of labor employed equals the quantity demanded at $9
an hour. Unemployment is equal to the quantity of labor supplied at $9 an hour
minus the quantity of labor demanded at $9 an hour. The quantity supplied is 7,000
hours a month, and the quantity demanded is 6,000 hours a month. So 1,000 hours
a month are unemployed.
f. The wage rate is $9 an hour, and unemployment is 500 hours a month. At the
minimum wage of $9 an hour, the quantity demanded is 6,500 hours a month and
the quantity supplied is 7,000 hours a month. So 500 hours a month are
unemployed.
3. a. With no tax on co*ee, the price is $2.00 a cup and 50 cups an hour are bought.
b. The price is $2.25 a cup, and 30 cups an hour are bought. Consumers pay 25 cents
of the tax on a cup of co*ee and sellers pay 50 cents of the tax on a cup of co*ee.
The tax decreases the supply of co*ee and raises the price of co*ee. With no tax,
sellers are willing to sell 30 cups an hour at $1.50 a cup. But with a 75 cent tax, they
are willing to sell 30 cups an hour only if the price is 75 cents higher at $2.25 a cup.
A d d i t i o n a l D i s c u s s i o n Q u e s t i o n s
1. Do rent controls improve the quality of life for university students?
The following provides a useful example to make the issue of market price
regulation personally relevant for the students. Inform them that the
University of California is located in the city of Berkeley, California, where the
city government imposes strict rent controls. The University of Florida is
located in Gainesville, Florida, where there are no rent controls.
In which city would you expect incoming freshman students to have
the least trouble renting an apartment? The students should understand
that while apartments with low monthly rents would be very nice, they would
also be very scarce due to a market shortage. Emphasize that under a rent
control policy, not only are there fewer apartments for lease than if the market
were unregulated, there are also many more students looking for an
apartment who wouldn’t have even thought about renting at the higher rental
rates of the unregulated market.
Who ultimately gets the apartments? Students should see that the
available units must be allocated somehow. Too many students trying to locate
too few apartments means a new student will face the following di<culties:
Signi?cant increase in search costs, such as time spent, gasoline
consumed, and promising leads followed for nothing, etc.
Greater risk of being rejected by landlords simply for being the “wrong”
race or ethnic background; having the “wrong” religious beliefs or personal
attributes.
Unscrupulous landlords requiring huge deposits; charging premiums for
electricity or natural gas consumed; gouging the renters for minor
maintenance actions; delaying important repairs to air conditioning or
heating units or leaking plumbing ?xtures.
If rent control laws fail to promote fairness, what about eciency?
Students should see that having a rent control policy means the economy
su*ers from three sources of ine<ciency (meaning net bene?ts to society are
not maximized):
Those who get an apartment are not always the ones who value it the
most.
Di*erence in the marginal bene?t and marginal cost at the level of housing
produced means that too few resources are used for producing the rental
housing market, creating a deadweight loss.
Underused resources in the rental housing market imply that too many
resources are used in other markets, resulting in the overproduction of
goods and services in those markets.
2. After the OPEC oil embargo in the 1970s, price controls were placed
on gas markets that did not allow price to rise to the market clearing
level. Gas shortages resulted as did black markets. Use the analysis
provided in Chapter 6 on the use of price controls to discuss whether
price controls likely hurt or helped consumers and the economy.
Consider the following:
Who is helped and harmed by price ceilings?
Had gas prices been allowed to increase sharply, would we have made
changes in our economy faster? At what cost?
How does the elasticity of demand and supply impact the degree to which
price and quantity would change in the gasoline market?
Price controls on gas meant people had to deal with gas shortages, informal
rationing, and black markets, which reduced their ability to purchase gasoline
even if the price of gasoline did not rise enough to reFect the change in market
conditions. Firms paying higher costs and unable to charge higher prices would
leave the market, willingly or through economic losses. Higher prices create
incentives for people to reduce their purchases and ?nd substitutes. Higher
prices increase incentives for ?rms to develop alternate sources.
3. Will raising the minimum wage help or hurt those who need help the
most? This question makes students apply simple demand and supply
analysis to discover the counter-intuitive implications from market regulation
policies. Point out that minimum wage laws have at least two devastating
impacts on the very people that supporters of a minimum wage say need
these jobs the very most:
The higher wage attracts people with higher quali?cations—like college
students—to seek unskilled labor jobs that they wouldn’t otherwise seek
out at a lower, unregulated wage. This means unskilled laborers who are
heads of households are competing to get jobs against greater numbers of
relatively more educated college students with relatively greater human
capital.
Additionally, when employers determine which workers they are going to
lay o* after a raise in minimum wage takes e*ect, they are ?rst going to
release those employees with the least skills and the least experience.
Those are precisely the characteristics of many uneducated, minority
workers who are in the greatest need of retaining any paying job to ensure
a better future.
Students should understand that both of these results are the unintended
consequences of trying to manipulate the market forces of supply and
demand.
4. What speci.cally are the “ineciencies” of agriculture policies that
prop up farm prices? Get the students to integrate concepts from many
di*erent chapters with the following example of agricultural market regulation.
Inform students that the federal government regulates agriculture markets in
many ways: i) it pays farmers to NOT produce output to prop up farm prices;
ii) it uses output quotas to limit total farm production; and iii) it imposes price
Foors and pays farmers for any unsold, surplus quantities. Have the students
examine the impact of such market regulation and recognize that:
Too many resources are used in the agriculture markets, causing a
deadweight loss from overproduction. Too few resources are used in other
competitive, unregulated markets, causing deadweight loss from
underproduction. Remind the students that even if the deadweight losses
were not realized, society would still be moving to a lower valued point on
the production possibilities frontier.
The federal government uses additional resources managing the huge
surplus agricultural inventories, some of which (milk, e.g.) is very
perishable and requires expensive storage facilities. Much of these
perishable farm goods are spoiled before it is decided what could be done
with them without depressing the market price. This implies that society is
moving towards the interior of the production possibilities frontier. (If an
agricultural product cannot be stored, it can sometimes be converted to
other goods, like cheese. Alternatively, surplus product can be “dumped”
on the world market, thereby depressing the equilibrium price of the
product on the world market—to the detriment of small agrarian
countries.)
The higher prices for food are used to justify increases in food stamp
allotments to the poor and disadvantaged, increasing the tax revenues
necessary to pay for this program. Higher tax burdens increase the
deadweight loss to all markets that are taxed. This implies that society is
moving even further to the interior of the production possibilities frontier.
5.What are “sin taxes”? Ask your students to think about some of the markets
mentioned in the chapter that are heavily taxed (cigarettes, for example).
Alcohol purchases are also subject to federal excise taxes. Some of these taxes
are often referred to as “sin” taxes. Ask students why they think that is the
case. Consumption of cigarettes and alcohol is traditionally considered
somewhat “taboo” (or at least unhealthy), so purchases of these products are
subject to a sin tax. By taxing this consumption, the quantity consumed of
these goods will decrease (although not by much if the demand for these
goods is relatively inelastic).
Ask your students whether they think a tax on gasoline is a sin tax. While it
may not be “sinful” or unhealthy personally to buy gasoline, some
politicians actually favor increasing taxes on gasoline to further discourage
use of this scarce fossil fuel. They argue that use of gasoline is unhealthy
for the environment. As with other sin taxes, part of the motivation for the
tax on gasoline is the resulting reduction in consumption.
6. How are taxes related to tax revenues? In markets with relatively inelastic
demand, consumers bear most of the burden of taxes, and the quantity
purchased of those goods decreases only slightly in response to higher prices.
As a result, markets with relatively inelastic demand would also be expected to
generate high tax revenues. On the other hand, imposing taxes in markets
where demand is relatively elastic would result in large reductions in consumer
purchases and, ultimately, smaller collections of tax revenue.
Show this result to your students graphically, reminding them that “less
elastic” demand would be steeper and “more elastic” demand would be Fatter.
The area of tax revenue has a smaller base when the quantity consumers
purchase falls dramatically when prices rise (i.e., when a tax is imposed in a
market where demand is relatively elastic). The area of tax revenue has a
larger base when the quantity consumers purchase falls only a little when
prices rise after the tax (i.e., when a tax is imposed in a market where demand
is relatively inelastic).
Example: Use Figure 6.5 in the text. With a tax of $1.50 imposed in the
market, the price of cigarettes rises to $4, and the quantity purchased falls
from 350 million to 325 million. The government therefore collects ($1.50 x
325 million = $487.5 million) in revenue. What if the quantity of cigarettes
purchased had fallen only to 335 million instead of 325 million? In other words,
what if the demand for cigarettes was less elastic? Now the government would
collect (1.50 x 335 million = $502.5 million) in revenue. (Note that the “sin”
taxes placed in markets with relatively inelastic demand are likely to be the
very markets that generate the greatest government tax revenue as well.)
7. How are elasticity and deadweight loss related? Show your students
how the size of the deadweight loss triangle is related to elasticities as well.
With linear supply and demand curves, the area of deadweight loss is a
triangle with a height equal to the amount of the tax (the vertical distance
between the two supply or demand curves) and a base equal to the decrease
in the quantity purchased as a result of the tax. For any given tax, the only
di*erence in deadweight loss across two markets will be the size of the
decrease in the quantity purchased as a result of the tax. You can show this
graphically by showing deadweight loss when demand is relatively steep as
opposed to deadweight loss when demand is relatively Fat. Just make sure you
use the same tax (same vertical distance between the two supply curves) in
the comparison.
8. A Swedish economist famously noted that rent controls are possibly
the best way to destroy a city, except perhaps for bombing it. Explain
why this might be true. If rents are below market, it is hard for ?rms to
cover their production costs. As time passes, building maintenance su*ers,
roofs aren’t replaced, new construction is eliminated, and the housing stock
deteriorates.
9. USA Today recently reported that signi.cant increases in federal
cigarette taxes (more than $1 per pack) led to a signi.cant increase
in the number of people who quit smoking, especially among teens,
seniors, and low income individuals. Discuss what this means about
elasticity, potential government revenue from the cigarette tax, and
the goals government is trying to accomplish through “sin” tax
policy. Do governments really want people to quit? If enough people quit so
that the tax revenue falls, demand has hit the elastic portion of the curve. If
government truly wants people to quit, taxes must be high enough to reach
that portion of the curve. If government, however, wants tax revenue to help
meet budget goals, they do not want to set the tax so that it moves demand
into the elastic part of the demand. What do the students think is the “true”
goal of the government? You can return to this discussion after discussing
externalities when it will be even more meaningful.