W H AT I S E C O N O M I C S ? 3 9
A n s w e r s t o t h e R e v i e w Q u i z z e s
Page 56
1. What is the distinction between a money price and a relative price?
The money price of a good is the dollar amount that must be paid for it. The
2. Explain why a relative price is an opportunity cost.
The relative price of a good is the opportunity cost of buying that good because it
3. Think of examples of goods whose relative price has risen or fallen by a large
amount.
Some examples of items where both the money price and the relative price have
risen over time are gasoline, college tuition, and food. Some examples of items
Page 61
1. De&ne the quantity demanded of a good or service.
2. What is the law of demand and how do we illustrate it?
The law of demand states: “Other things remaining the same, the higher the price
of a good, the smaller is the quantity demanded; and the lower the price of a good,
3. What does the demand curve tell us about the price that consumers are
willing to pay?
For any &xed quantity of a good available, the vertical distance of the demand
3DEMAND AND
SUPPLY
39
4 0
4. List all the in6uences on buying plans that change demand, and for each
in6uence, say whether it increases or decreases demand.
In6uences that change the demand for a good include:
The prices of related goods. A rise (fall) in the price of a substitute increases
(decreases) the demand for the &rst good. A rise (fall) in the price of a
complement decreases (increases) the demand for the &rst good.
5. Why does demand not change when the price of a good changes with no
change in the other in6uences on buying plans?
If the price of a good falls and nothing else changes, then the quantity of the good
Page 65
1. De&ne the quantity supplied of a good or service.
2. What is the law of supply and how do we illustrate it?
The law of supply states that “other things remaining the same, the higher the
price of a good, the greater is the quantity supplied; and the lower the price of a
3. What does the supply curve tell us about the producer’s minimum supply
price?
For any quantity, the vertical distance between the supply curve and the x-axis
4. List all the in6uences on selling plans, and for each in6uence, say whether it
changes supply.
Changes in the price of the good change the quantity supplied. They do not
40
W H A T I S E C O N O M I C S ? 4 1
Prices of factor of production. A rise (fall) in the price of a factor of production
increases &rms’ costs of production and decreases (increases) the supply of
the good.
5. What happens to the quantity of cell phones supplied and the supply of cell
phones if the price of a cell phone falls?
If the price of cell phones falls and nothing else changes, then the quantity of cell
Page 67
1. What is the equilibrium price of a good or service?
The equilibrium price is the price at which the quantity demanded by the buyers is
2. Over what range of prices does a shortage arise? What happens to the price
when there is a shortage?
A shortage arises at market prices below the equilibrium price. A shortage causes
3. Over what range of prices does a surplus arise? What happens to the price
when there is a surplus?
A surplus arises at market prices above the equilibrium price. A surplus causes the
4. Why is the price at which the quantity demanded equals the quantity
supplied the equilibrium price?
At the equilibrium price, the quantity demanded by consumers equals the quantity
5. Why is the equilibrium price the best deal available for both buyers and
sellers?
The equilibrium price re6ects that the highest price consumers are willing to pay
for that amount of the good or service and is just equal to the minimum price that
41
4 2
Page 73
What is the e=ect on the price and quantity of MP3 players (such as the iPod) if
1. The price of a PC falls or the price of an MP3 download rises? (Draw the
diagrams!)
A fall in the price of a PC decreases the demand for MP3 players because a PC is a
substitute for an MP3 player. The demand curve for MP3 players shifts leftward.
2. More &rms produce MP3 players or electronics workers’ wages rise? (Draw the
diagrams!)
An increase in the number of &rms that produce MP3 players increases the supply
of MP3 players. The supply curve of MP3 players shifts rightward. Demand remains
unchanged. The price of an MP3 player falls and the quantity of MP3 players
/
3. Any two of these events in questions 1 and 2 occur together? (Draw the
diagrams!)
There are six combinations:
(1) If the price of a PC falls and the price of an MP3 download rises, demand
(2) If the price of a PC falls and more &rms produce MP3 players, demand
(3) If the price of PC falls and the wages paid electronic workers rise, demand
(4) If the price of an MP3 download rises and more &rms produce MP3
(5) If the price of an MP3 download falls and the wages paid electronic
(6) If more &rms produce MP3 players and the wages paid electronics workers
42
A n s w e r s t o t h e S t u d y P l a n P r o b l e m s a n d
A p p l i c a t i o n s
1. In April 2014, the money price of a carton of milk was $2.01 and the money
price of gallon of gasoline was $3.63. Calculate the relative price of a gallon
of gasoline in terms of milk.
The relative price of a gallon of gasoline in terms of milk equals ($3.63 per gallon
2. The price of food increased during the past year.
a. Explain why the law of demand applies to food just as it does to other goods
and services.
The law of demand applies to food because there is both a substitution and an
income e=ect that reinforce each other. When the price of food rises, people
b. Explain how the substitution e=ect in6uences food purchases when the price
of food rises and other things remain the same.
When the price of food rises, people substitute away from (some) foods and toward
c. Explain how the income e=ect in6uences food purchases and provide some
examples of the income e=ect.
Food is a normal good so a rise in the price, which decreases people’s real
incomes, decreases the quantity of food demanded. In the United States,
3. Which of the following goods are likely substitutes and which are likely
complements? (You may use an item in more than once.):
coal, oil, natural gas, wheat, corn, pasta, pizza, sausage, skateboard, roller
blades,
video game, laptop, iPad, cellphone, text message, email
Substitutes include: coal and oil; coal and natural gas; oil and natural gas; wheat
and corn; pasta and pizza; pasta and sausage; pizza and sausage (they type of
sausage that cannot be used as a topping on pizza); skateboard and roller blades;
4. As the average income in China continues to increase, explain how the
following would change:
a. The demand for beef
b. The demand for rice
5. In 2013, the price of corn fell and some corn farmers will switch from growing
corn in 2014 to growing soybeans.
a. Does this fact illustrate the law of demand or the law of supply? Explain your
answer.
b. Why would a corn farmer grow soybeans?
Corn and soybeans are substitutes in production and soybeans have become more
6. Dairies make low-fat milk from full-cream milk, and in the process they
produce cream, which is made into ice cream. The following events occur one
at a time:
(i) The wage rate of dairy workers rises.
(ii) The price of cream rises.
(iii) The price of low-fat milk rises.
(iv) With a drought forecasted, dairies raise their expected price of low-fat
milk next year.
(v) New technology lowers the cost of producing ice cream.
Explain the e=ect of each event on the supply of low-fat milk.
(i) Dairy workers are a factor used to produce low-fat milk. The price of a factor of
(ii) Cream and low fat milk are complements in production. The price of a
(iii) A rise in the price of low-fat milk does not change the supply of low-fat milk. It
(v) Ice cream and low-fat milk are complements in production. The lower cost of
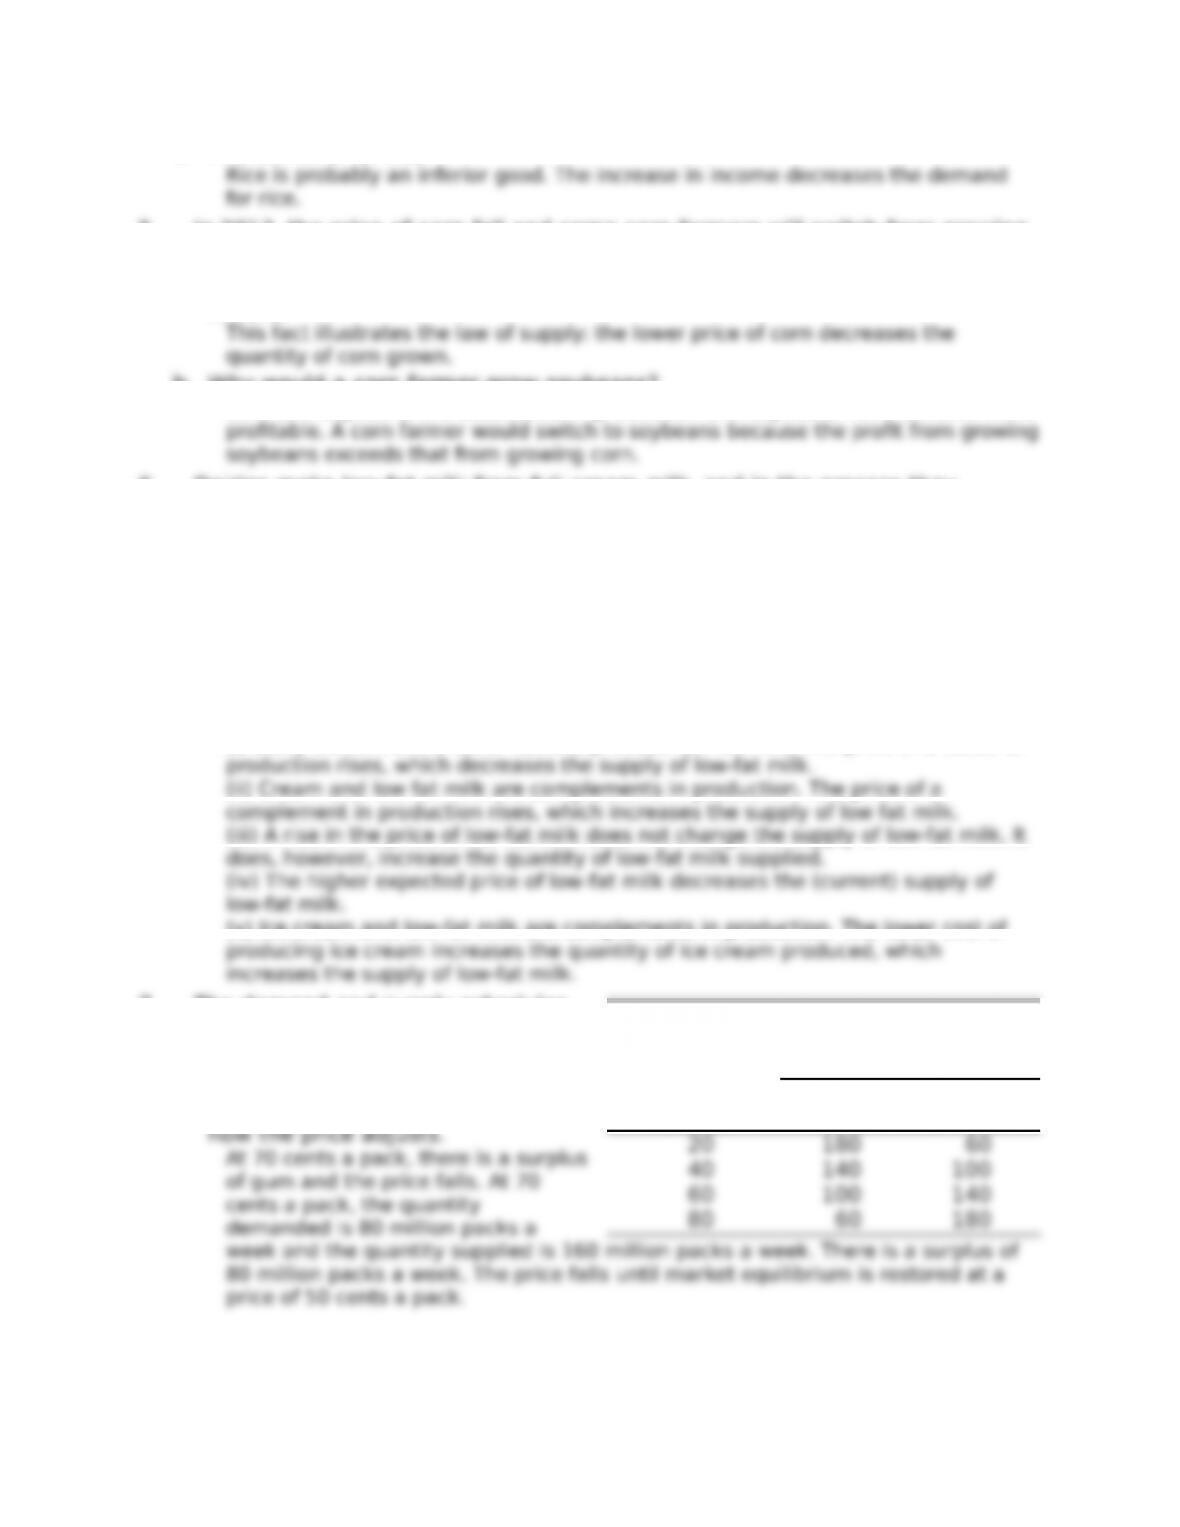
7. The demand and supply schedules
for gum are in the table.
a. Suppose that the price of gum is
70¢ a pack. Describe the situation
in the gum market and explain
how the price adjusts.
Price
Quantity
demand
ed
Quantity
supplied
(cents per
pack)
(millions of packs a
week)
b. Suppose that the price of gum is 30¢ a pack. Describe the situation in the
gum market and explain how the price adjusts.
At 30 cents a pack, there is a shortage of gum and the price rises. At 30 cents a
pack, the quantity demanded is 160 million packs a week and the quantity
8. The following events occur one at a time:
(i) The price of crude oil rises.
(ii) The price of a car rises.
(iii) All speed limits on highways are abolished.
(iv) Robots cut car production costs.
Explain the e=ect of each of these events on the market for gasoline.
(ii) and (iii) and (iv) change the demand for gasoline. The demand for gasoline will
change if the price of a car rises, all speed limits on highways are abolished, or
robot production cuts the cost of producing a car. If the price of a car rises, the
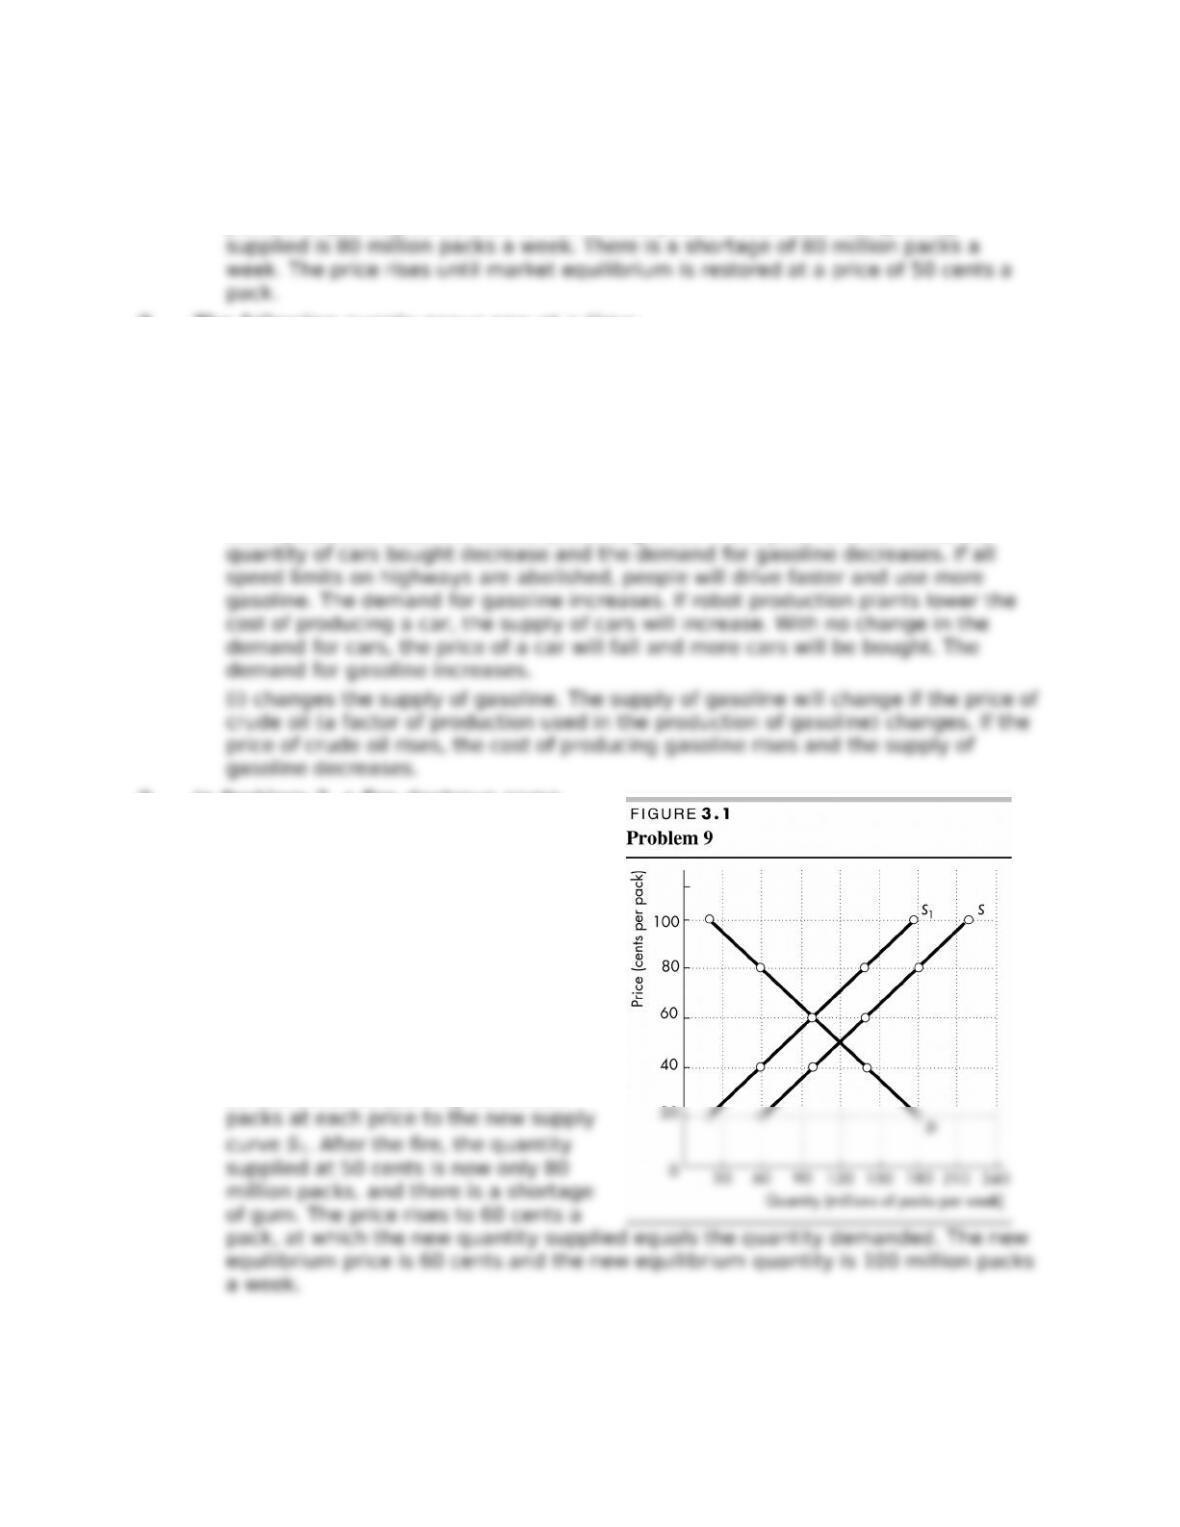
9. In Problem 7, a &re destroys some
factories that produce gum and the
quantity of gum supplied decreases
by 40 million packs a week at each
price.
a. Explain what happens in the market
for gum and draw a graph to
illustrate the changes.
As the number of gum–producing
factories decreases, the supply of gum
decreases. There is a new supply
schedule and, in Figure 3.1, the supply
curves shifts leftward by 40 million
b. If, at the time as the &re the teenage
population increases and the
quantity of gum demanded
increases 40 million packs a week at
each price. What is the new market
equilibrium? Show the changes on
your graph.
The new price is 70 cents a pack, and
the quantity is 120 million packs a
week. The demand for gum increases
and the demand curve shifts rightward
by 40 million packs at each price.
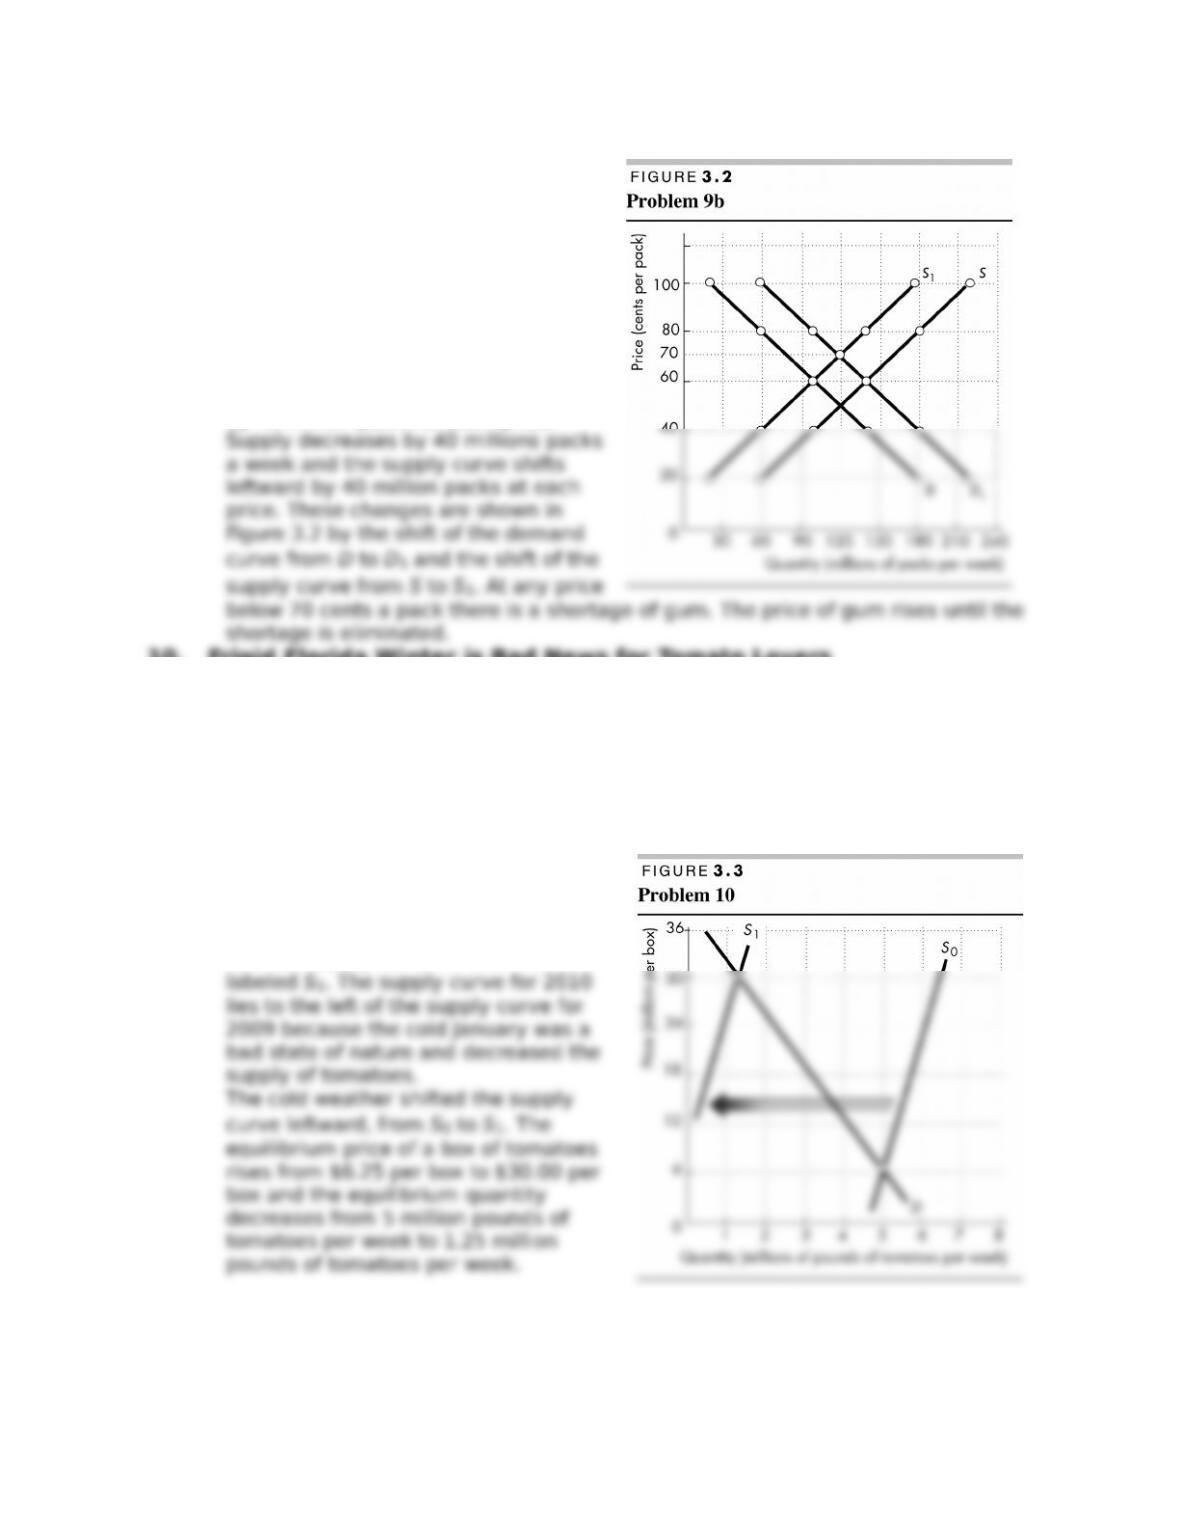
10. Frigid Florida Winter is Bad News for Tomato Lovers
An unusually cold January in Florida destroyed entire &elds of tomatoes.
Florida’s growers are shipping only a quarter of their usual 5 million pounds a
week. The price has risen from $6.50 for a 25-pound box a year ago to $30 now.
Source: USA Today, March 3, 2010
a. Make a graph to illustrate the market for tomatoes before the unusually cold
January and show how the events in the news clip in6uence the market for
tomatoes.
Figure 3.3 shows the tomato market in
January 2009 and January 2010. In both
years the demand curve is labeled D.
The supply curve for 2009 is labeled S0
and the supply curve for 2010 is

b. Why is the news “bad for tomato lovers”?
The news is bad for tomato lovers because the price of tomatoes rises and “tomato