A d d i t i o n a l P r o b l e m s
1. What is the eect on the price of hotdogs and the quantity of hotdogs sold if
a. The price of a hamburger rises?
b. The price of a hotdog bun rises?
c. The supply of hotdog sausages increases?
d. Consumers’ incomes increase if hot dogs are a normal good?
e. The wage rate of a hotdog seller increases?
f. If the wage rate of the hotdog seller rises and at the same time prices of
ketchup, mustard, and relish fall?
2. Suppose that one of the following events occurs:
(i) The price of wool rises.
(ii) The price of sweaters falls.
(iii) A close substitute for wool is invented.
(iv) A new high-speed loom is invented.
Which of the above events increases or decreases (state which)
a. The demand for wool?
b. The supply of wool?
c. The quantity of wool demanded?
d. The quantity of wool supplied?
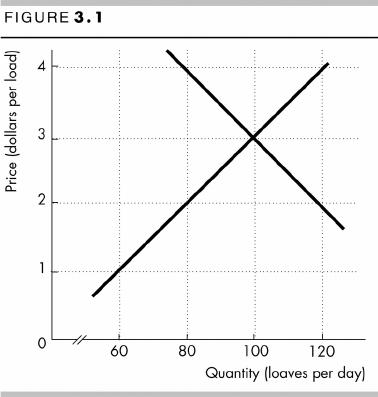
3. Figure 3.1 illustrates the market for bread.
a. Label the curves in the -gure.
b. What are the equilibrium price of bread
and the equilibrium quantity of bread?

4. The demand and supply schedules
for potato chips are in the table.
a. What are the equilibrium price and
equilibrium quantity of potato
chips?
b. If chips were 60 cents a bag,
describe the situation in the
market for potato chips and
explain what would happen to the
price of a bag of chips.
5. In problem 4, suppose a new snack
food comes onto the market and as a
result the demand for potato chips
decreases by 40 million bags per
week.
a. Has there been a shift in or a movement along the supply curve of chips?
b. Has there been a shift in or a movement along the demand curve for chips?
c. What is the new equilibrium price and quantity of chips?
6. In problem 5, suppose that a 4ood destroys several potato farms and as a
result supply decreases by 20 million bags a week at the same time as the
new snack food comes onto the market. What is the new equilibrium price
and quantity of chips?
S o l u t i o n s t o A d d i t i o n a l P r o b l e m s
1. a. The price of a hot dog rises, and the quantity of hot dogs sold increases. Hot dogs
and hamburgers are substitutes. If the price of a hamburger rises, people buy more
hot dogs and fewer hamburgers. The demand for hot dogs increases. The price of a
hot dog rises, and more hot dogs are sold.
b. The price of a hot dog falls, and fewer hot dogs are sold. Hot dog buns and hot dogs
are complements. If the price of a hot dog bun rises, fewer hot dog buns are bought.
The demand for hot dogs decreases. The price of a hot dog falls, and people buy
fewer hot dogs.
c. The price of a hot dog falls and more hot dogs are sold. The increase in the supply of
hot dog sausages lowers the price of hot dog sausages. Hot dog sausages are a
factor used in the production of hot dogs. With the lower priced factor, the supply of
hot dogs increases. The price of a hot dog falls and people buy more hot dogs.
d. The price of a hot dog rises, and the quantity sold increases. An increase in
consumers’ income increases the demand for hot dogs. As a result, the price of a hot
dog rises and the quantity bought increases.
e. The price of a hot dog rises, and the quantity sold decreases. If the wage of the hot
dog seller increases, the cost of producing a hot dog increases and the supply of hot
dogs decreases. The price rises, and people buy fewer hotdogs.
f. The price of a hot dog rises, but the quantity might increase, decrease, or remain the
same. Ketchup, mustard, and relish are complements of hot dogs. If the price of
ketchup, mustard, and relish fall, more ketchup, mustard, and relish are bought and
the demand for hot dogs increases. The price of a hot dog rises, and people buy
more hot dogs. If the wage of the hot dog seller increases, the cost of producing a
hot dog increases and the supply of hot dogs decreases. The price rises, and people
Price
Quantity
demand
ed
Quantity
supplied
(cents per
bag)
(millions of bags a
week)
40 170 90
50 160 100
60 150 110
70 140 120
80 130 130
90 120 140
100 110 150
110 100 160
buy fewer hotdogs. Taking the two events together, the price of a hot dog rises, but
the quantity might increase, decrease, or remain the same.
2. a. (ii) and (iii) Wool is used in the production of sweaters. If the price of a sweater falls
because the supply of sweaters has increased, then the equilibrium quantity of
sweaters increases and the demand for wool increases. If the price of a sweater falls
because the demand for sweaters has decreased, then the equilibrium quantity of
sweaters decreases and the demand for wool decreases. If a close substitute for wool
is invented, some sweater producers will switch from wool to the substitute. When
they do, the demand for wool decreases.
b. (iv) If a new high–speed loom is invented, the cost of making wool will fall and the
supply of wool will increase.
c. (i) and (iv) If the price of wool rises there is a movement up along the demand curve.
The quantity demanded of wool decreases. If a new high-speed loom is invented, the
cost of producing wool will fall. So the supply of wool increases. With no change in
the demand for wool, the price of wool will fall and there is a movement down along
the demand curve for wool. The quantity demanded of wool increases.
d. (i), (ii), and (iii) If the price of wool rises there is a movement up along the supply
curve. The quantity supplied of wool increases. If the price of a sweater falls because
the supply of sweaters has increased, then the equilibrium quantity of sweaters
increases and the demand for wool increases. With no change in the supply of wool,
the price of wool rises and the quantity of wool supplied increases. If the price of a
sweater falls because the demand for sweaters has decreased, then the equilibrium
quantity of sweaters decreases and the demand for wool decreases. With no change
in the supply of wool, the price of wool falls and the quantity of wool supplied
decreases. If some sweater producers switch to using the new close substitute for
wool, the demand for wool will decrease. With no change in the supply of wool, the
price of wool falls and the quantity of wool supplied decreases.
3. a. The demand curve is the curve that slopes down toward to the right. The supply
curve is the curve that slopes up toward to the right.
b. The equilibrium price is $3 a loaf, and the equilibrium quantity is 100 loaves a day.
Market equilibrium is determined at the intersection of the demand curve and supply
curve.
4. a. The equilibrium price is 80 cents a bag, and the equilibrium quantity is 130 million
bags a week. The price of a bag adjusts until the quantity demanded equals the
quantity supplied. At 80 cents a bag, the quantity demanded is 130 million bags a
week and the quantity supplied is 130 million bags a week.
b. At 60 cents a bag, there will be a shortage of potato chips and the price will rise. At
60 cents a bag, the quantity demanded is 150 million bags a week and the quantity
supplied is 110 million bags a week. There is a shortage of 40 million bags a week.
The price will rise until market equilibrium is restored—80 cents a bag.
5. a. There has been a movement along the supply curve. The demand for potato chips
decreases, and the demand curve shifts leftward. Supply does not change, so the
price falls along the supply curve.
b. The demand curve has shifted leftward. As the new snack food comes onto the
market, the demand for potato chips decreases. There is a new demand schedule,
and the demand curve shifts leftward.
c. The equilibrium price is 60 cents, and the equilibrium quantity is 110 million bags a
week. Demand decreases by 40 million bags a week. That is, the quantity demanded
at each price decreases by 40 million bags. The quantity demanded at 80 cents is
now 90 million bags, and there is a surplus of potato chips. The price falls to 60
cents a bag, at which the quantity supplied equals the quantity demanded (110
million bags a week).
6. The new price is 70 cents a bag, and the quantity is 100 million bags a week. The
supply of potato chips decreases, and the supply curve shifts leftward. The quantity
supplied at each price decreases by 20 million bags. The result of the new snack food
entering the market is a price of 60 cents a bag. At this price, there is now a shortage
of potato chips. The price of potato chips will rise until the shortage is eliminated.
A d d i t i o n a l D i s c u s s i o n Q u e s t i o n s
1. John Q: Could a legal market for human organ donations have saved
his dying son? An opinion piece written by Richard Epstein in The Wall Street
Journal (2/21/02) discusses the donation of human organs for transplant
operations. He raises the issue that if a market for human donor organs were
legal, the dilemma of a lack of organs, as raised by Denzel Washington’s
character in the movie “John Q,” might be closer to -ction rather than fact. You
can use this movie and the motive of the main character as an intriguing basis
for getting students to construct and interpret the demand and supply model.
Can we illustrate a market for something as vital as organ donations?
Begin by asking the students to graph a demand and supply model for the
market for human organ donations, making sure that their model re4ects the
real-life characteristics of this unique market: i) the federal government does
not allow individuals or businesses to engage in the buying and selling of
human organs, unless the organs are donated and received for free, ii) a small
number of organs are donated by living volunteers (like kidney donations) or
by the families of the recently deceased (especially after an otherwise healthy
individual suers an accidental death), meaning that the positively sloped
supply curve for human organ donations intercepts the quantity axis at some
positive value, iii) the demand curve for organs must intercept the supply
curve at a positive price.
Are there unintended consequences when market forces are ignored?
The government wants to assure that poor people have the same access to
available organ transplants as rich people, so it imposes a zero-price
restriction on the market. However, this creates a shortage of organs available
for transplant, where the quantity of organs demanded at a zero price far
exceeds the quantity supplied. If the market for organ donations were
unregulated, then the equilibrium price for an organ would surely increase, but
so would the total number of people receiving an organ transplant, and
presumably, the total number of people who would survive to live another day.
Should society institute a policy that maximizes the numbers of lives
saved or manipulates the characteristics of those fewer lives that do
get saved? Conclude this discussion with a great set-up for the eJciency
versus equity issues developed later in chapter -ve. Our command of the
demand and supply model for human organ donations allows us to discover
an important insight into one aspect of health care policy: the government
places a lower priority for maximizing the total number of people saved
regardless of income, and a higher priority on achieving a “proper” income
mix among the smaller number of people that are saved by being one of the
few receiving organ transplants.
2. What are some goods that college students might buy today but will
give up when they enter the workforce after graduation? College
students usually recognize that they will change their consumption patterns
when they are employed after college graduation. Use this to get the students
to appreciate inferior goods. When you were an undergraduate, you probably
complained about having to eat mostly canned soup or beans as a cheap
staple to -ll your hungry stomach on a small budget. You swore that when you
-nally entered the workforce you wouldn’t eat soup or beans again, unless
under extreme duress. Today the single food item most frequently cited by
students as an inferior good is the Raman style noodles—those dry, thin, near
4avorless oriental style noodles that are reconstituted with boiling water. Get
the students to create a list other such inferior goods they will avoid when their
incomes increase. This gets them to carefully consider how income changes
can cause demand curves to shift in an unintuitive manner for an inferior
good.
3. Because computers are cheaper and more abundantly available now
than a decade ago, doesn’t this mean the supply curve for computers
is downward sloping? This is a real world example for illustrating the
confusion between changes in supply and changes in the quantity supplied. (It
is easier to analyze this example if the students assume that consumer
demand for computer software applications has not changed over the last
decade.)
Has anything in the world of computer manufacturing changed over
the last decade? Point out that the observation about falling computer prices
with rising quantities sold assumes that nothing signi-cant has changed in the
computer industry. Emphasize how such statements re4ect how the ceteris
paribus condition of careful economic analysis has been violated. Over the
years, advances in technology have allowed computer makers to: i) oer
greater computer power and versatility for contemporary software
applications at the same opportunity cost of resources (market price) as
before, or ii) to provide the same level of computer power and versatility for
contemporary software applications at lower opportunity costs (market prices)
as before. Either way, this represents a rightward shift in the supply curve for
computers. The students should recognize that the two prices and two
quantities that give the appearance of more computers oered for less are
actually from two separate supply curves.
4. Because the average price of a car has increased substantially over
the last 30 years, and the number of cars owned has risen faster than
the population, doesn’t this mean that the demand curve for cars is
upward sloping? This is a real world example for illustrating the confusion
between changes in demand and changes in the quantity demanded. (It is
easier to analyze this example if the students assume that automobile
production technology has not changed over these last three decades.)
Has anything in the world of consumers changed over the last
decade? Point out that this real world observation of car prices and rising
quantities sold over time assumes that nothing signi-cant has changed in the
consumers’ environment. Emphasize how statements such as these re4ect
how the ceteris paribus condition of careful economic analysis has been
violated. Consumer incomes have increased signi-cantly over the last three
decades, allowing them to: i) consume greater personal transportation
opportunities for more family members while giving up the same amount of
other goods as before, or ii) consume the same level of personal transportation
opportunities while giving up less of all other goods as before. Either way, this
represents a rightward shift in the demand curve for automobiles. The
students should recognize that the two prices and quantities that give the
appearance of more automobiles demanded at higher prices are actually from
two separate demand curves.
If the status of the family automobile has increased in recent
decades, what a+ect would this have on consumer demand? There is
evidence that the proportion of income that typical families spend on
automobiles (versus all other goods) has increased substantially over the last
30 years. This means that the percent increase in automobile purchases has
been higher than the percent increase in family incomes. This makes for a
great lead into the measures of the income elasticity of demand discussed in
Chapter 4.