W H AT I S E C O N O M I C S ?
A n s w e r s t o t h e R e v i e w Q u i z z e s
Page 34
1. How does the production possibilities frontier illustrate scarcity?
The unattainable combinations of production that lie beyond the PPF illustrate the
concept of scarcity. There simply are not enough resources to produce any of these
2. How does the production possibilities frontier illustrate production e(ciency?
The combinations of outputs that lie on the PPF illustrate the concept of production
e(ciency. These points are the maximum production points possible and are
3. How does the production possibilities frontier show that every choice involves
a tradeo,?
Movements along the PPF frontier illustrate that producing more of one good
4. How does the production possibilities frontier illustrate opportunity cost?
The negative slope of the production possibility curve illustrates the concept of
opportunity cost. Moving along the production possibility frontier, producing
5. Why is opportunity cost a ratio?
The slope of the PPF is a ratio that expresses the quantity of lost production of the
good on the y-axis to the increase in the production of the good on the x-axis
6. Why does the PPF bow outward and what does that imply about the
relationship between opportunity cost and the quantity produced?
Some resources are better suited to produce one type of good or service, like pizza.
2THE ECONOMIC
PROBLEM
19
1 9
and DVDs measured on the y-axis. A small increase in pizza output when pizza
production is relatively low requires only a small increase in the use of those
resources still good at making pizza and not good at making DVDs. This yields a
small decrease in DVD production for a large increase in pizza production, creating
Page 37
1. What is marginal cost? How is it measured?
Marginal cost is the opportunity cost of producing one more unit of a good or
service. Along a PPF marginal cost is re*ected in the absolute value of the slope of
2. What is marginal bene.t? How is it measured?
The marginal benet from a good or service is the bene.t received from
3. How does the marginal bene.t from a good change as the quantity produced
of that good increases?
As the more of a good is consumed, the marginal bene.t received from each unit is
smaller than the marginal bene.t received from the unit consumed immediately
before it, and is larger than the marginal bene.t from the unit consumed
4. What is allocative e(ciency and how does it relate to the production
possibilities frontier?
Production eciency occurs when production takes place at a point on the PPF.
This indicates that all available resources are being used for production and
society cannot produce additional units of one good or service without reducing the
5. What conditions must be satis.ed if resources are used e(ciently?
Resources are used e(ciently when more of one good or service cannot be
produced without producing less of some of another good or service that is valued
20
2 0
W H A T I S E C O N O M I C S ?
Page 39
1. What generates economic growth?
The two key factors that generate economic growth are technological change and
capital accumulation. Technological change allows an economy to produce more
2. How does economic growth in*uence the production possibilities frontier?
Economic growth shifts the PPF outward. Persistent outward shifts in the production
possibility frontier—economic growth—are caused by the accumulation of
3. What is the opportunity cost of economic growth?
When a society devotes more of its scarce resources to research and development
of new technologies, or devotes additional resources to produce more capital
4. Explain why Hong Kong has experienced faster economic growth than the
United States.
Hong Kong chose to devote a greater proportion of its available resources to the
production of capital than the United States. This allowed Hong Kong to grow at a
5. Does economic growth overcome scarcity?
Scarcity re*ects the inability to satisfy all our wants. Regardless of the amount of
economic growth, scarcity will remain present because it will never be possible to
Page 43
1. What gives a person a comparative advantage?
A person has a comparative advantage in an activity if that person can perform
the activity at a lower opportunity cost than anyone else, If the person gives up the
2. Distinguish between comparative advantage and absolute advantage.
A person has a comparative advantage in producing a good when he or she has
the lowest opportunity cost of producing it. Comparative advantage is based on
3. Why do people specialize and trade?
People can compare consumption possibilities from producing all goods and
services through self-suciency against specializing in producing only those goods
and services that re*ect their comparative advantage and trading their output
with others who do the same. People can then see that the consumption
21
2 1
4. What are the gains from specialization and trade?
From society’s standpoint, the total output of goods and services available for
consumption is greater with specialization and trade. From an individual’s
5. What is the source of the gains from trade?
As long as people have di,erent opportunity costs of producing goods or services,
Page 45
1. Why are social institutions such as .rms, markets, property rights, and money
necessary?
These social institutions factors necessary for a decentralized economy to
coordinate production. Firms are necessary to allow people to specialize. Without
.rms, specialization would be limited because a person would need to specialize in
the entire production of a good or service. With .rms people are able to specialize
in producing particular bits of a good or service. For a society to enjoy the fruits of
2. What are the main functions of markets?
The main function of a market is to enable buyers and sellers to get information
3. What are the *ows in the market economy that go from .rms to households
and the *ows from households to .rms?
On the real side of the economy, goods and services *ow from .rms to households.
On the monetary side of the economy, payments for factors of production, wages,
22
2 2
A n s w e r s t o t h e S t u d y P l a n P r o b l e m s a n d
A p p l i c a t i o n s
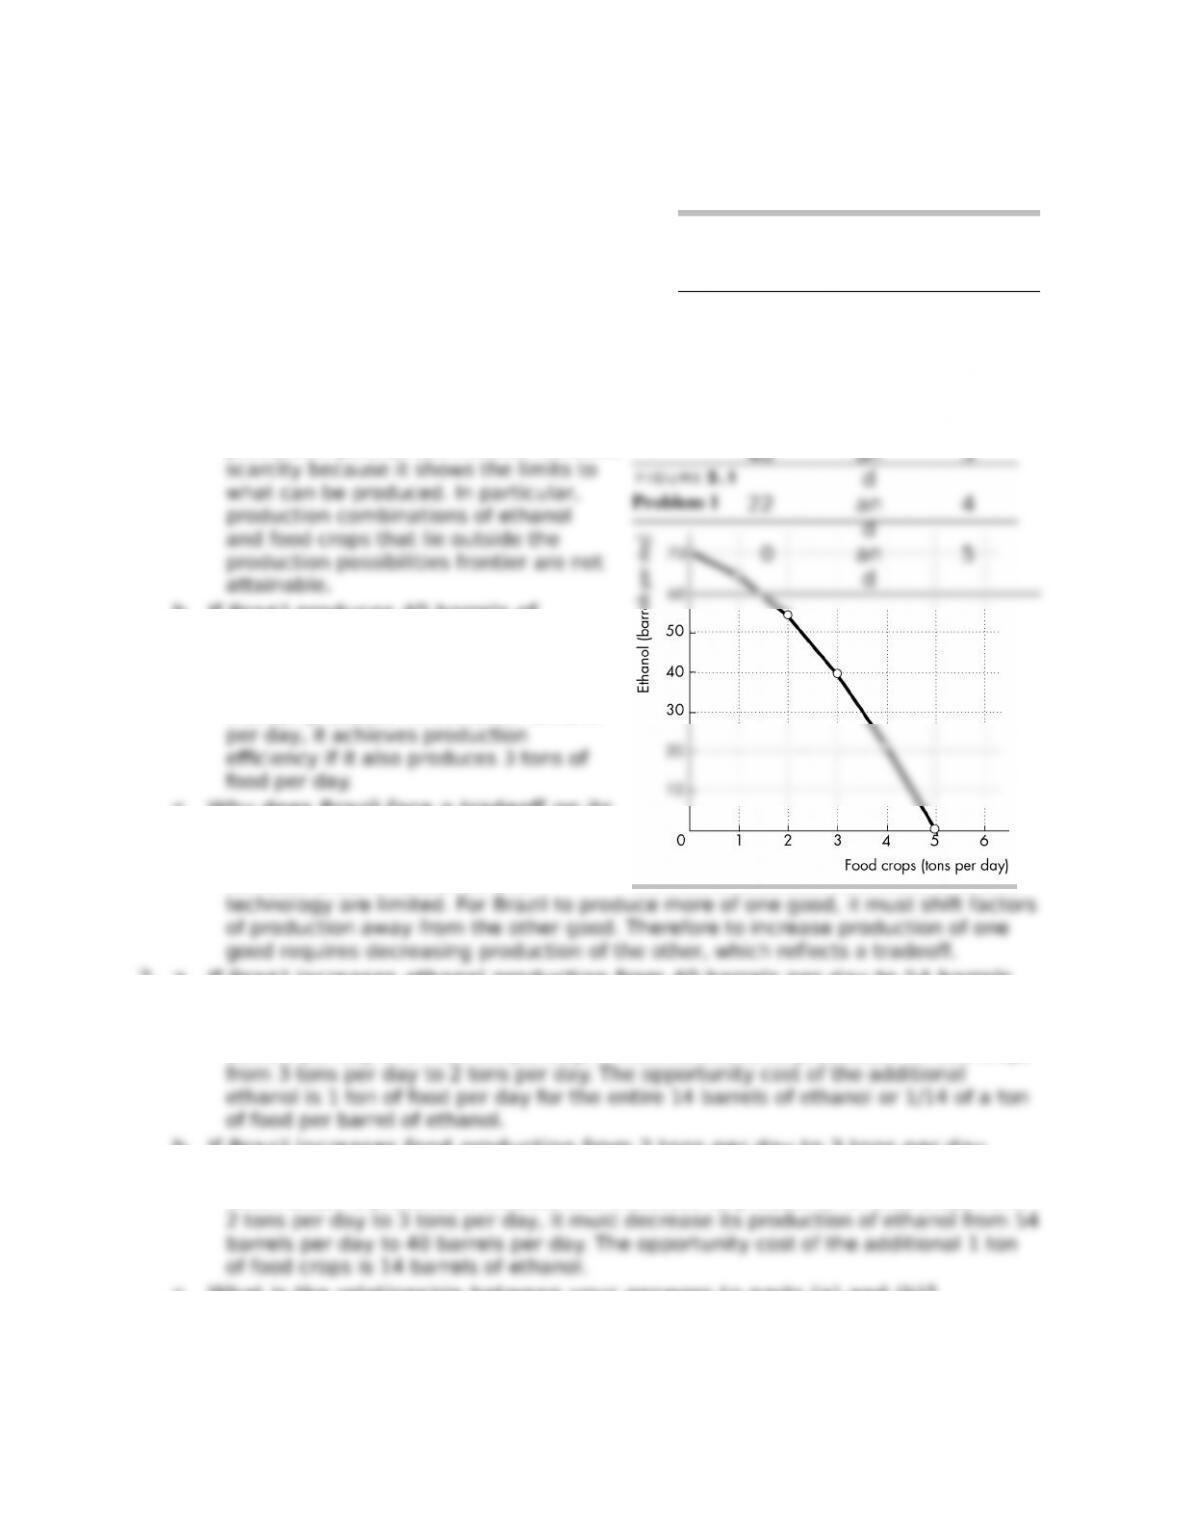
Use the following data to work Problems 1 to 3.
Brazil produces ethanol from sugar, and the
land used to grow sugar can be used to grow
food crops. The table to the right sets out
Brazil’s production possibilities for ethanol and
food crops.
1. a. Draw a graph of Brazil’s PPF and explain
how your graph illustrates scarcity.
Figure 2.1 shows Brazil’s PPF. The
production possibilities frontier indicates
b. If Brazil produces 40 barrels of
ethanol a day, how much food must
it produce to achieve production
e(ciency?
If Brazil produces 40 barrels of ethanol
c. Why does Brazil face a tradeo, on its
PPF?
Brazil faces a tradeo, on its PPF
because Brazil’s resources and
2. a. If Brazil increases ethanol production from 40 barrels per day to 54 barrels
per day, what is the opportunity cost of the additional ethanol?
When Brazil is production e(cient and increases its production of ethanol from 40
barrels per day to 54 barrels per day, it must decrease its production of food crops
b. If Brazil increases food production from 2 tons per day to 3 tons per day,
what is the opportunity cost of the additional food?
When Brazil is production e(cient and increases its production of food crops from
c. What is the relationship between your answers to parts (a) and (b)?
The opportunity costs of an additional barrel of ethanol and the opportunity cost of
an additional ton of food crop are reciprocals of each other. That is, the opportunity
Ethanol
(barrels per
day)
Food crops
(tons per
day)
70 an
d
0
64 an
d
1
54 an
d
2
40 an
3
3. Does Brazil face an increasing opportunity cost of ethanol? What feature of
Brazil’s PPF illustrates increasing opportunity cost?
Brazil faces an increasing opportunity cost of ethanol production. For instance,
when increasing ethanol production from 0 barrels per day to 22 barrels the
Use the above table (for Problems 1 to 3) to work Problems 4 and 5.
4. De.ne marginal cost and calculate Brazil’s marginal cost of producing a ton
of food when the quantity produced is 2.5 tons per day.
The marginal cost of a good is the opportunity cost of producing one more unit of
the good. When the quantity of food produced is 2.5 tons, the marginal cost of a
5. De.ne marginal bene.t. Explain how it is measured and why the data in the
table does not enable you to calculate Brazil’s marginal bene.t from food.
The marginal bene.t of a good is the bene.t received from consuming one more
unit of the good. The marginal bene.t of a good or service is measured by the
6. Distinguish between production eciency and allocative eciency. Explain why
many production possibilities achieve production e(ciency but only one
achieves allocative e(ciency.
Production e(ciency occurs when goods and services are produced at the lowest
cost. This de.nition means that production e(ciency occurs at any point on the
PPF. Therefore all of the production points on the PPF are production e(cient.
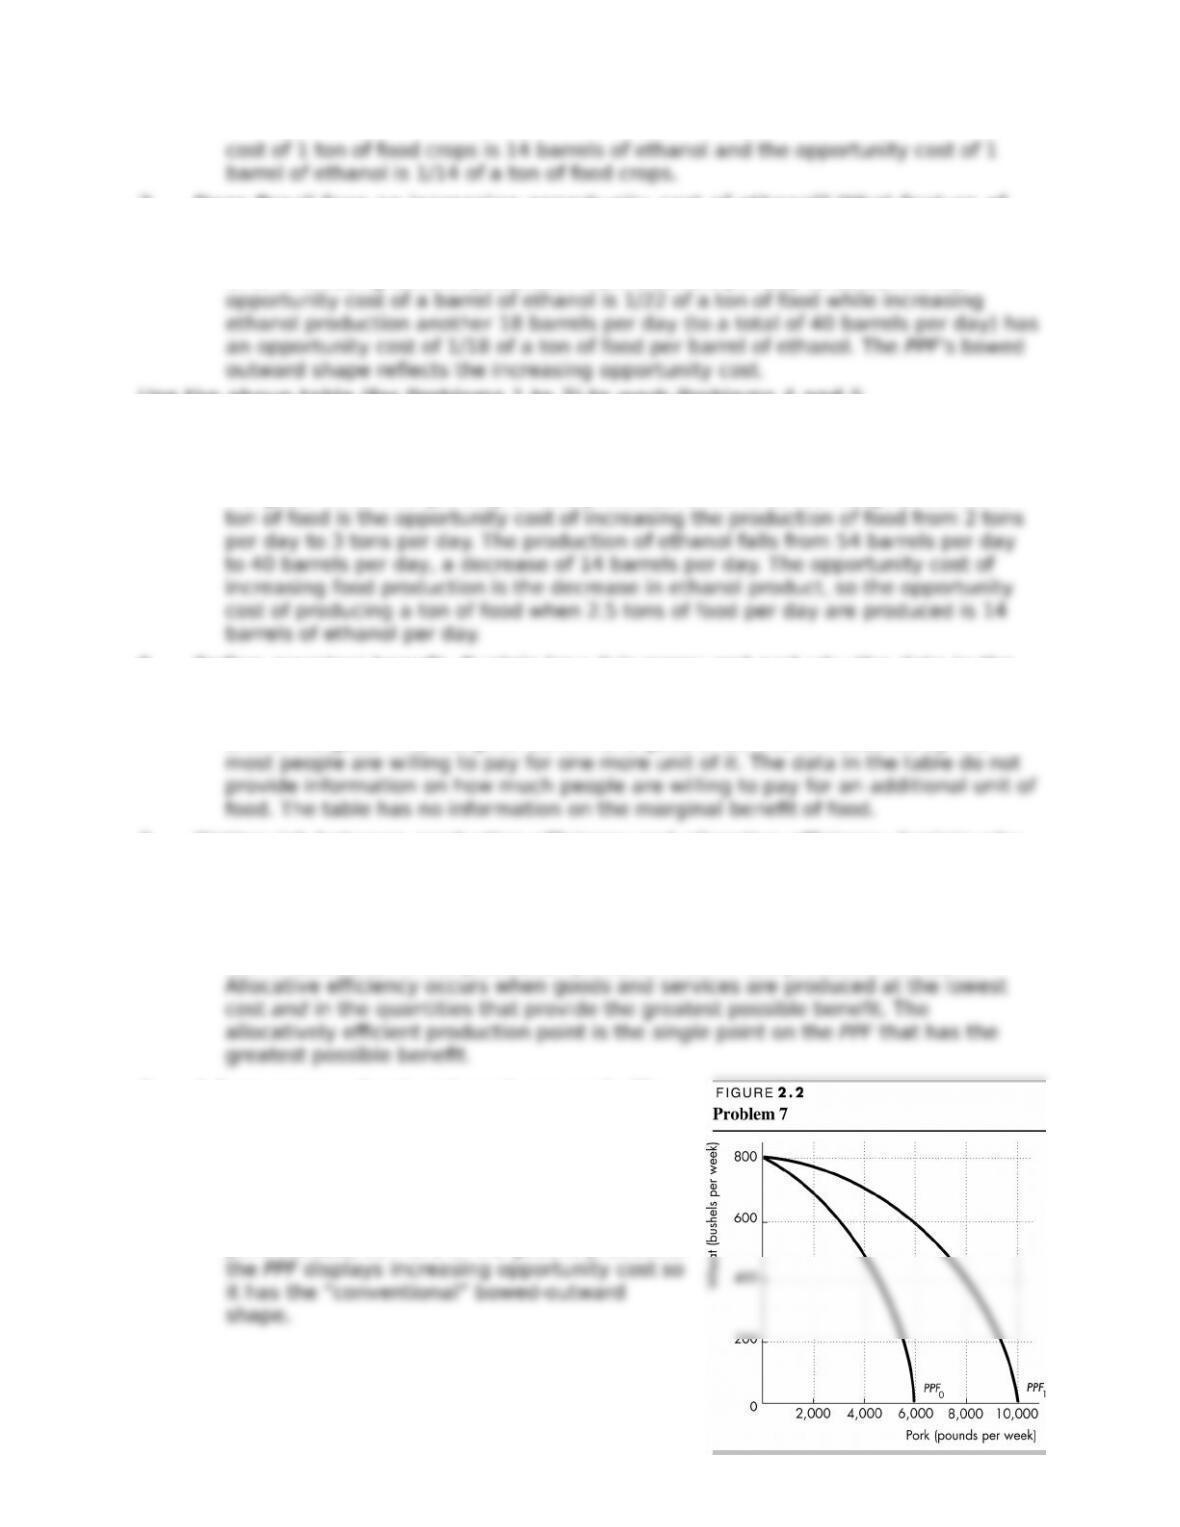
7. A farm grows wheat and produces pork. The
marginal cost of producing each of these
products increases as more of it is produced.
a. Make a graph that illustrates the farm’s PPF.
The PPF is illustrated in Figure 2.2 as PPF0.
Because the marginal cost of both wheat and
pork increase as more of the good is produced,
b. The farm adopts a new technology that allows it to use fewer resources to
fatten pigs. On your graph sketch the impact of the new technology on the
farm’s PPF.
c. With the farm using the new technology described in part (b), has the
opportunity cost of producing a ton of wheat increased, decreased, or
remained the same? Explain and illustrate your answer.
The opportunity cost of producing wheat has increased. The opportunity cost of a
bushel of wheat is equal to the magnitude of 1/(slope of the PPF). As illustrated in
d. Is the farm more e(cient with the new technology than it was with the old
one? Why?
The farm is able to produce more with the new technology than with the old, but it
is not necessarily more e(cient. If the farm was producing on its PPF before the
8. In one hour, Sue can produce 40 caps or 4 jackets and Tessa can produce 80
caps or 4 jackets.
a. Calculate Sue’s opportunity cost of producing a cap.
b. Calculate Tessa’s opportunity cost of producing a cap.
c. Who has a comparative advantage in producing caps?
d. If Sue and Tessa specialize in producing the good in which they have a
comparative advantage, and they trade 1 jacket for 15 caps, who gains from
the specialization and trade?
Tessa specializes in caps and Sue specializes in jackets. Both Sue and Tessa gain
from trade. Sue gains because she can obtain caps from Tessa at a cost of (1
9. Suppose that Tessa buys a new machine for making jackets that enables her
to make 20 jackets an hour. (She can still make only 80 caps per hour.)
a. Who now has a comparative advantage in producing jackets?
Sue forgoes 40 caps to produce 4 jackets, so Sue’s opportunity cost of producing
one jacket is (40 caps)/(4 jackets) or 10 caps per jacket. Tessa forgoes 80 caps to
b. Can Sue and Tessa still gain from trade?
Tessa and Sue can still gain from trade because Tessa (now) has a comparative
c. Would Sue and Tessa still be willing to trade 1 jacket for 15 caps? Explain
your answer.
Sue and Tessa will not be willing to trade 1 jacket for 15 caps. In particular, Sue,
whose comparative advantage lies in producing caps, can produce 1 jacket at an
10. For 50 years, Cuba has had a centrally planned economy in which the
government makes the big decisions on how resources will be allocated.
a. Why would you expect Cuba’s production possibilities (per person) to be
smaller than those of the United States?
Cuba’s economy is almost surely less e(cient than the U.S. economy. The Cuban
central planners do not know people’s production possibilities or their preferences.
The plans that are created wind up wasting resources and/or producing goods and
b. What are the social institutions that Cuba might lack that help the United
States to achieve allocative e(ciency?
Of the four social institutions, .rms, money, markets, and property rights, Cuba’s
economy has .rms and money. Markets, however, are less free of government
intervention in Cuba. But the major di,erence is the property rights in the Cuban
economy. In Cuba the government owns most of the .rms; that is, the government