
V. Economic Coordination
Firms and Markets
A rm is an economic unit that hires factors of production and organizes those
factors to produce and sell goods and services.
A market is any arrangement that enables buyers and sellers to get information
and to do business with each other.
Property Rights and Money
The social arrangements that govern the ownership, use, and disposal of resources,
goods, and services are called property rights. Types of property include real
(buildings and land), nancial (stocks and bonds) and intellectual (ideas and
technology).
Money is anything generally accepted as a means of payment. Money’s main
purpose is to facilitate trade.
Students are usually xated on money, but ask them to dig deeper. It is what we can do or
buy with money that brings us happiness not the actual bills themselves.
Circular Flows Through Markets
Firms and households interact in markets and it is this interaction that determines
what will be produced, how it will be produced, and who will get it.
Coordinating Decisions
Prices within markets coordinate rms’ and households’ decisions.
Everyone knows what prices are. But not everyone knows why prices rise or fall. The point is
that no one needs to know why a price has changed when making the choice to buy or sell.
All that someone needs to know is what the price is relative to what he or she believes the
item to be worth.
Enforced property rights ensure that exchange is voluntary (not theft). Property
rights and prices help insure that production takes place e*ciently without waste
because the owner of a rm has the property right to any prot the rm can earn.
Willingness to pay a,ects production and production a,ects willingness to pay. It would
appear that we have the classic “which came rst, the chicken or the egg” conundrum.
However, in the next chapter, we will discuss the most powerful model in economics,
Demand and Supply, which allows us to think clearly about the behavior of markets.
© 2016 Pearson Education, Inc.
1 0 C H A P T E R 2
A d d i t i o n a l P r o b l e m s
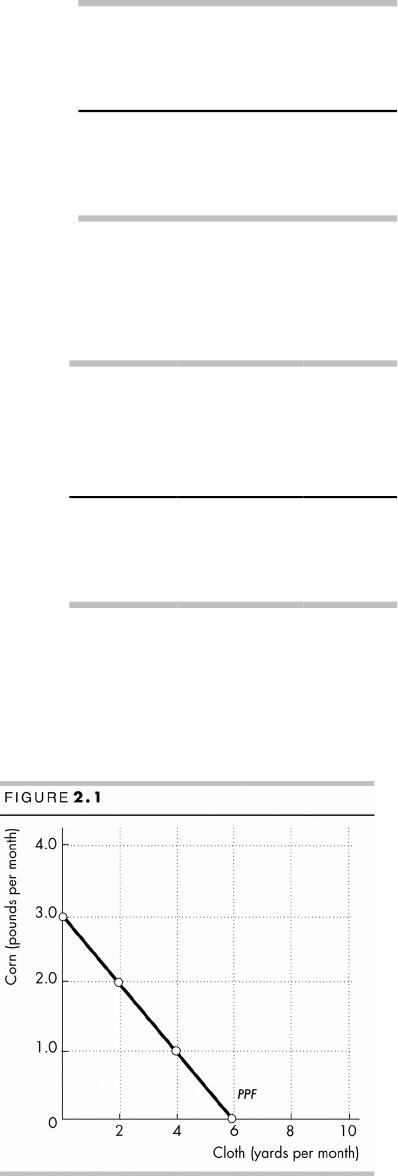
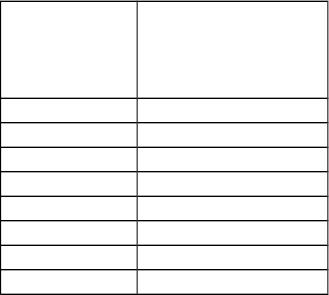
1. Jane’s Island’s production possibilities are given
in the table to the right.
a. Draw a graph of the production possibility
possibilities frontier on Jane’s Island.
b. What are Jane’s opportunity costs of producing
corn and cloth at each output in the table?
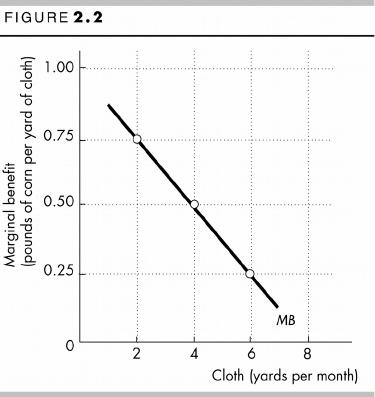
2. In problem 1, Jane is willing to give up 0.75
pounds of corn per yard of cloth if she has 2
yards of cloth; 0.50 pounds of corn per yard of
cloth if she has 4 yards of cloth; and 0.25 pound of corn per yard of cloth if
she has 6 yards of cloth.
a. Draw a graph of Jane’s marginal benet from corn.
b. What is Jane’s e*cient quantity of corn?
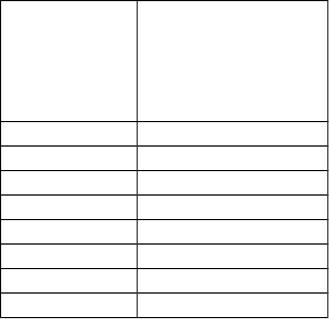
3. Joe’s production possibilities are given in the
table to the right. What are Joe’s opportunity
costs of producing corn and cloth at each
output in the table?
4. In problems 1 and 2, Jane’s Island produces
and consumes 2 pounds of corn and 2 yards of
cloth. Joe’s Island produces and consumes 2
pounds of corn and 2 yard of cloth. Now the
islands begin to trade.
a. What good does Jane sell to Joe and what
good does Jane buy from Joe?
b. If Jane and Joe divide the total output of corn and cloth equally, what are the
gains from trade?
S o l u t i o n s t o A d d i t i o n a l P r o b l e m s
1. a. Jane’s Island’s PPF is a straight line. To
make a graph of Jane’s Island’s PPF
measure the quantity of one good on the
x-axis and the quantity of the other good on
the y-axis. Plot the quantities in each row of
the table. Figure 2.1 illustrates Jane’s
Island’s PPF.
b. The opportunity cost of 1 pound of corn is 2
yards of cloth. The opportunity cost of the
rst pound of corn is 2 yards of cloth. To nd
the opportunity cost of the rst pound of
corn, increase the quantity of corn from 0
pounds to 1 pound. In doing so, Jane’s
Island’s production of cloth decreases from
6 yards to 4 yards. The opportunity cost of
the rst pound of corn is 2 yards of cloth.
Similarly, the opportunity costs of
producing the second pound and the third pound of corn are 2 yards of cloth.
© 2016 Pearson Education, Inc.
Corn
(pounds
per
month)
Cloth
(yards
per
month)
3.0 and 0
2.0 and 2
1.0 and 4
0 and 6
Corn
(pound
s per
month)
Cloth
(yards
per
month
)
6 and 0
4 and 1.0
2 and 2.0
0 and 3.0
1 1 C H A P T E R 2
The opportunity cost of 1 yard of cloth is 0.5 pound of corn. The opportunity cost of
producing the rst 2 yards of cloth is 1 pound of corn. To calculate this opportunity
cost, increase the quantity of cloth from 0 yards to 2 yards. Jane’s Island’s
production of corn decreases from 3 pounds to 2 pounds. Similarly, the opportunity
cost of producing the second 2 yards and the third 2 yards of cloth are 1 pound of
corn.
2. a. The marginal benet curve slopes
downward. To draw the marginal benet
curve from cloth, plot the quantity of cloth
on the x-axis and the willingness to pay for
cloth (that is, the number of pounds of corn
that Jane is willing to give up to get a yard
of cloth) on the y-axis, as illustrated in
Figure 2.2.
b. The e*cient quantity is 4 yards a month.
The e*cient quantity to produce is such
that the marginal benet from the last yard
equals the opportunity cost of producing it.
The opportunity cost of a yard of cloth is 0.5
pound of corn. The marginal benet of the
fourth yard of cloth is 0.5 pound of corn.
And the marginal cost of the fourth yard of
cloth is 0.5 pound of corn.
3. Joe’s Island’s opportunity cost of a pound of corn is 1/2 yard of cloth, and its
opportunity cost of a yard of cloth is 2 pounds of corn. When Joe’s Island increases the
corn it produces by 2 pounds a month, it produces 1 yard of cloth less. The opportunity
cost of 1 pound of corn is 1/2 yard of cloth. Similarly, when Joe’s Island increases the
cloth it produces by 1 yard a month, it produces 2 pounds of corn less. The opportunity
cost of 1 yard of cloth is 2 pound of corn.
4. a. Jane’s Island sells cloth and buys corn. Jane’s Island sells the good in which it has a
comparative advantage and buys the other good from Joe’s Island. Jane’s Island’s
opportunity cost of 1 yard of cloth is 1/2 pound of corn, while Joe’s Island’s
opportunity cost of 1 yard of cloth is 2 pounds of corn. Jane’s Island’s opportunity
cost of cloth is less than Joe’s Island’s, so Jane’s Island has a comparative advantage
in producing cloth.
Jane’s Island’s opportunity cost of 1 pound of corn is 2 yards of cloth, while Joe’s
Island’s opportunity cost of 1 pound of corn is 1/2 yard of cloth. Joe’s Island’s
opportunity cost of corn is less than Jane’s Island’s, so Joe’s Island has a comparative
advantage in producing corn.
b. With specialization and trade, together they can produce 6 pounds of corn and 6
yards of cloth and each will get 3 pounds of corn and 3 yards of cloth—an additional
1 pound of corn each and an additional 1 yard of cloth each. Hence the total gains
from trade are 2 yards of cloth and 2 pounds of corn.
A d d i t i o n a l D i s c u s s i o n Q u e s t i o n s
1. Use the PPF model to analyze an “Arms Race” between nations. You
might like to get the students to realize how useful even a simple economic
© 2016 Pearson Education, Inc.
T H E E C O N O M I C P R O B L E M 1 2
model (such as the PPF model) is for helping us understand and interpret
important political events in history. Draw a PPF for military goods and civilian
goods production (or, simply, the traditional example of “guns versus butter”).
Then draw another PPF for a country that is about twice the size of the rst,
but with the same degree of concavity as the PPF for the rst country. Now
assume that each country considers the other as a mortal “enemy,” and that
they engage in a costly “arms race.” Each country picks a point on the PPF
that produces an equal level of military output (in absolute terms).
What would happen if the larger country decided to increase military
production? Emphasize that while the distance on the military output axis at
the point of production is equal for both countries, the resulting distance on
the civilian output axis is (by denition) a smaller quantity for the smaller
country. The large country can create signicant economic and political
pressures on the government of the small country by forcing the small country
to match the increase in military production. The PPF reveals how much more
additional civilian output is forgone by the citizens of the small economy
relative to the citizens of the larger economy. Emphasize also that the
opportunity cost of civilian goods is higher for the smaller country.
What were the economic repercussions of the Cold War? History and
political science majors quickly perceive that these two PPF models reHect the
Cold War relationship between the United States and the U.S.S.R. during the
early 1980s. The Reagan administration increased U.S. military expenditures
during the early 1980s to a post–Viet Nam War peak of 6.6 percent of GDP (as
compared to about 3.5 percent of GDP in the late 1990s). Many experts agree
that this strategy contributed to the many political and economic pressures
that ultimately lead to the dissolution of the U.S.S.R.
What are the implications for the next 50 years? China is currently the
world’s second largest economy. It could become the biggest by mid–century.
How does this development inHuence the strategic balance and the position of
the United States?
12. Using the PPF model to analyze global environmental agreements
between nations. This application of the PPF is a more “green” perspective
that uses the same logic as the “Arms Race” on a timely international policy
issue. Compare a rich economy PPF to a poor economy PPF, each with the
same degree of concavity. (Production levels are now measured as output per
person.) The goods are now “cleaner air” and “other goods and services.”
What if the citizens of each country were required to make equal
reductions in per-person greenhouse gas emissions? Show an equal
quantity increase in per person output on the clean air axis for both countries’
PPF curves. Show how the opportunity cost of requiring additional pollution
reduction (cleaner air) of equal amounts per person is much greater for the
citizens of a poorer country than for the citizens of the richer country. This fact
has been used to persuade developed countries (like the United States) to
accept larger pollution reduction targets than developing countries (like China,
India, and African nations).
3. Why do some of the brightest
students not get a 4.0 GPA? The answer
—because it doesn’t achieve allocative
e*ciency—can now be approached. The
rst conceptual step is to derive the
marginal cost curve from the PPF. The table
provides eight points on the MC curve. Tell
© 2016 Pearson Education, Inc.
Recreatio
n
(hours per
day)
Marginal cost
(GPA points per
hour)
0.5 0.1
1.5 0.2
2.5 0.3
3.5 0.4
4.5 0.5
5.5 0.6
6.5 0.7
7.5 0.8
1 3 C H A P T E R 2
the students that this table is from a PPF between hours spent at recreation
and GPA. Use this opportunity to explain why we plot marginal values at the
midpoints of changes because the marginal cost at the midpoint approximately
equals the average of the opportunity costs across the interval.
The students must now think about preferences for recreation and study. You’ll
be surprised how many students want to derive preferences from the PPF!
Explain that the PPF provides the constraint—what is feasible—and
preferences provide the objective—what is desirable in the opinion of the
chooser.
Each additional hour of recreation likely
yields a smaller marginal benet to the
student. Translate this to the proposition
that the student’s willingness to give up
GPA points for additional hours of
recreation decreases and provide a table
similar to that in Figure 2.3 that captures
this observation. The table has a preference
schedule. Stress once again that this table
did not come from the PPF.
To determine the e*cient amount of
recreation and hence study time, the
student must ask “Do I study a little bit
longer?” That is the question. Walk the student through the thought
experiment:
1. If I study for 8 hours a day I get a 4.0, but I am willing to pay much more
than I will pay if a take a bit of time o, studying and have some fun. So I
will be better o, if study less and take more recreation time.
2. If I don’t study at all I get a 0.4, and I am paying much more in lost GPA
than I am willing to pay for the last bit of fun. So I will be better o, if I study
more and take less recreation time.
3. The only allocation at which I can’t become better o, by studying a little bit
more or a little bit less is where I am just willing to pay what the last bit of
recreation costs—where marginal cost equals marginal benet.
In this example, the student studies for 4.5 hours and takes 3.5 hours a week
of recreation time.
Explain that there is nothing strange or wrong with the fact that the student
gets no net benet from the last seconds-worth of recreation time. He or she is
just willing to pay what it costs him or her.
4. Gains from Trade The gain from trade is a real eye-opener for students. Their
rst reaction is one of skepticism. Convincing students of the power of trade to
raise living standards and the costs of trade restriction is one of the most
productive things we will ever do. Here are some questions to drive home the
idea of comparative advantage:
Why didn’t Billy Sunday do his own typing? Billy Sunday, an evangelist in
the 1930s, was reputed to be the world’s fastest typist. Nonetheless, he
employed a secretary who was a slower typist than he. Why? Because in one
hour of preaching, Billy could raise several times the revenue that he could
raise by typing for an hour. So Billy plays to his comparative advantage.
Why doesn’t Martha Stewart bake her own bread? Martha Stewart is
probably a better cook than most people, but she is an even better writer and
© 2016 Pearson Education, Inc.
Recreatio
n
(hours per
day)
Willingness
to pay
(GPA points per
hour)
0.5 0.7
1.5 0.6
2.5 0.5
3.5 0.4
4.5 0.3
5.5 0.2
6.5 0.1
7.5 0
T H E E C O N O M I C P R O B L E M 1 4
TV performer on the subject of food. So Martha plays to her comparative
advantage and writes about baking bread but buys her bread.
Why doesn’t Vinnie Jones play soccer? Vinnie Jones was one of the world’s
best soccer players. But he stopped playing soccer and started making movies
some years ago. Why? Because, as he once said, “You go to the bank more
often when you’re in movies.” Vinnie’s comparative advantage turned out to
be in acting.
© 2016 Pearson Education, Inc.
1 5 C H A P T E R 2