Answers to Additional Problems and Applications
Use the table to work Problems 9 and 10. The
table shows the distribution of market income
in the United States in 2007.
9. a. What is the denition of market
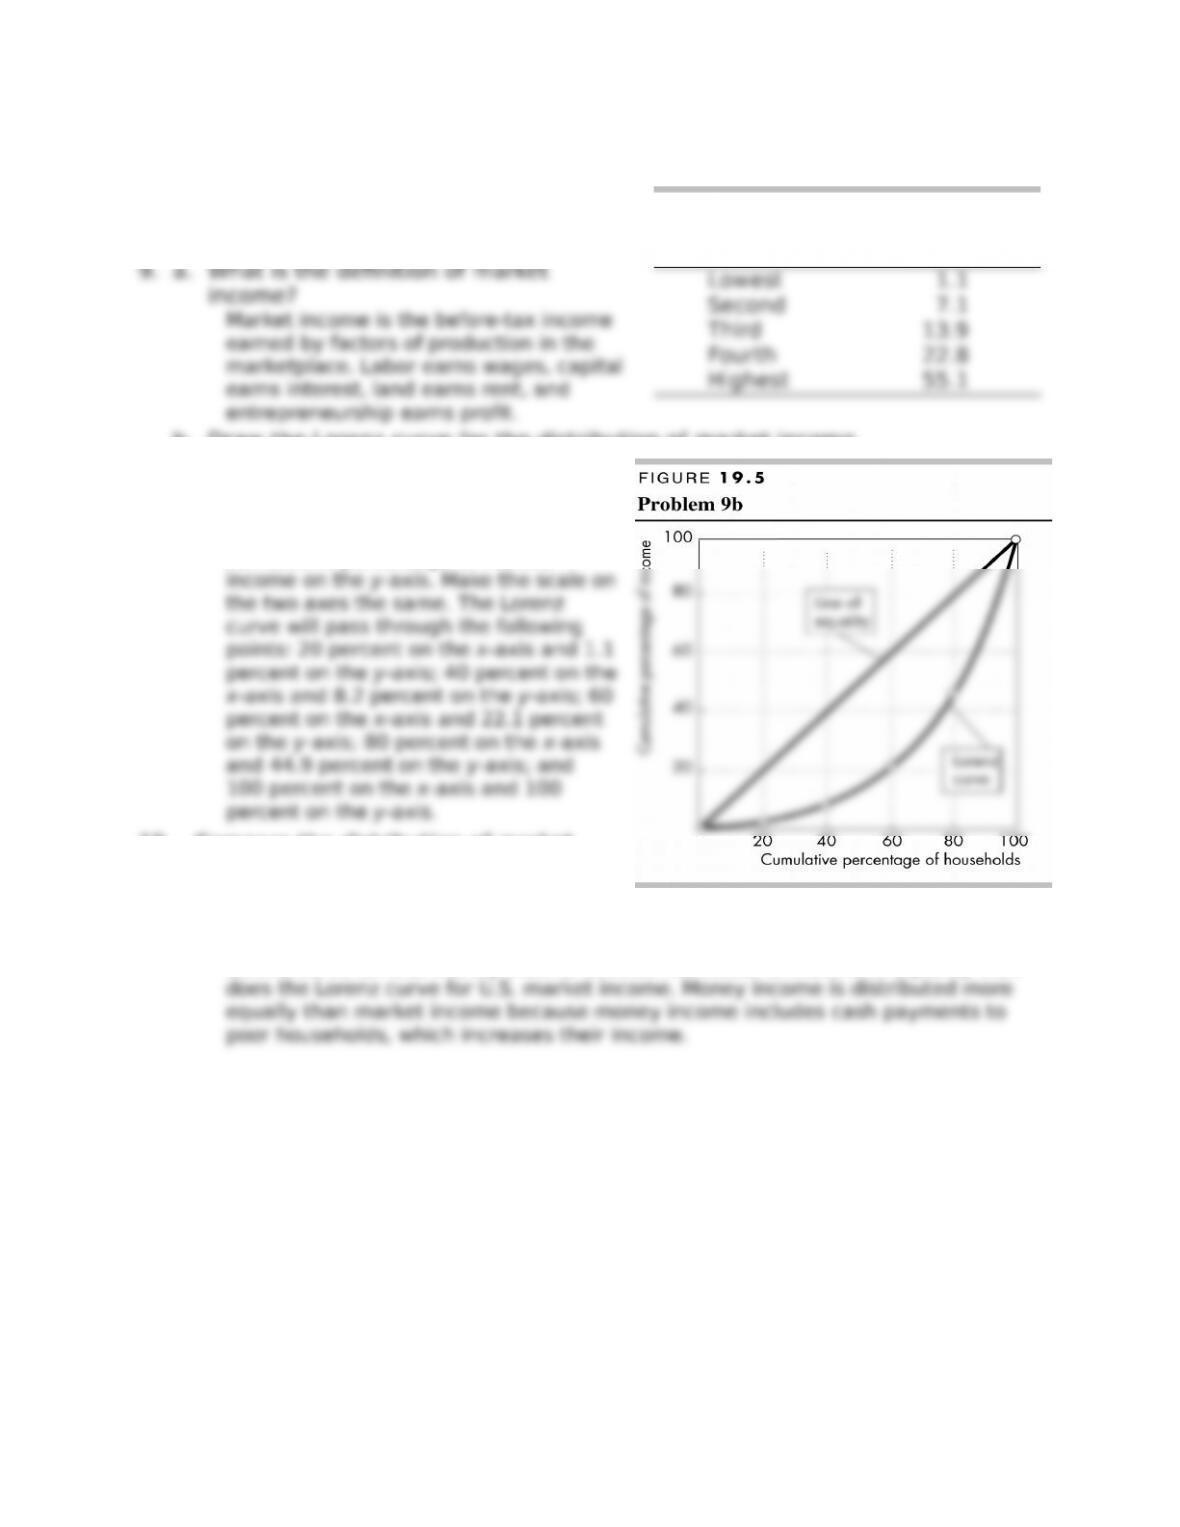
b. Draw the Lorenz curve for the distribution of market income.
Figure 19.5 shows the distribution of
market income. To draw this Lorenz
curve, plot the cumulative percentage
of households on the x-axis and the
cumulative percentage of market
10. Compare the distribution of market
income with the distribution of money
income shown in Fig. 19.3 on p. 445.
Which distribution is more unequal and why?
U.S. money income is distributed more equally than market income in 2012. The
Lorenz curve for U.S. money income in 2012 lies closer to the line of equality than
Households
(quintile)
Market income
(percentage of
total)
Use the table to work Problems 11 to 13. The table shows shares of income in
Australia.
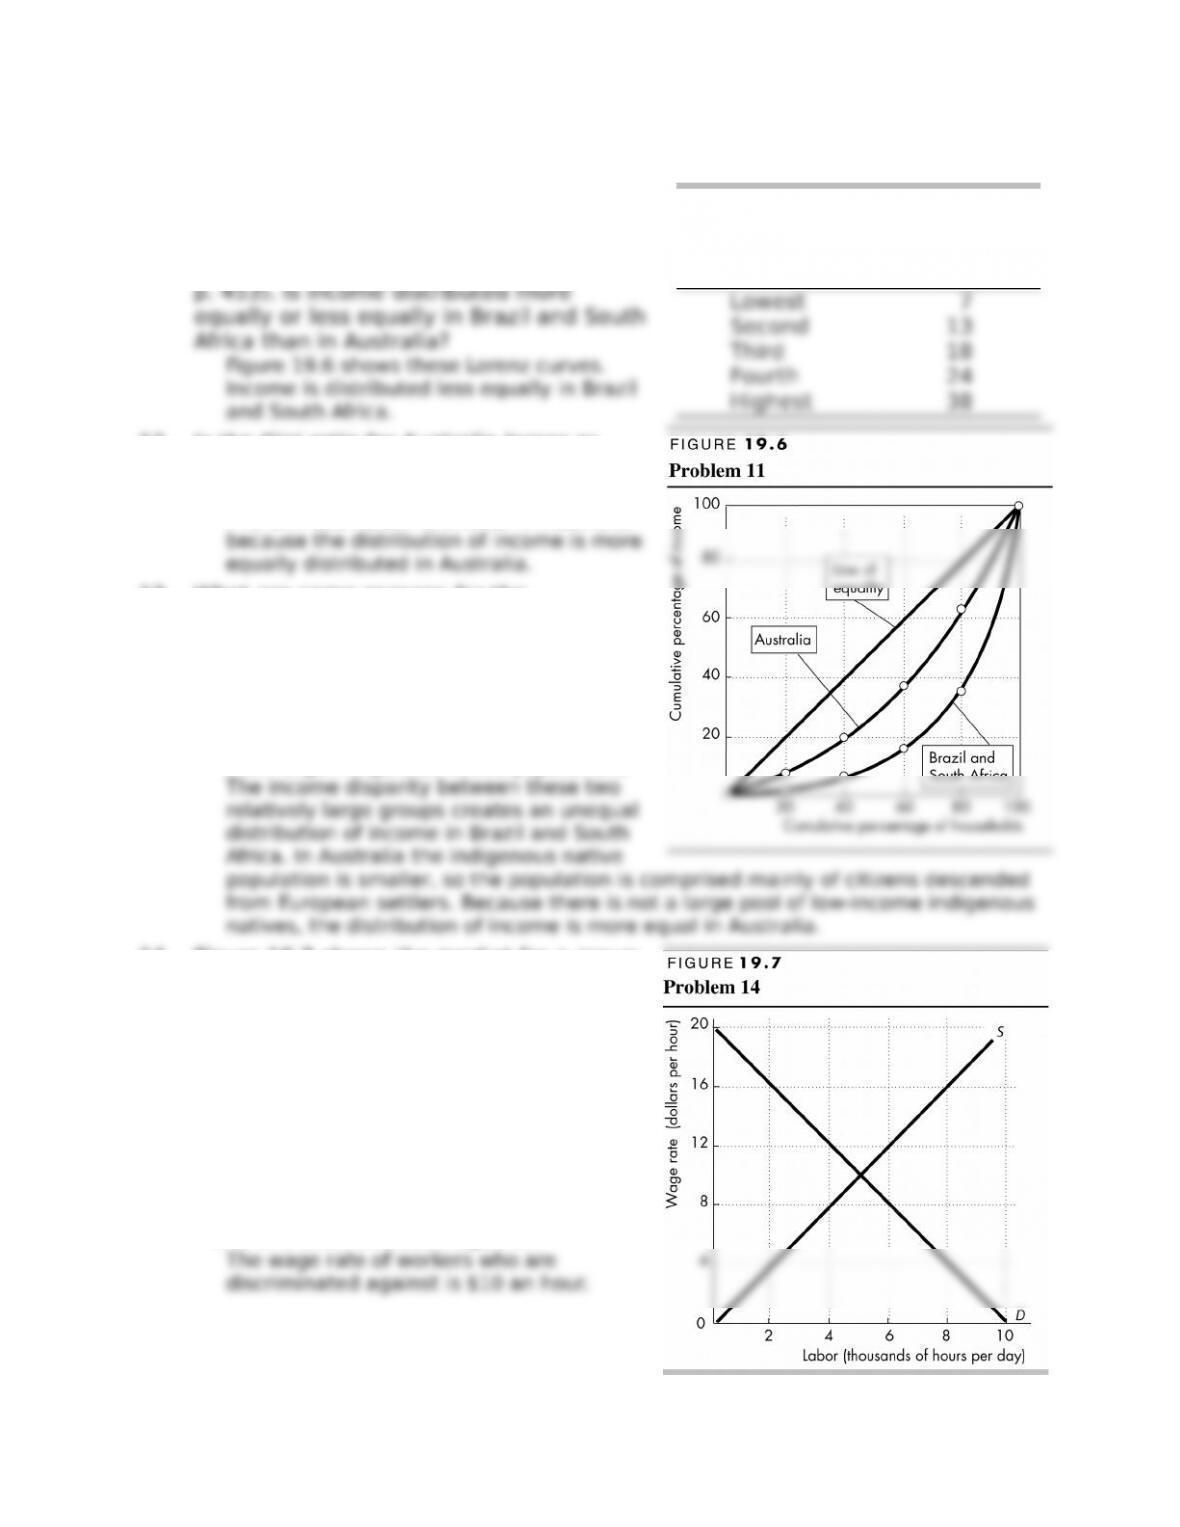
11. Draw the Lorenz curve for the income
distribution in Australia and in Brazil and
South Africa (use the data in Fig. 19.6 on
p. 453). Is income distributed more
12. Is the Gini ratio for Australia larger or
smaller than that for Brazil and South
Africa? Explain your answer.
The Gini coe>cient is smaller in Australia
13. What are some reasons for the
di?erences in the distribution of income
in Australia and in Brazil and South
Africa?
In both Brazil and South Africa there are
wealthy citizens descended from European
settlers and poorer citizens descended
from large indigenous native populations.
14. Figure 19.7 shows the market for a group
of workers who are discriminated
against. Suppose that other workers in
the same industry are not discriminated
against and their value of marginal
product is perceived to be twice that of
the workers who are discriminated
against. Suppose also that the supply of
these other workers is 2,000 hours per
day less at each wage rate.
a. What is the wage rate of the workers
who are discriminated against?
Households
(quintile)
Market
income
(percent of
total)
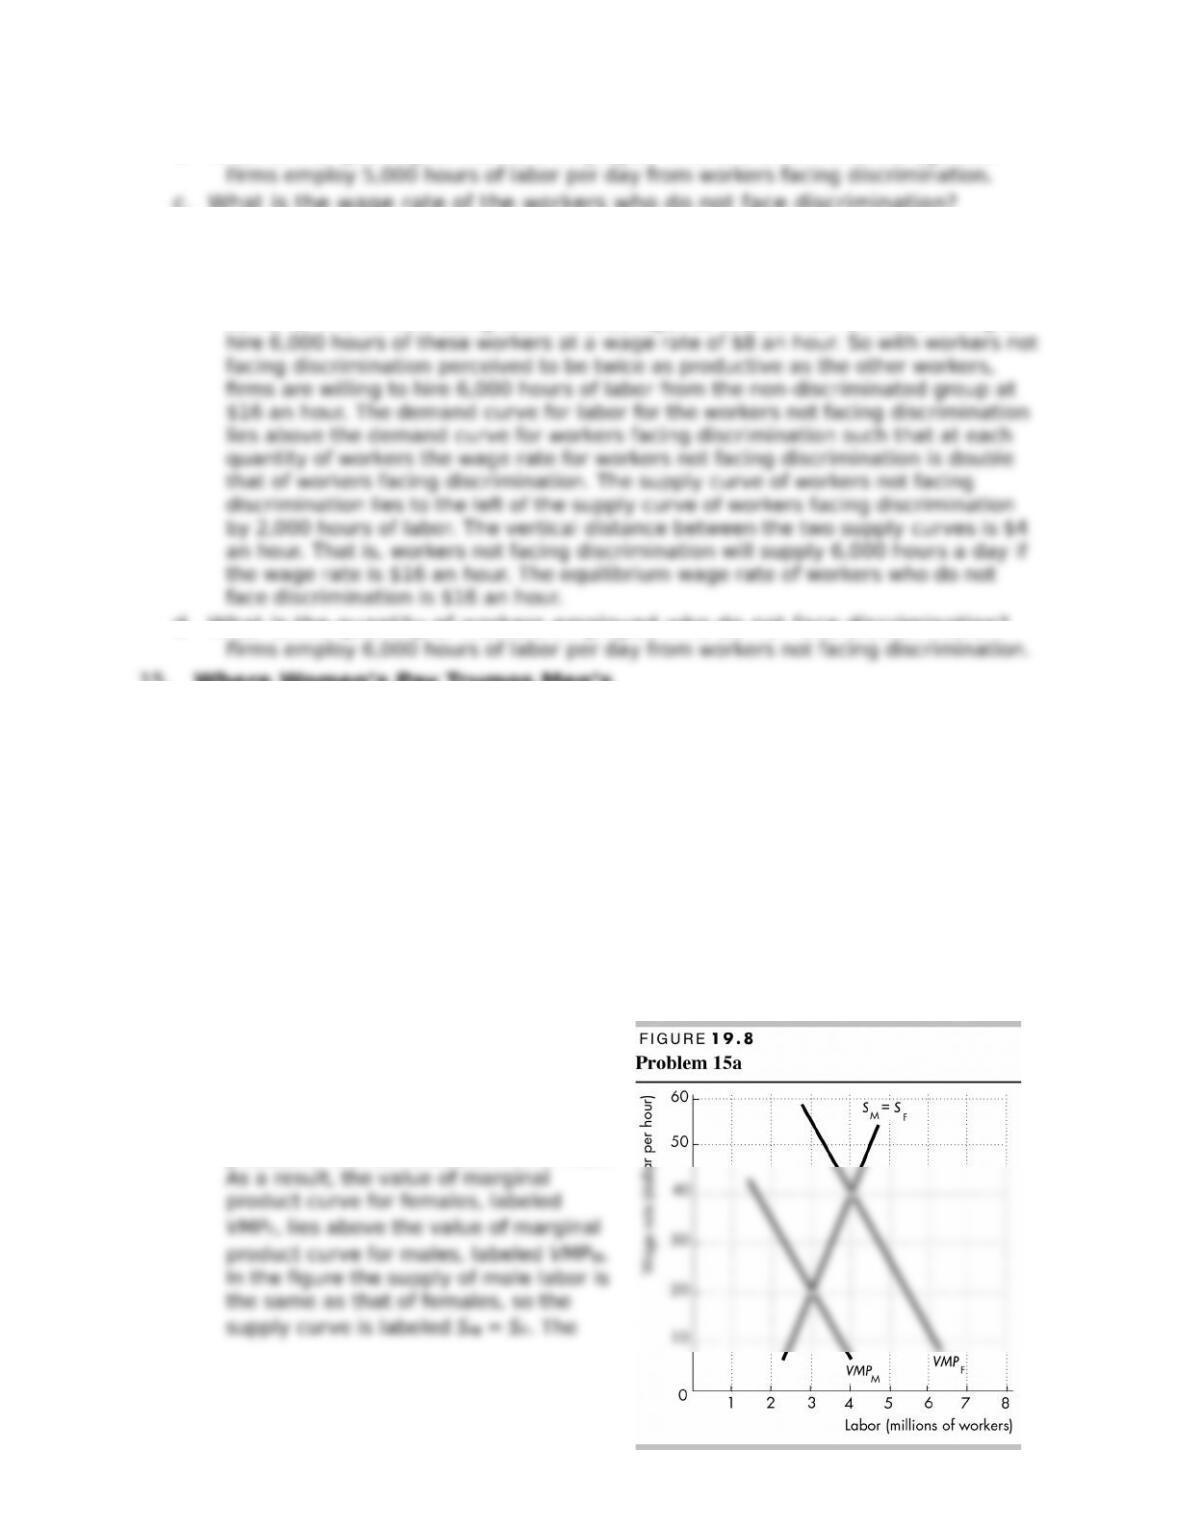
b. What is the quantity of workers employed who are discriminated against?
c. What is the wage rate of the workers who do not face discrimination?
Because the value of marginal product of workers not facing discrimination is
perceived to be twice the value of marginal product of the other workers, rms are
willing to pay the workers not facing discrimination twice the wage rate that they
are willing to pay the workers who face discrimination. For example, the demand
curve for the workers being discriminated against tells us that rms are willing to
d. What is the quantity of workers employed who do not face discrimination?
15. Where Women’s Pay Trumps Men’s
Men work more than women on the job, at least in terms of overall hours.
That’s just one reason why in most elds, men’s earnings exceed women’s
earnings. But Warren Farrell found 39 occupations in which women’s median
earnings exceeded men’s earnings by at least 5 percent and in some cases
by as much as 43 percent. In elds like engineering, a company may get one
woman and seven men applying for a job. If the company wants to hire the
woman, it might have to pay a premium to get her. Also, where women can
combine technical expertise with people skills—such as those required in
sales and where customers prefer dealing with a woman—that’s likely to
contribute to a premium in pay.
Source: CNN, March 2, 2006
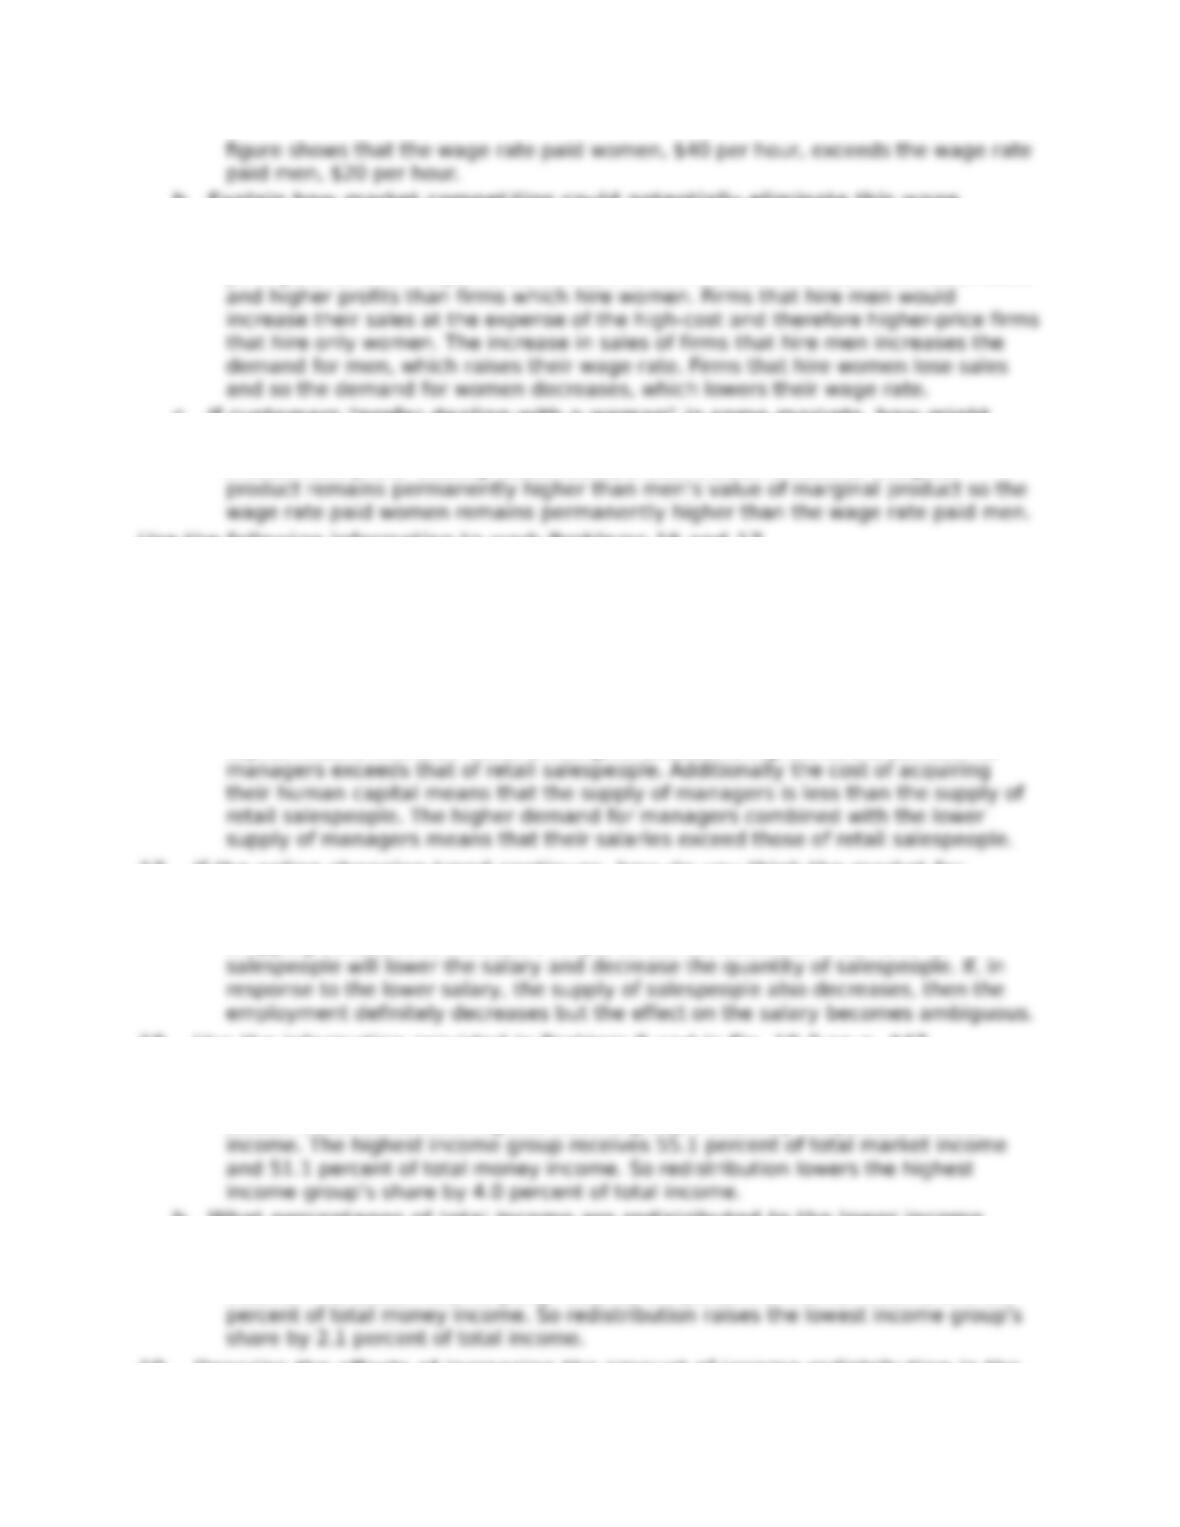
a. Draw a graph to illustrate why discrimination could result in female workers
getting paid more than male workers
for some jobs.
Figure 19.8 shows a labor market in
which men are discriminated against in
favor of women. With the
discrimination, the value of marginal
product of women exceeds that of men.
b. Explain how market competition could potentially eliminate this wage
di?erential.
Men are paid less than women. If men and women are equally productive and the
price paid for their output is the same, then rms which hire men have lower costs
c. If customers “prefer dealing with a woman” in some markets, how might
that lead to a persistent wage di?erential between men and women?
If customers prefer dealing with a woman, then women’s value of marginal
Use the following information to work Problems 16 and 17.
In 2010, 828,000 Americans had full-time management jobs that paid an average
of $96,450 a year while 4.3 million Americans had full-time retail sales jobs that
paid an average of $20,670 a year. Managers require a high school certicate
while retail sales people don’t but they undergo training.
Source: Bureau of Labor Statistics
16. Explain why managers are paid more than retail salespeople.
Managers have more human capital than retail salespeople. Their higher human
capital means that their value of marginal product is higher, so the demand for
17. If the online shopping trend continues, how do you think the market for
salespeople will change in coming years?
Shopping on-line decreases the demand for in-person salespeople. If on-line
shopping continues to increase in importance, the decrease in demand for
18. Use the information provided in Problem 9 and in Fig. 19.3 on p. 447.
a. What is the percentage of total income that is redistributed from the highest
income group?
Redistribution lowers the highest income group’s share by 4.0 percent of total
b. What percentages of total income are redistributed to the lower income
groups?
Redistribution raises the lowest income group’s share by 2.1 percent of total
income. The lowest income group receives 1.1 percent of market income and 3.2
19. Describe the e?ects of increasing the amount of income redistribution in the
United States to the point at which the lowest income group receives 15
percent of total income and the highest income group receives 30 percent of
total income.
If the highest income group’s share falls from 55.1 to 30 percent of total income,
redistribution takes 25.1 percent of income from this group. If the lowest income
Use the following news clip to work Problems 20 and21.
The Tax Debate We Should be Having
A shrinking number of Americans are bearing an even bigger share of the nation’s
income tax burden. In 2005, the bottom 40 percent of Americans by income had an
e?ective tax rate that’s negative: Their households received more money through
the income tax system than they paid. The top 50% of taxpayers pay 97% of total
income tax and the top 10% of taxpayers pay 70%. The top 1% paid almost 40% of
all income tax, a proportion that has jumped dramatically since 1986.
Given the U.S. tax system, any tax cut must benet the rich, but in terms of the
change in e?ective tax rates: The bottom 50% got a much bigger tax cut under
the Bush tax cut than the top 1%. Did the dollar value of Bush’s tax cuts go mostly
to the wealthy? Absolutely.
Source: Fortune, April 14, 2008
20. Explain why tax cuts in a progressive income tax system are consistently
criticized for favoring the wealthy.
In a progressive tax system, the wealthy pay a larger fraction of their income as
21. How might the benets of tax cuts “trickle down” to others whose taxes are
not cut?
The benets of tax cuts can trickle down because tax cuts mean that the wealthy
have more income, some of which they might invest in the businesses they run.
Economics in the News
22. After you have studied Economics in the News on pp. 462–463, answer the
following questions.
a. What is the trend in top executive pay?
The trend in top executive pay has been dramatically upward, especially after
b. How can the idea of a contest among potential top executives explain their
high pay?
The salaries of top executives are determined by a “contest” among potential
executives. The idea is that the rm, by o?ering a very high salary for its top
executives, motivates all of the potential aspirants to these positions to work very
c. How can the idea of a contest among potential top executives explain the
trend in their pay?
The salaries of top executives are determined by a “contest” among potential
executives. The idea is that the rm, by o?ering a very high salary for its top
executives, motivates all of the potential aspirants to these positions to work very
d. If the contest among potential top executives is the correct explanation for
their high pay, what would be the e?ects of a cap on top executive pay?
23. The Best and Worst College Degrees by Salary
Business administration is always a strong contender for honors as the most
popular college major. This is no surprise since students think business is the
way to making big bucks. But is business administration really as lucrative as
students and their parents believe? Nope.
In a new survey by PayScale, Inc. of salaries by college degree, business
administration didn’t even break into the list of the top 10 or 20 most
lucrative college degrees. A variety of engineering majors claim eight of the
top 10 salary spots with chemical engineering ($65,700) winning best for
starting salaries. Out of 75 undergrad college majors, business administration
($42,900) came in 35th, behind such degrees as occupational therapy
($61,300), information technology ($49,400), and economics ($48,800).
Source: moneywatch.com, July 21, 2009
a. Why do college graduates with di?erent majors have drastically di?erent
starting salaries?
The di?erences in starting salaries are the result of di?erences in the demand for
and supply of the di?erent majors. Di?erent majors require di?erent skill sets and
di?erent amounts of human capital. These di?erences mean that the value of
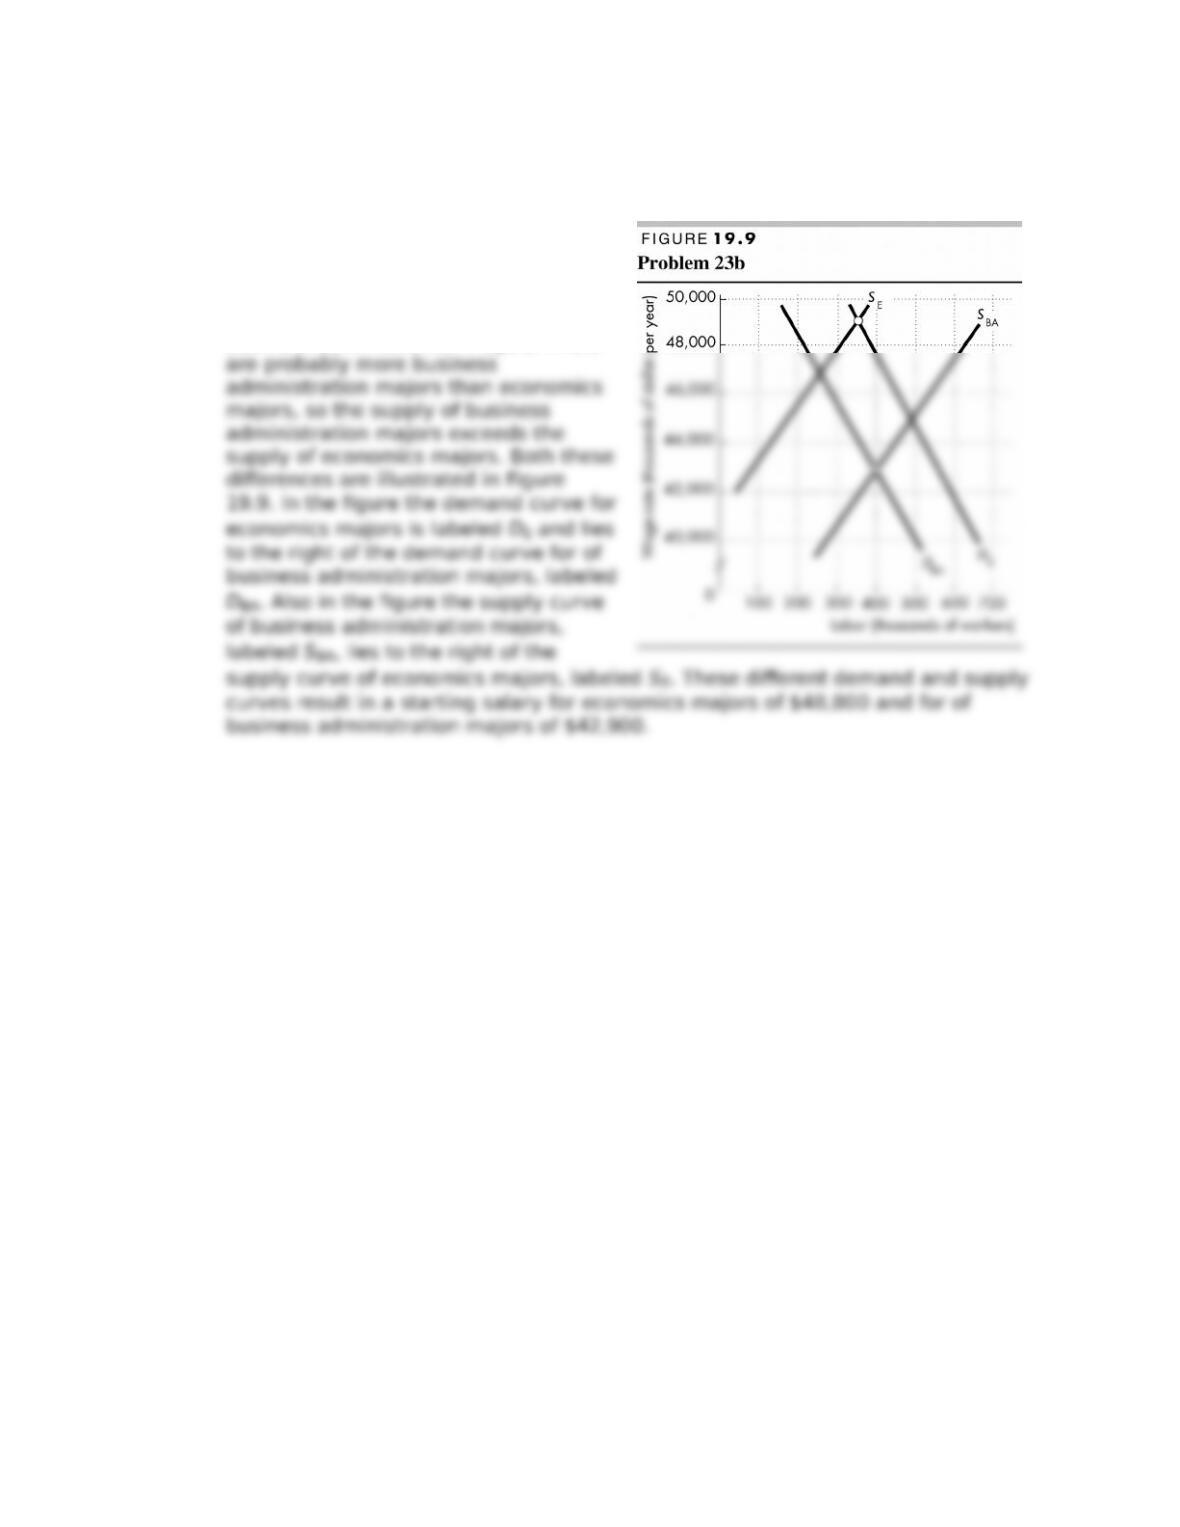
b. Draw a graph of the labor markets for economics majors and business
administration majors to illustrate your explanation of the di?erences in the
starting salaries of these two groups.
Economics majors likely have more
human capital and more marketable
skills than do business administration
majors, so the demand for economics
majors is greater than the demand for
business administration majors. There