A n s w e r s t o t h e R e v i e w Q u i z z e s
Page 452
1. Which is distributed more unequally, income or wealth? Why? Which is the
better measure?
The distribution of wealth is more unequally distributed than income. Wealth is
2. How has the distribution of income changed in the past few decades?
From 1970 economic inequality in the United States has increased. The share of
3. What are the main characteristics of high-income and low-income
households?
There are four major characteristics that in+uence the amount of income earned
by an individual: i) Education: The more education attained by a person the higher
4. What is poverty and how does its incidence vary across the races?
Poverty is a situation in which a household’s income is too low to be able to buy
the quantities of food, shelter, and clothing that are deemed necessary. Poverty is
5. How much mobility has there been through the income quintiles since 2007?
There is some mobility but not a vast amount, particularly in the lowest and
highest quintiles. In both these quintiles, about 70 percent of households remained
© 2016 Pearson Education, Inc.
19ECONOMIC
INEQUALITY
E C O N O M I C I N E Q U A L I T Y 6 1
6 2
Page 454
1. In which countries are incomes distributed most unequally and least
unequally?
Brazil and South Africa have the most unequally distributed incomes. Finland and
2. Which income distribution is more unequal and why: the income distribution
in the United States or in the entire world?
The world Gini ratio is larger than the U.S. Gini ratio which means that the
distribution of world income is less equally distributed than in the United States.
3. How can incomes become more unequally distributed within countries and
less unequally distributed across countries?
Income within nations generally has become distributed less equally. However
Page 458
1. What role does human capital play in accounting for income inequality?
In general acquiring human capital is a costly endeavor so the supply of workers
with a lot of human capital is less than the supply of workers with little human
capital. The diDerence in supply means that the more human capital an individual
2. What role might discrimination play in accounting for income inequality?
If the levels of VMP of labor for a racial group or one sex are perceived to be higher
than that of another racial group or the other sex, then the equilibrium wages
earned will vary across these groups, despite the fact that the two groups have
equal ability. Economists disagree to the extent that discrimination pervades the
3. What role might contests among superstars play in accounting for income
inequality?
62
Contests can explain why the super-rich have incomes that have increased greatly
over the years. With increased globalization, the pool of “contestants” has
4. How might technological change and globalization explain trends in the
distribution of income?
Technological change and globalization have both changed the distribution of
income so that the “rich get richer and the poor get poorer.” More speciEcally,
technological change has increased the demand for high-skilled workers and
5. Does inherited wealth make the distribution of income less equal or more
equal?
An inheritance from older to a younger generations can only increase wealth and
can never decreases wealth within a family, which helps make the distribution of
wealth more unequal over time, all else equal. However if a generation is “lucky”
Page 461
1. How do governments in the United States redistribute income?
The governments in the U.S. use three main ways to redistribute income and
reduce, to some degree, economic inequality: i) Income taxes: Taxes on household
income are charged by the U.S. federal government and by many state
2. Describe the scale of redistribution in the United States.
In the United States, income redistribution increases the share of total income
received by the lowest 60 percent of households and decreases the share of total
3. What is one of the major welfare challenges today and how is it being tackled
in the United States?
The major welfare challenge is households headed by single mothers The poorest
people in the United States are young, minority women who have not completed
high school, have one or more dependent children, and live without a spouse. The
© 2016 Pearson Education, Inc.
E C O N O M I C I N E Q U A L I T Y 6 3
6 4
A nsw ers to t he S tudy P l a n P r o b l e m s a n d
A p p l i c a t i o n s
1. What is money income? Describe the distribution of money income in the
United States in 2012.
Money income equals market income (wages, interest, rent, and proEt earned in
factor markets, before paying income taxes) plus cash payments from the
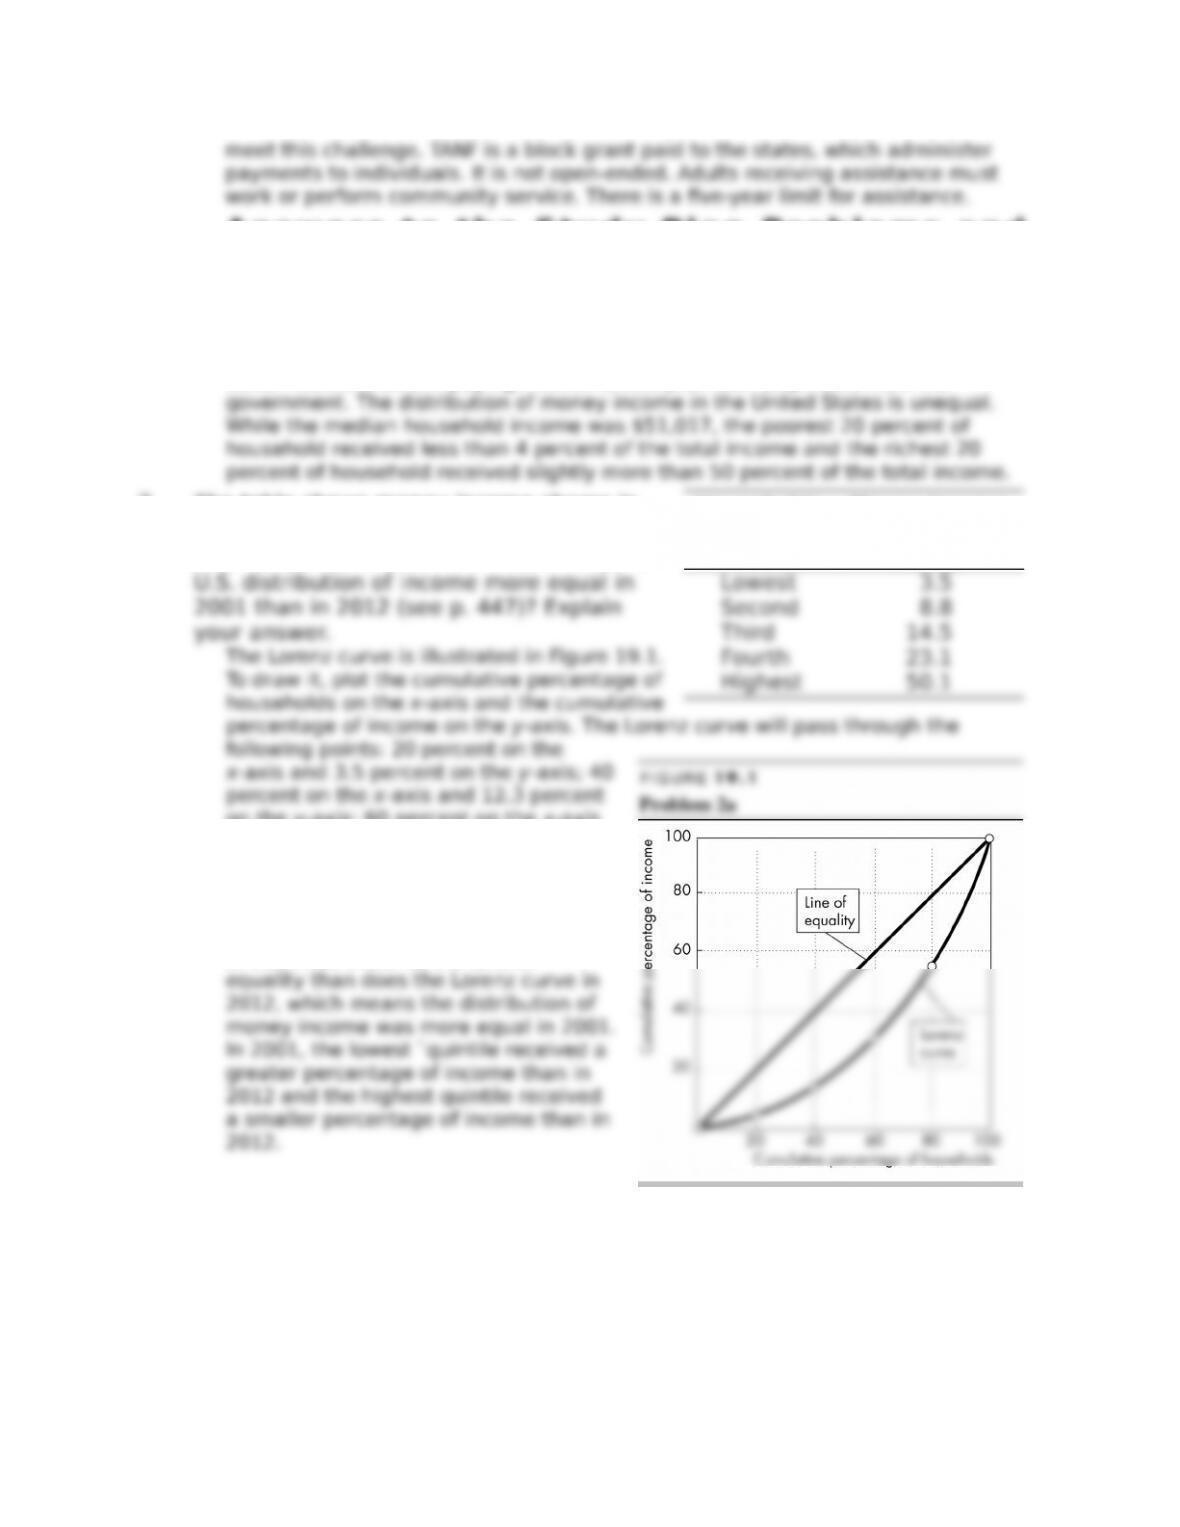
2. The table shows money income shares in
the United States in 2001.
Draw a U.S. Lorenz curve in 2001. Was the
on the y-axis; 60 percent on the x-axis
and 26.8 percent on the y-axis; 80
percent on the x-axis and 49.9 percent
on the y-axis; and 100 percent on the
x-axis and 100 percent on the y-axis.
The Lorenz curve for the U.S. economy
in 2001 lies closer to the Line of
Households
(quintile)
Money income
(percentage of
total)
64
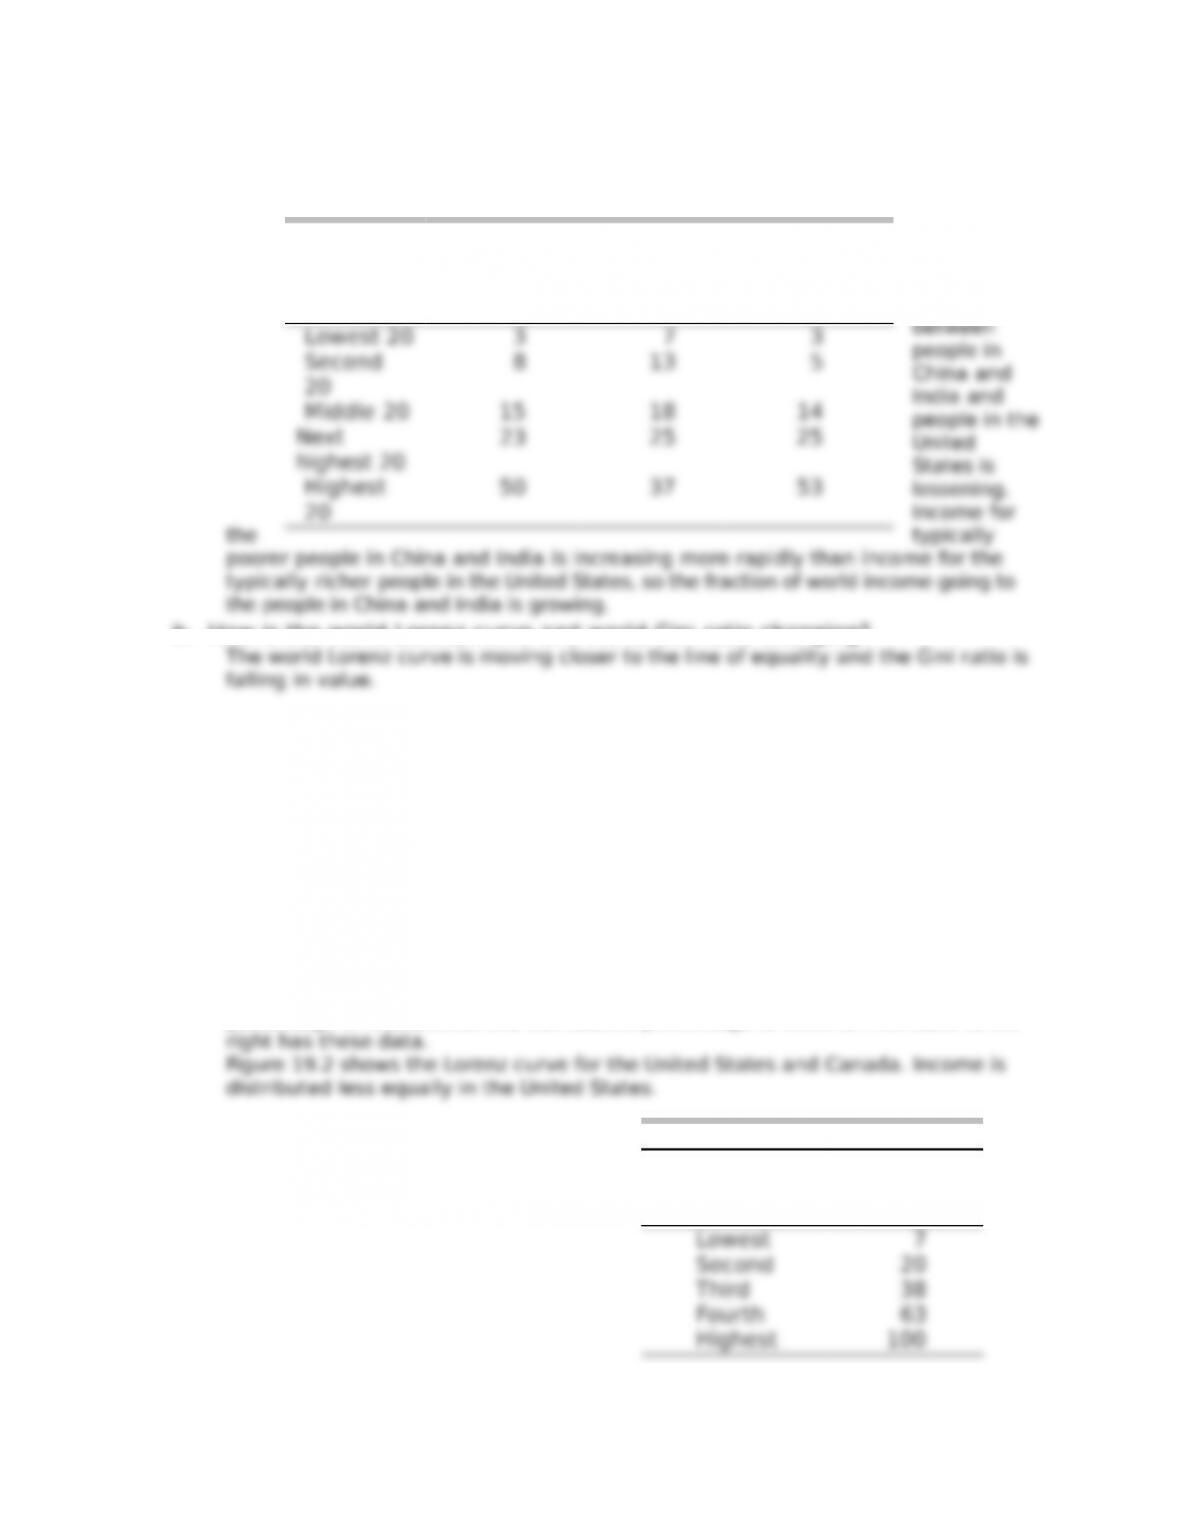
3. Incomes in China and India are a small fraction of U.S. income, but incomes in
China and India are growing at more than twice the rate of U.S. incomes.
a. Explain how economic inequality in China and India is changing relative to
that in the
United
States.
Inequality
between
b. How is the world Lorenz curve and world Gini ratio changing?
Use the table to work Problems 4 and 5. The table shows the income shares in the
United States, Canada, and the United Kingdom in 2009.
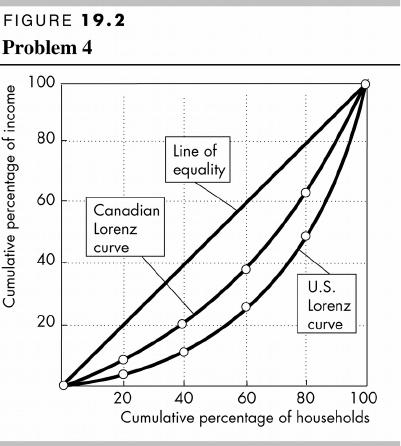
4. Draw the Lorenz curves for the United States and Canada. In which country
was money income less equally distributed in 2009?
To draw the Lorenz curve for Canada, it is necessary to calculate the cumulative
percentage of households and cumulative percentage of income. The table to the
© 2016 Pearson Education, Inc.
Household
s
United
States
Canada United
Kingdom
(percentag
e)
(percentage of total income)
Canada
Households
(quintile)
Cumulative
percentage
of income
E C O N O M I C I N E Q U A L I T Y 6 5
6 6
66
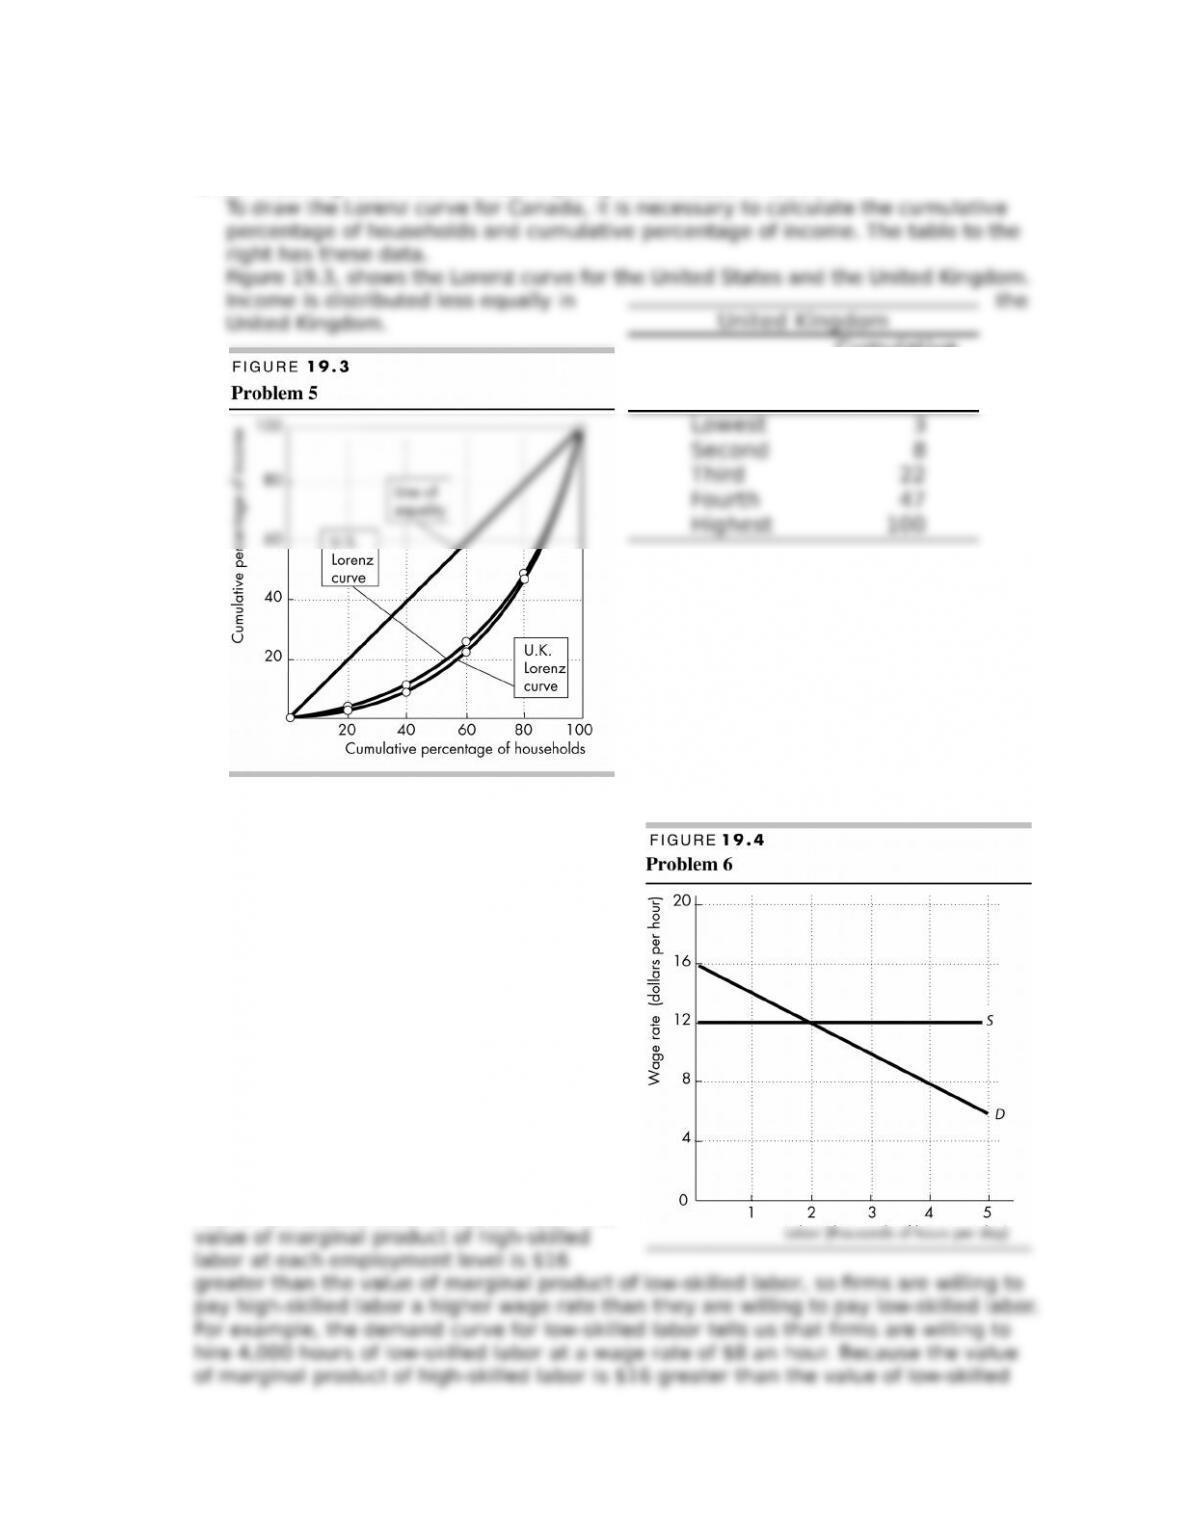
5. Draw the Lorenz curves for the United States and the United Kingdom. In
which country was income less equally distributed in 2009?
6. Figure 19.4 shows the market for
low-skilled labor. The value of marginal
product of high-skilled workers is $16
an hour greater than that of low-skilled
workers at each quantity of labor. The
cost of acquiring human capital adds
$12 an hour to the wage that must be
oDered to attract high-skilled labor.
Compare the equilibrium wage rates of
low-skilled labor and high-skilled labor.
Explain why the diDerence between
these wage rates equals the cost of
acquiring human capital.
The wage rate adjusts to make the quantity
of labor demanded equal to the quantity
supplied. Figure 19.4 shows that the wage
rate of low-skilled labor is $12 an hour. The
Households
(quintile)
Cumulative
percentage
of income
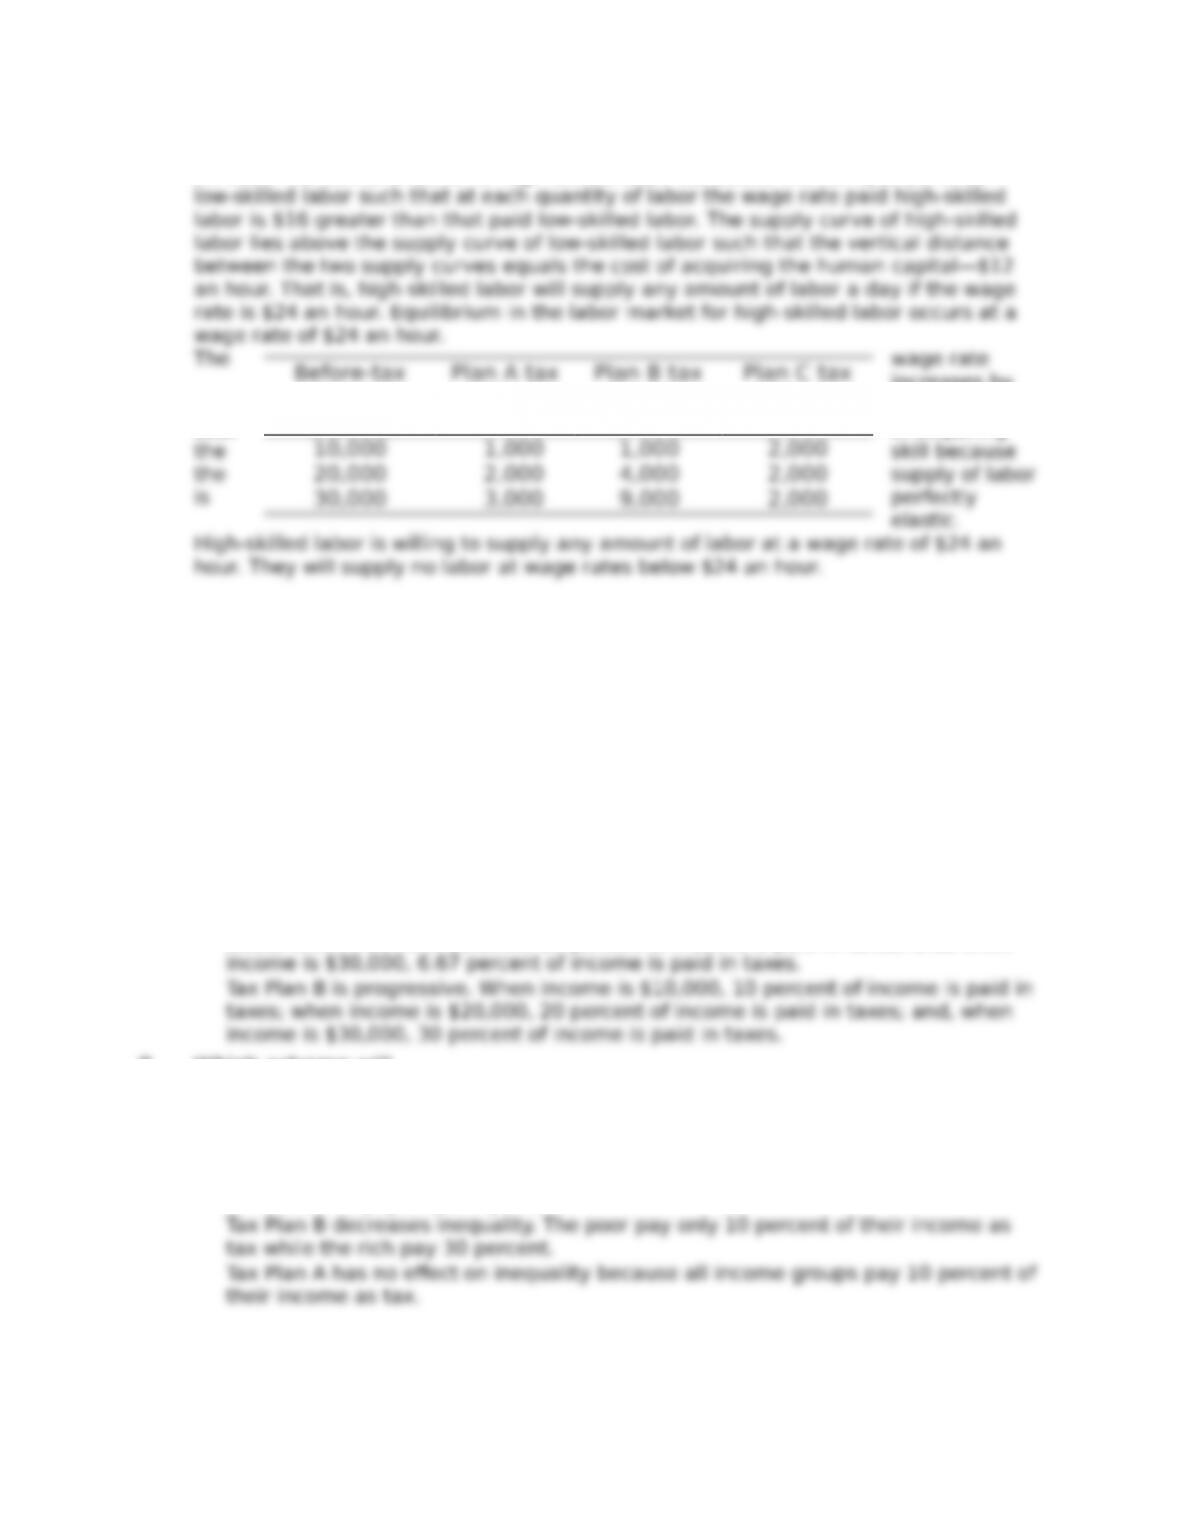
labor, Erms are willing to hire 4,000 hours of high–skilled labor at a wage rate of $24
an hour. The demand curve for high-skilled labor lies above the demand curve for
increases by
exactly the
cost of acquiring
Use the table to work Problems 7 and 8.
The table shows three redistribution schemes.
7. Which scheme has
(i) a proportional tax?
(ii) a regressive tax?
(iii) a progressive tax?
Tax Plan A is a proportional tax. At each level of income, 10 percent of income is
paid in taxes.
Tax Plan C is regressive. When income is $10,000, 20 percent of income is paid in
taxes; when income is $20,000, 10 percent of income is paid in taxes; and, when
8. Which scheme will
(i) increase economic inequality?
(ii) reduce economic inequality?
(iii) have no eDect on economic inequality?
Tax Plan C increases inequality. The poor pay 20 percent of their income as tax
while the rich pay only 6.7 percent.
Before-tax
income
(dollars)
Plan A tax
(dollars)
Plan B tax
(dollars)
Plan C tax
(dollars)