
W H AT I S E C O N O M I C S ? 2 1 1
T h e B i g P i c t u r e
Where we have been:
Chapter 18 explained how factor markets allocate income based on demand
and supply for land, capital, and labor. Chapter 19 examines how the factor
market outcomes in(uence the distribution of income and wealth in society.
This chapter explains how we measure the degree of inequality, the
characteristics of households at di+erent places in the distribution, trends in
inequality, and redistribution policies. A theme of the chapter is the role played
by human capital and the resulting increase in productivity in a+ecting the
distribution of income.
Where we are going:
The following chapter is the last of the microeconomic theory chapters. It
focuses on risk and uncertainty and market e-ciency in the face of
uncertainty.
N e w i n t h e Tw e l f t h E d i t i o n
More data and analysis about inequality in the distribution of wealth have been
included. The introduction and conclusion consider the high pay packages that
have been awarded to female executives in technology industries. A new Worked
Problem section has been added. Using data from Norway and South Africa, the
Worked Problem takes the students through the creation of a Lorenz curve. Then it
shows the students how to use Lorenz curves to compare economic inequality and
what would be necessary to make the distribution of income more equal. To
include the new Worked Problem without lengthening the chapter, some problems
have been removed from the Study Plan Problem and Applications. These
problems are in the MyEconLab and are called Extra Problems.
19ECONOMIC
INEQUALITY
C h a p t e r
211
L e c t u r e N o t e s
Economic Inequality
Incomes are distributed unequally.
In large part, features of the labor market account for the unequal distribution of
income.
Other factors also a+ect income inequality.
The government has policies that redistribute income.
I. Economic Inequality in the United States
Money income equals market income plus cash payments to households by the
government. Market income equals wages, interest, rent, and pro3t earned in
factor markets before paying income taxes. In the United States in 2012, the median
income was $51,017, and the mean income was $71,274.
Where are you in the income distribution? Ask the students to place themselves in
the U.S. income distribution by estimating their household income. Be sure to remind them
to add together the income of both of their parents if they live with both and both earn
income. Many students will be surprised that they are from upper-middle income families,
even if they suspected that they were middle income to lower middle income families.
The Distribution of Income
The distribution of income in the U.S. is positively skewed, so that the distribution of
incomes has a long tail of high income households. In 2012,
the poorest 20 percent of households received 3.2 percent of total income
the middle 20 percent of households received 14.4 percent of total income
the richest 20 percent of households received 51.1 percent of total income.
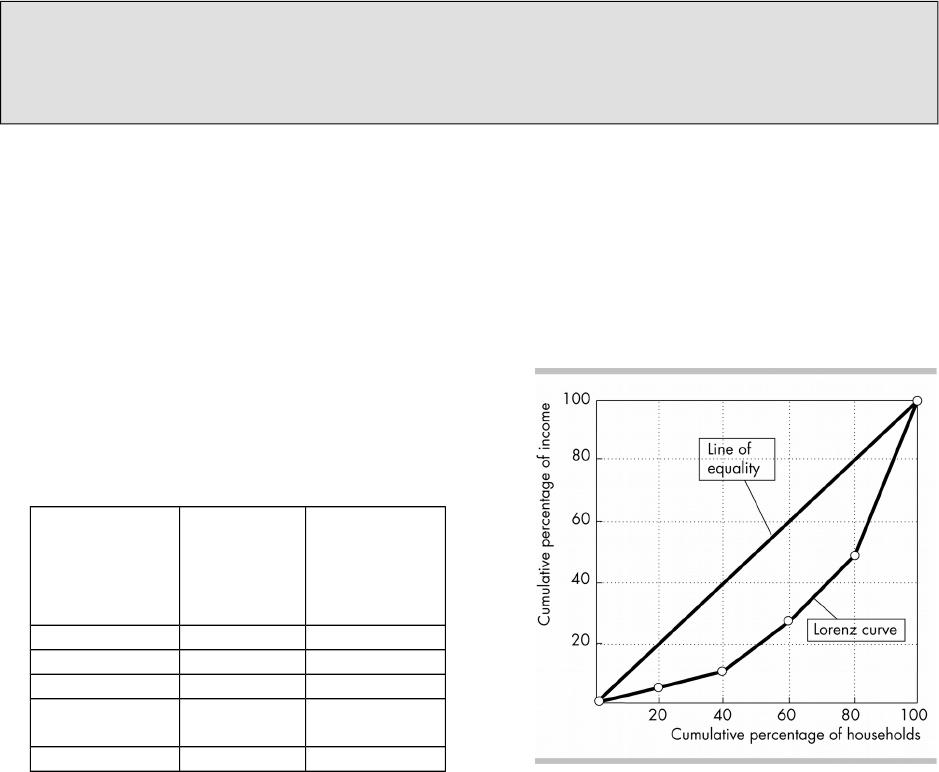
The Income Lorenz Curve
An income Lorenz curve graphs the cumulative percentage of income earned
against the cumulative percentage of
households.
The table below has the (approximate)
income shares for the United States and
the 3gure graphs the resulting Lorenz
curve.
Households
(percentage)
Income
(percenta
ge)
Income
(cumulativ
e
percentage
)
Lowest 20 3 3
Second 20 9 12
Middle 20 15 27
Next highest
20
23 50
Highest 20 50 100
The “Line of Equality” shows what the distribution of income would be if incomes
were equally distributed. The closer the Lorenz curve to the line of equality, the more
equal is the distribution of income and the farther away the Lorenz curve from the
line of equality, the less equal is the distribution of income.

Interpreting the Lorenz curve. Emphasize that the Lorenz curve measures economic
equality within a given population. Ask: which is more unequal, the distribution of income
in the United States or the distribution of income among the 849 major league baseball
players? After a minute or two of discussion, you can provide the data in the table below.
Make the point that although income is much more unequally distributed among major
league baseball players, in 2009 the poorest earned $400,000 a year, which is more than
twice the average of the 3fth quintile in the United States, $180,000. Relate this reality to a
comparison of countries to the United States. Get the students to consider the fact that the
average income person living in the poorest quintile in the United States is still enjoying a
higher level of income than the median income individual living in any of a majority of
other countries around the world.
Quintile U.S. Households Major league baseball players
percentage of income percentage of income
Lowest 3.2 1.8
Second 8.3 2.8
Middle 14.4 8.2
Fourth 23.0 24.0
Highest 51.1 63.3
The Distribution of Wealth
Wealth is the value of all the things that are owned by a household at a given point
in time. The distribution of wealth can be examined with a Lorenz Curve. Because
human capital is not included in measured wealth, the distribution of wealth is more
unequal than the distribution of income and the income distribution is a more
accurate measure of economic inequality.
Annual or Lifetime Distribution of Wealth?
Household income varies over the life cycle, typically starting out low, growing to a
peak at retirement, and then falling after retirement. Wealth follows a similar
pattern.
Inequality in annual income and wealth data overstates life time inequality because
households are at di+erent stages in their life cycles.
Trends in Inequality
The Gini ratio is based on the Lorenz curve and equals the ratio of the area
between the line of equality and the Lorenz curve to the entire area beneath the line
of equality. The larger the Gini ratio, the more unequal the distribution. The Gini ratio
shows that since 1970 the distribution of income in the United States has become less
equal.
Economics In Action considers the growing inequality of U.S. incomes. It notes the steady
increase in income share for the richest Americans. In 2012 67 percent of Americans
surveyed said that incomes were too unequal when in 1991 only 21 percent said this. The
Economics in Action feature also presents data on the impact of education, type of
household, age, race, and region on incomes.
Poverty
Poverty is a situation in which a household’s income is too low to be able to buy the
quantities of food, shelter, and clothing that are deemed necessary. In 2012, the
poverty level calculated by the Social Security Administration for a four–person
family was $23,492.
In 2012, 46 million Americans, 15 percent of the population, lived below the poverty
level..
Race: In 2012, 13 percent of white Americans lived in poverty compared to 26
percent of Hispanic-origin Americans and 27 percent of black Americans.
© 2016 Pearson Education, Inc.
E C O N O M I C I N E Q U A L I T Y 1 9 1

Age: Poverty rates are 22 percent for children and 9 percent for seniors over age
65.
Work Experience: The poverty rate for those with jobs is 7 percent or for those
without 33 percent.
Physical Ability: 29 percent of people with disabilities are poor.
Household Status: 28 percent of households headed by women with no husbands
present experience poverty.
The Economics in Action considers whether the American Dream is still alive. It uses data
to examine mobility up and down the income distribution. The analysis concludes that
between 2007 and 2009 most households did not move from one quintile to the next. But
there is still mobility, to both higher and lower quintiles.
II. Inequality in the World Economy
Income Distribution in Selected Countries
Countries such as Brazil and South Africa have more unequally distributed incomes,
with the average person in the highest quintile receiving 32.5 times the income of
the average person in the lowest quintile. The United States lie somewhere in the
middle globally, with the average person in the highest quintile receiving 10 times
the income of the average person in the lowest quintile. Finland and Sweden have
more equally distributed incomes, with the average person in the highest quintile
receiving 4.4 times the income of the average person in the lowest quintile.
Brazil and South Africa are somewhat extreme and have relatively small and rich
European populations and relatively large and poor indigenous populations.
Finland and Sweden are also somewhat extreme, but less unusual. They are
similar in income distribution to many European countries where governments
pursue aggressive income redistribution policies.
Global Inequality and Its Trends
The global distribution of wealth is much more unequal than the distribution within
any one country.
Many nations are still pre-industrial and very poor, while others are sophisticated
industrial producers and accordingly quite rich.
3 billion people or 50 percent of the world’s population live on $2.50 per day or less.
2 billion people or 30 percent of the world’s population live on more than $2.50 and
less than $10 per day. That means 5 billion people or 80 percent of the world’s
population live on $10 per day or less.
An average person in the United States has an income of $115 per day. The average
person in the highest quintile in the industrialized countries has $460 per day. The
average American earns 46 times the income of half the world’s population and 11.5
times the income of 80 percent of the world’s population.
The world Gini ratio in 2009 is about .64. The U.S. Gini ratio is about .47. These Gini
ratios mean the world’s Lorenz curve lies much farther to the right (away from the
line of equality) than the U.S. curve.
Over time, incomes have become more unequal in the United States and the same
trend can be found in most economies. But while incomes are more unequal within
countries, the world distribution of income as a whole is becoming less unequal. The
average incomes in poor countries are rising faster than the average incomes in rich
countries, narrowing the gap across countries.
Is capitalism heartless? Emphasize that there are no societies where income or wealth
is equally distributed. Society has two main concerns: prosperity and equality. Private
enterprise (capitalist) societies are, in general, more prosperous, and in most cases (but
not all) have no less equal an income distribution than socialist societies. Ask which is
© 2016 Pearson Education, Inc.
1 9 2 C H A P T E R 1 9
better for a family, to be the poorest in a rich but unequal society or equal with everyone
else in a poor society.
III. The Sources of Economic Inequality
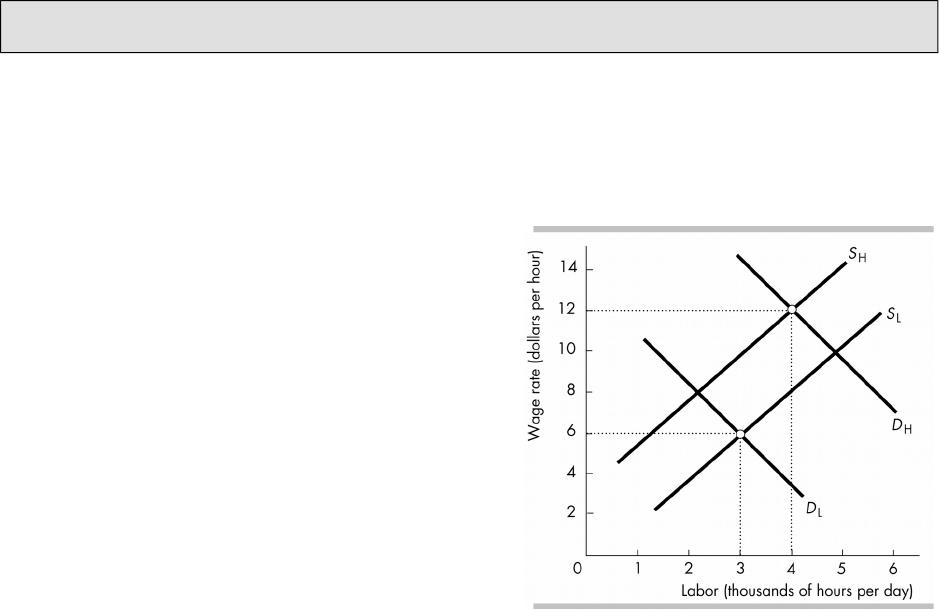
Human Capital
In labor markets, di+erences in human capital as well as discrimination can lead to
di+erences in incomes.
In general, people with more human capital are high-skilled workers. Skills a+ect
both the demand and supply side of the labor market:
High-skilled workers have a larger
VMP than low-skilled workers, so the
demand for high-skilled workers
exceeds the demand for low-skilled
workers.
High-skilled workers must incur the
cost of acquiring their skills, so the
supply of high-skilled workers is less
than the supply of low-skilled workers.
As the 3gure shows, the combination
of higher demand (DH compared to
DL) and lower supply (SH compared to
SL) for high-skilled workers versus
low-skilled workers leads to a higher
wage rate for high-skilled workers.
The wage di+erential between
high-skilled and low-skilled workers has widened over time because technological
changes and globalization have increased the demand for high-skilled workers and
decreased the demand for low-skilled workers. (Technological change has been a
complement for high-skilled workers and substitute for low-skilled workers.)
Discrimination
Discrimination is another possible source of income inequality. The VMP of the group
being discriminated against is less than the VMP of the other group, so
discrimination can lower the wage rate of the group being discriminated against.
Economists disagree to the extent that discrimination actually a+ects wage rates.
One line of reasoning states that those 3rms that practice discrimination face higher
costs than those 3rms that do not. As a result, the pro3ts of the discriminating 3rms
will be lower and the market price of their goods and services will be higher so that
these 3rms cannot survive in competitive markets.
How much workers choose to specialize primarily in a career versus spending more
time and energy on home life a+ects wages. This factor explains part of the wage
gap between married men and other types of workers. When the wages of never
married men and never married women with the same amount of human capital
were compared, wages of the two groups were the same.
Contests Among Superstars
Some of the really large di+erences in wages cannot be accounted for by di+erences
in human capital. Contests among superstars can explain this di+erence.
Contests with prizes do a good job of allocating scarce resources e-ciently when the
e+orts of participants are hard to monitor and reward directly. This describes the
case for CEOs and other stars.
The prizes are so di+erent because they need to induce enough e+ort.
© 2016 Pearson Education, Inc.
E C O N O M I C I N E Q U A L I T Y 1 9 3

In sports, globalization has increased the total revenue generated by sports. The
total prize money has increased and, to generate enough e+ort amongst all the
players, the share going to winner has increased.
In business, more businesses are global in nature so the number of executives
vying for the top positions has increased. To generate enough e+ort amongst all
the executives, the salary paid the CEO—the “winner” of the “contest”—has
increased.
What demographic characteristics are correlated with household income? List the
demographic characteristics that tend to be correlated with household income: level of
education, size of household, and marital status, for example. These result from individual
choices and not from characteristics outside the individual’s control (age or race).
Emphasize that not all who are living in the lowest (or highest) income quintile will remain
in that same economic situation in the long term. Emphasize that private enterprise
democracies create dynamic socio-economic pathways for their citizens. Investing in
human capital today (deferring current consumption) ensures a much more prosperous life
for tomorrow. Advise your students that this investment is much harder to implement after
reaching middle age than as a young adult.
Unequal Wealth
Greater wealth inequality arises from two sources: life cycle saving patterns and
transfers of wealth from one generation to the next.
Life-Cycle Saving Patterns: Wealth is built over one’s lifetime, so much of the wealth
is owned by people in their sixties.
Intergenerational Transfers: Households that inherit wealth are likely to transfer that
wealth to the next generation.
Marriage and Wealth Concentration: Assortive mating (“like attracts like”) implies
that wealthy people seek wealthy partners, so wealth becomes concentrated in a
small number of families.
IV. Income Redistribution
Governments in the United States use three main ways to redistribute income: taxes,
income maintenance programs, and subsidized services.
Income Taxes
All levels of government collect income taxes. Income taxes may be progressive,
regressive, or proportional. A progressive income tax is one that taxes income at
an average rate that increases with income. A regressive income tax is one that
taxes income at an average rate that decreases with income. A proportional
income tax (also called a (at income tax) is one that taxes income at a constant
average rate, regardless of income.
The U.S. federal income tax is progressive. Ask the students if they think they know the tax
burden paid by the richest 1 percent, 5 percent, and 10 percent of taxpayers. The students
usually underestimate how progressive the income tax rate system is. IRS 3gures based on
income tax returns collected for the year 2008 reveal that:
The richest 1 percent paid 38 percent of all income taxes collected.
The richest 5 percent paid 58.7 percent of all income taxes collected.
The richest 10 percent paid 69.9 percent of all income taxes collected.
The lowest 50 percent paid 2.7 percent of the total income tax collected.
Clearly the progressive nature of the federal tax system redistributes income away from
richer households.
Income Maintenance Programs
There are three major types of programs that redistribute income by making direct
payments to people in the lower part of the income distribution:
© 2016 Pearson Education, Inc.
1 9 4 C H A P T E R 1 9

Social security programs: Old Age, Survivors, Disability, and Health Insurance
(OASDHI) makes monthly cash payments to retired or disabled workers or their
surviving spouses and children.
Unemployment compensation: Every state government has established an
unemployment compensation program that taxes all workers in the state and gives
unemployed workers in the state a periodic cash bene3t for a speci3ed period of
time.
Welfare programs: Welfare programs provide incomes for people with incomes below
a speci3ed level and who do not qualify for social security or unemployment
programs. These programs include the Supplementary Security Income (SSI)
program, the Temporary Assistance for Needy Households (TANF) program, the Food
Stamp program, and Medicaid.
Subsidized Services
A great deal of income redistribution takes place in the United States through the
provision of subsidized services, services provided by the government at prices
below the cost of production. Examples include primary and secondary public
education, as well as state colleges and universities. Medicare and Medicaid are
other examples of subsidized services.
An Economics in Action feature presents data that shows how government taxes and
bene3t programs redistribute income and make the distribution more equal.
The Big Tradeof
Redistributing income leads to a tradeo+ between equity and e-ciency, known as
the big tradeof. Programs to redistribute income lead to ine-ciency because the
process of income redistribution uses up resources and, more importantly, because
redistribution decreases the incentives for the taxpaying workers to provide labor
and decreases the incentives for the bene3t recipients to provide labor.
What are the costs of redistributing income? Emphasize that there is an opportunity
cost to redistributing income in any society: when a dollar is taken from a rich person, a
poor person receives less than a dollar. The size of the economic pie shrinks because:
Productive resources are consumed to implement the program rather than produce
goods and services,
Redistribution requires taxation of income or exchange, which imposes a dead weight
loss to society, and
The incentives facing the recipient of supplemental income are altered, delaying
re-entry into the work force.
Economics in the News: Using a recent hire by Apple as its launching point, the
application considers trends in incomes of the superrich and why the prizes may be larger
for the winners than they were in the past.
© 2016 Pearson Education, Inc.
E C O N O M I C I N E Q U A L I T Y 1 9 5
A d d i t i o n a l P r o b l e m s
1. How does the minimum wage a+ect the distribution of income?
2. Compared to the United States, managers in Hong Kong and Malaysia are
paid much more than the low-skilled factory workers that they supervise.
What accounts for this di+erence in relative pay?
3. Many pets in rich nations eat better than people in poor nations. To equalize
the international distribution of income, do you think that rich nations should
tax their citizens and give the income to the poor of very poor nations? Would
this policy be fair?
S o l u t i o n s t o A d d i t i o n a l P r o b l e m s
1. The minimum wage a+ects the distribution of income in several ways. First, workers
who without the minimum wage would be paid less, receive a higher income than
otherwise with the minimum wage. Because these workers are low-income workers,
the minimum wage makes the distribution of income a bit more equal. Second, some
workers lose their jobs when a minimum wage is imposed. These workers’ incomes fall
and the minimum wage makes the distribution of income less equal. Finally, the
minimum wage probably decreases some 3rms’ pro3ts and so decreases their owners’
incomes. Because owners are generally higher–income earners, the minimum wage
makes the distribution of income more equal.
2. The di+erence in pay is a result of the fact that managerial skills are in much smaller
supply in Hong Kong and Malaysia. There are many low-skilled factory (oor workers in
Hong Kong and Malaysia. There are few high-skilled managers. As a result, the
equilibrium wage rate paid to the few high-skilled managers in Hong Kong and
Malaysia is many times greater than the wage rate paid to the many low-skilled
factory (oor workers.
3. It is indeed the case that people in rich nations are much better o+ than people in poor
nations. Rich nations are better o+ because their citizens are more productive because
they have immensely greater amounts of physical and human capital. The question of
redistributing income from one nation to another has a big tradeo+ associated with it.
In particular, while the transfer of income to poorer nations equalizes income among
nations, it lessens the poor nations’ incentives to develop and so slows their economic
growth. In addition, the issue of fairness comes into play. The “fair results” approach
to fairness argues that it is de3nitely fair to transfer resources to poor nations. But the
“fair rules” approach to fairness suggests that these transfers aren’t fair. Taking tax
revenue from people in rich nations to transfer the funds to poor nations is not a
voluntary exchange and so is unfair.
A d d i t i o n a l D i s c u s s i o n Q u e s t i o n s
1. What is the di erence between poverty and an unequal income
distribution? Ask the students to consider each of these measures of
economic inequality by asking the following set of questions:
How would you de”ne poverty? Get the students to realize that poverty is a
relative measure, rather than a positive measure of economic inequality. The
minimum quantity of food, clothing, and shelter to a U.S. student is likely to be
considered as abundant riches to the average citizen of developing countries.
© 2016 Pearson Education, Inc.
1 9 6 C H A P T E R 1 9
Does an unequal income distribution imply that poverty exists? Does
poverty imply that an unequal income distribution exists? The
upper-income people in some developing countries have annual incomes that
are less than the monthly income of the typical unskilled laborer living in the
U.S. Because poverty is a relative measure, there is little direct relationship
between unequal income distribution and the incidence of poverty.
Is it necessarily a bad thing for the Gini Ratio to increase over time?
Ask the students what the implications are for a society in which: 1) workers
are rewarded based on merit, 2) most workers make good decisions over their
lifetime, (invest in human capital, maintain a good work ethic, etc.) some
workers make bad decisions (drop out of school, waste their life on drugs,
crime, etc.), and 3) those that make good decisions in life become more
productive and earn higher wages than those that make bad decisions in life.
Point out that even in a “perfect world” where race or gender discrimination
was completely absent, and no “bad luck” situations were to ever a+ect
anyone, the Gini Ratio would still increase over time as this merit-based
economy continues to reward those who make good decisions more highly
than those who make bad decisions. This implies that an increasing Gini Ratio
is not necessarily a bad indicator for those concerned about equity as well as
e-ciency.
2. If you were a benevolent dictator, how would you deal with the Big
Tradeo ? Ask the students to choose a degree of economic inequality they
think should be the maximum that our society must endure (in terms of lost
e-ciency). Have them justify this level of economic inequality by using the
economic concepts of marginal bene3t and marginal costs:
How would you measure the marginal cost to society of an unequal
income distribution? Point out that before we embark on a program to
rectify the problem of economic inequality, we 3rst must assess the degree of
the problem: How should we measure the social cost of unequal economic
opportunities? Many economic studies have attempted to do this, but without
much success in gaining wide acceptance of the methodology.
How would you measure the marginal cost to society of implementing
an income redistribution program? Once we are comfortable with our
measure of the social cost of economic inequality, we turn to the alternative:
What amount of prosperity would we all be willing to give up as a society to
increase economic equality in our society (how much smaller would we want
the economic pie to be)? More importantly, what cost would we be willing to
impose on others in society to rectify economic inequality? How should this
decision be made? Help the students to see how complex the issue of
economic inequality really is in the world. There are no simple solutions.
3. If two di erent but equally “important” occupations in society were
to earn very di erent levels of income, is this necessarily re,ective of
discrimination? Remind students that while it is true that 3rms’ demand for
labor is partially derived from society’s demand for the product generated
from the occupation’s labor force, the wages that 3rms pay for that labor is
also determined by the households’ willingness to supply labor to that
occupation. Much of the observed di+erences in wages across equally
“important” occupations can be attributed to the relative unwillingness of
households to supply as much labor for the higher paid occupation as for the
lower paid occupation. This is a di+erent reality than assuming that 3rms’ are
largely unwilling to pay a wage equal to the value of the true VMP of labor to a
certain class of laborers that tend to dominate the lower paid occupations.
© 2016 Pearson Education, Inc.
E C O N O M I C I N E Q U A L I T Y 1 9 7
4. Are prizes on shows like American Idol unfair? Discuss whether the
unevenness in the rewards for shows induces more e+ort or are unfair.
5. Are there fewer women CEOs and do women CEOs make lower wages
because they are not giving enough to their careers as they try to
maintain family responsibilities? Recently the CFO of Facebook wrote a
book that garnered a lot of press and sparked conversation about what
women need to be giving to the labor market to succeed. Supportive and
critical opinion pieces on this topic are widely available and might spark a
good classroom conversation.
© 2016 Pearson Education, Inc.
1 9 8 C H A P T E R 1 9