Answers to Additional Problems and Applications
Use the spreadsheet to work
Problems 12 to 14. The
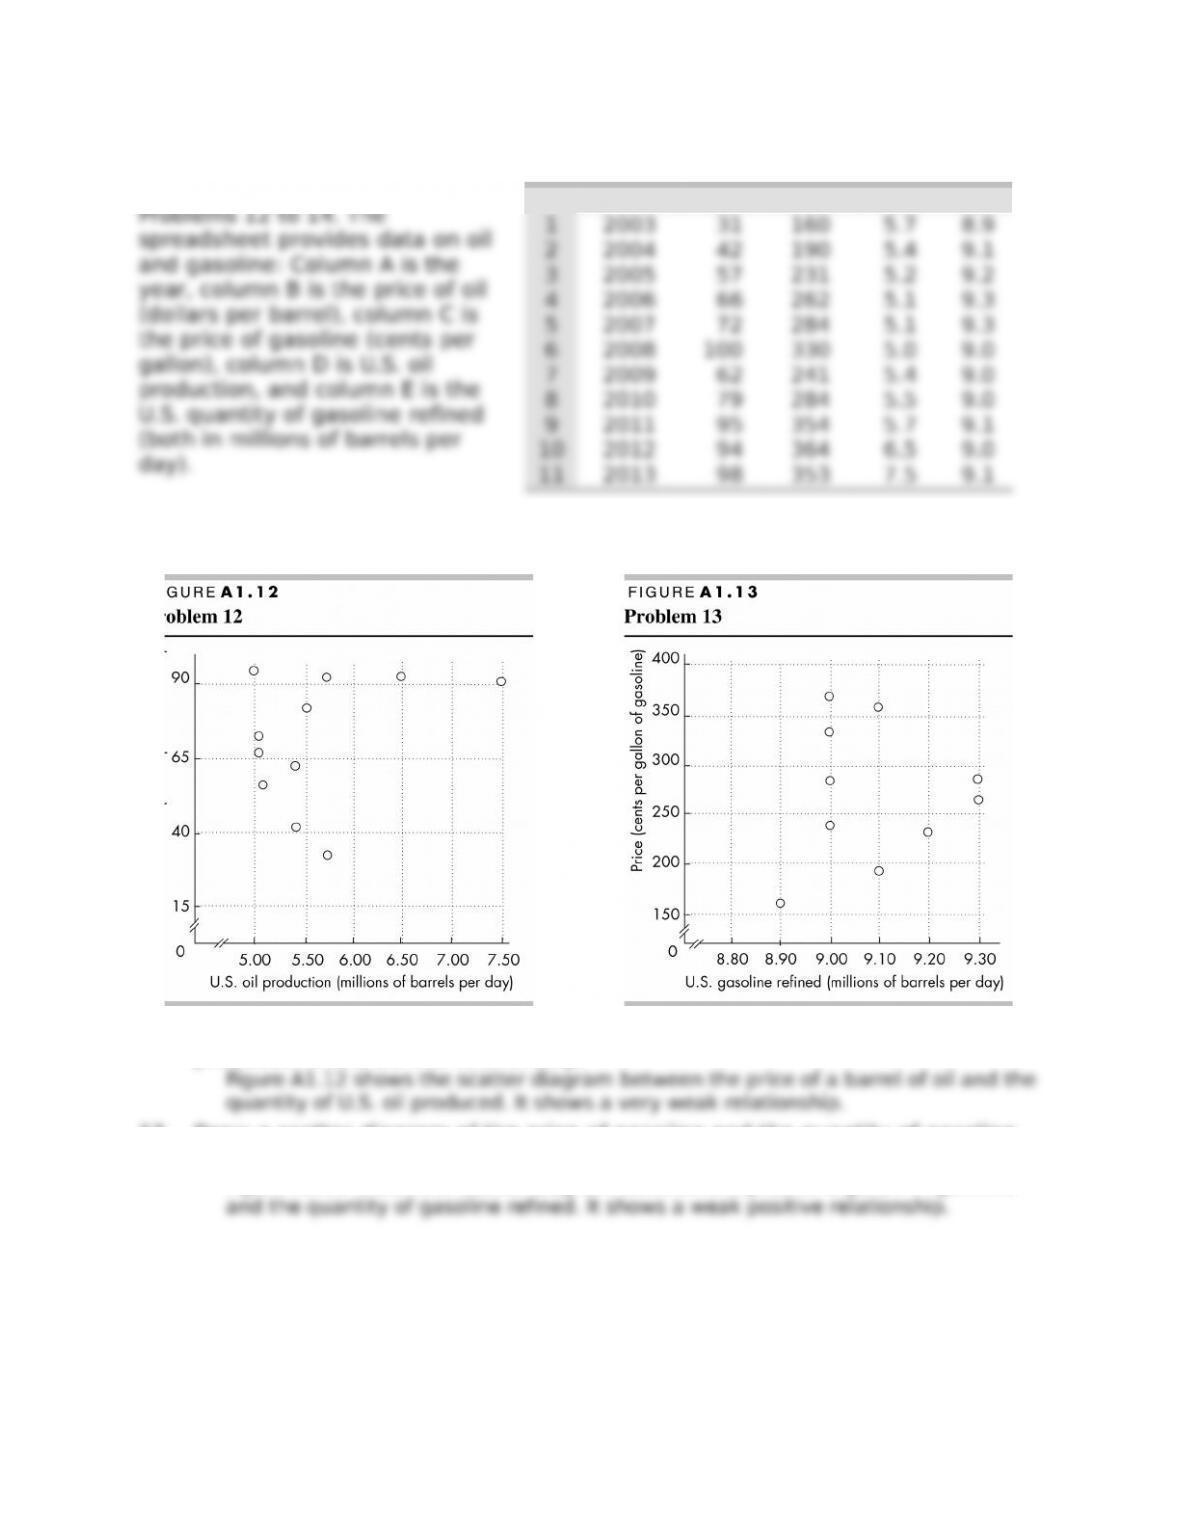
12. Draw a scatter diagram of the price of oil and the quantity of U.S. oil
produced. Describe the relationship.
13. Draw a scatter diagram of the price of gasoline and the quantity of gasoline
re*ned. Describe the relationship.
Figure A1.13 shows the scatter diagram between the price of a gallon of gasoline
© 2016 Pearson Education, Inc.
A B C D E
8A P P E N D I X 1
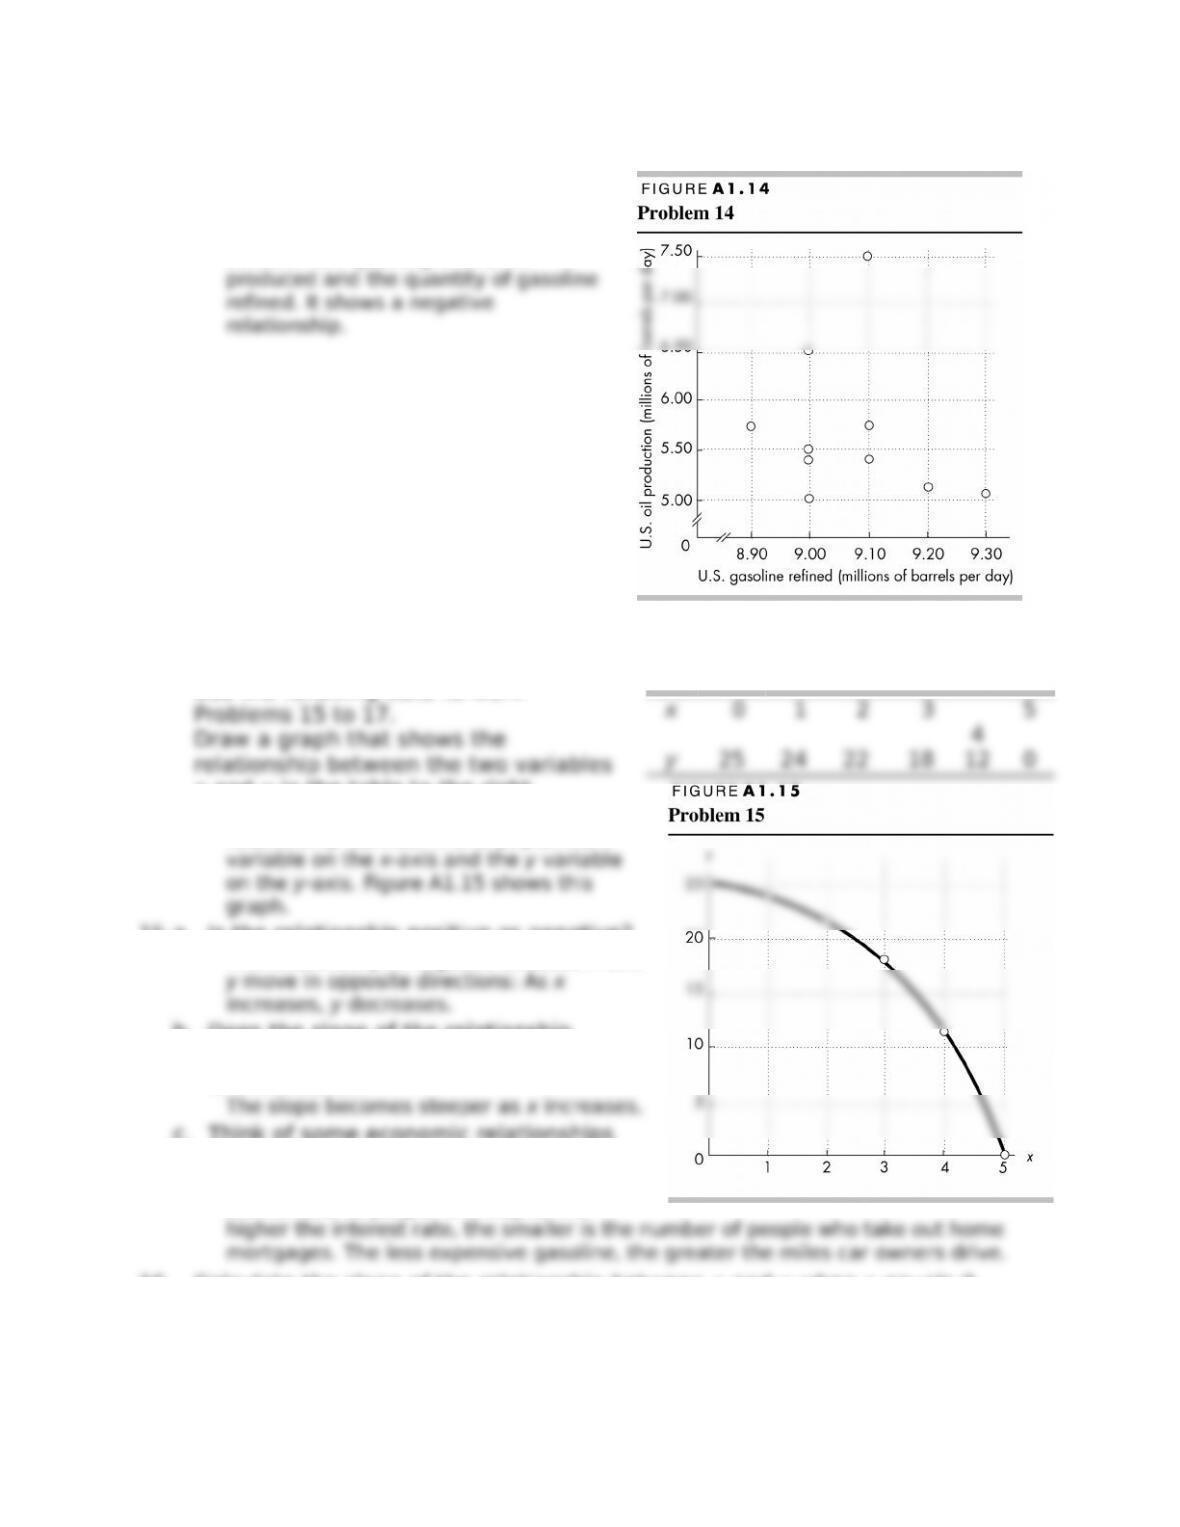
14. Draw a scatter diagram of the quantity of U.S. oil produced and the quantity
of gasoline re*ned. Describe the
relationship.
Figure A1.14 shows the scatter diagram
between the quantity of U.S. oil
Use the following data to work
relationship between the two variables
x and y in the table to the right.
To make a graph that shows the
relationship between x and y, plot the x
15.a. Is the relationship positive or negative?
The relationship is negative because x and
b. Does the slope of the relationship
become steeper or :atter as the value
of x increases?
c. Think of some economic relationships
that might be similar to this one.
The less expensive a good, the greater is
the number of people who buy it. The
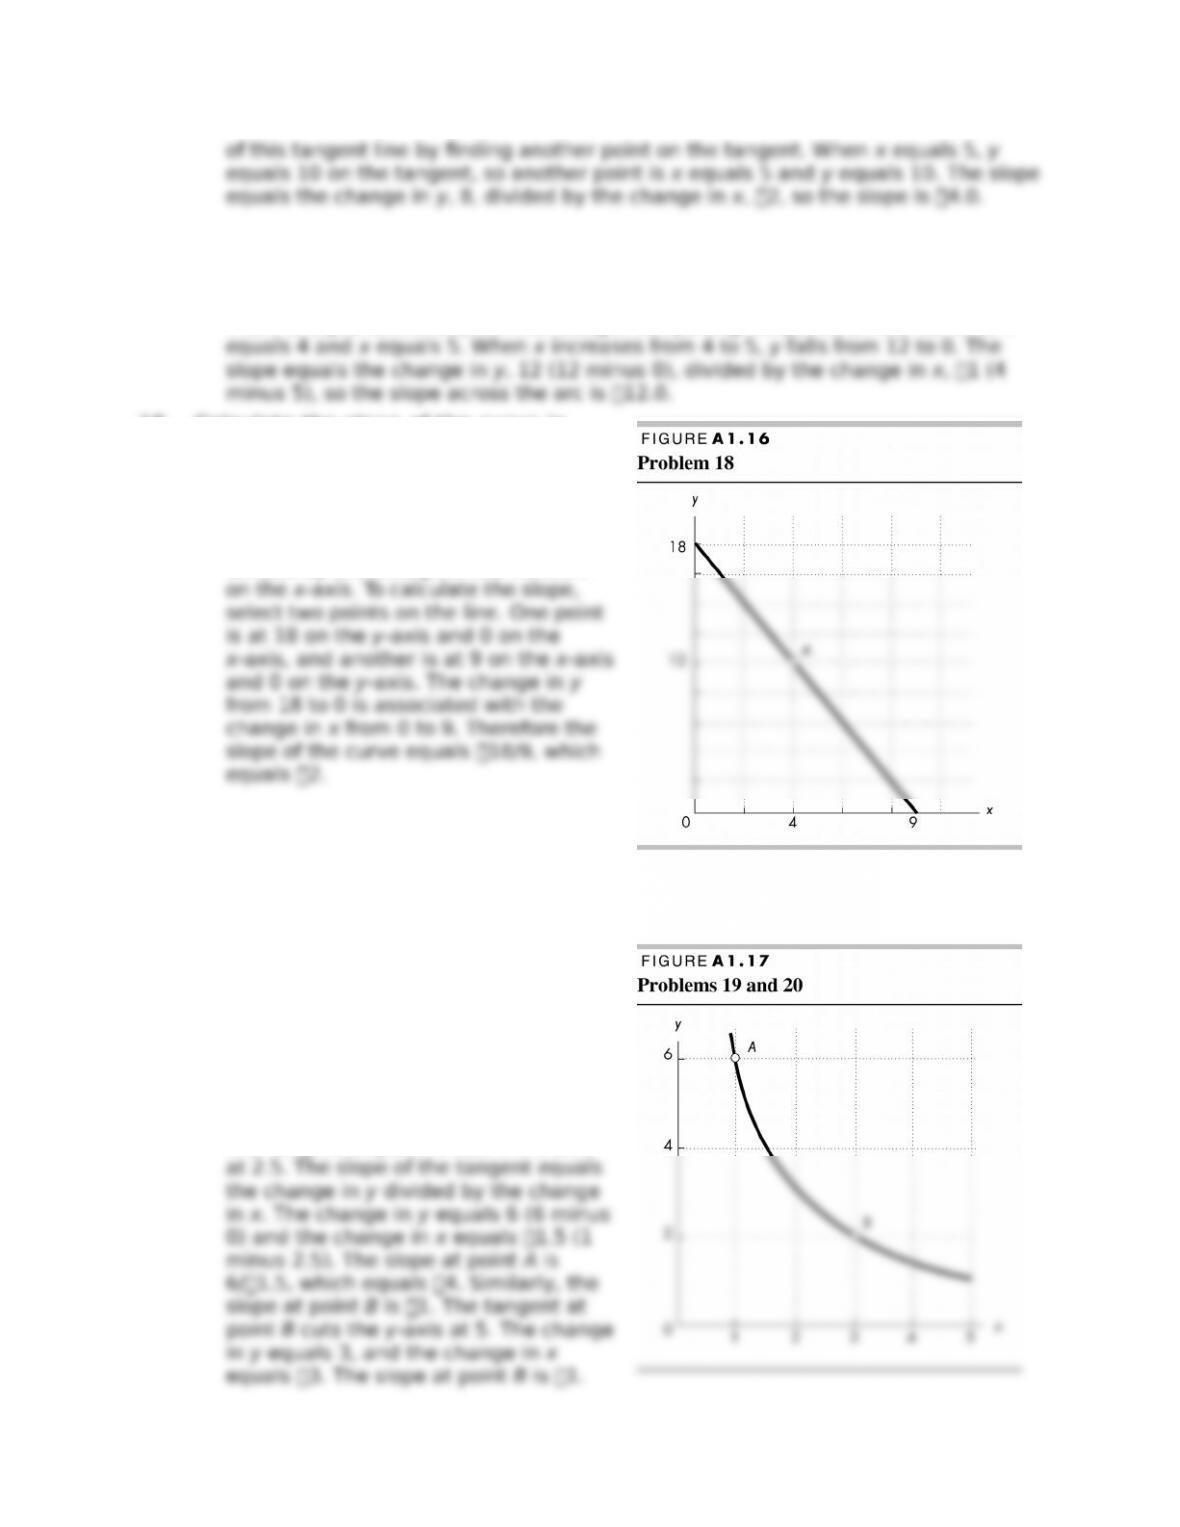
16. Calculate the slope of the relationship between x and y when x equals 3.
The slope equals 4.0. The slope of the curve at the point where x is 3 is equal to
the slope of the tangent to the curve at that point. Plot the relationship and then
draw the tangent line at the point where x is 3 and y is 18. Now calculate the slope
© 2016 Pearson Education, Inc.
9A P P E N D I X 1
17. Calculate the slope of the relationship across the arc as x increases from 4 to
5.
The slope is –12. The slope of the relationship across the arc when x increases from
4 to 5 is equal to the slope of the straight line joining the points on the curve at x
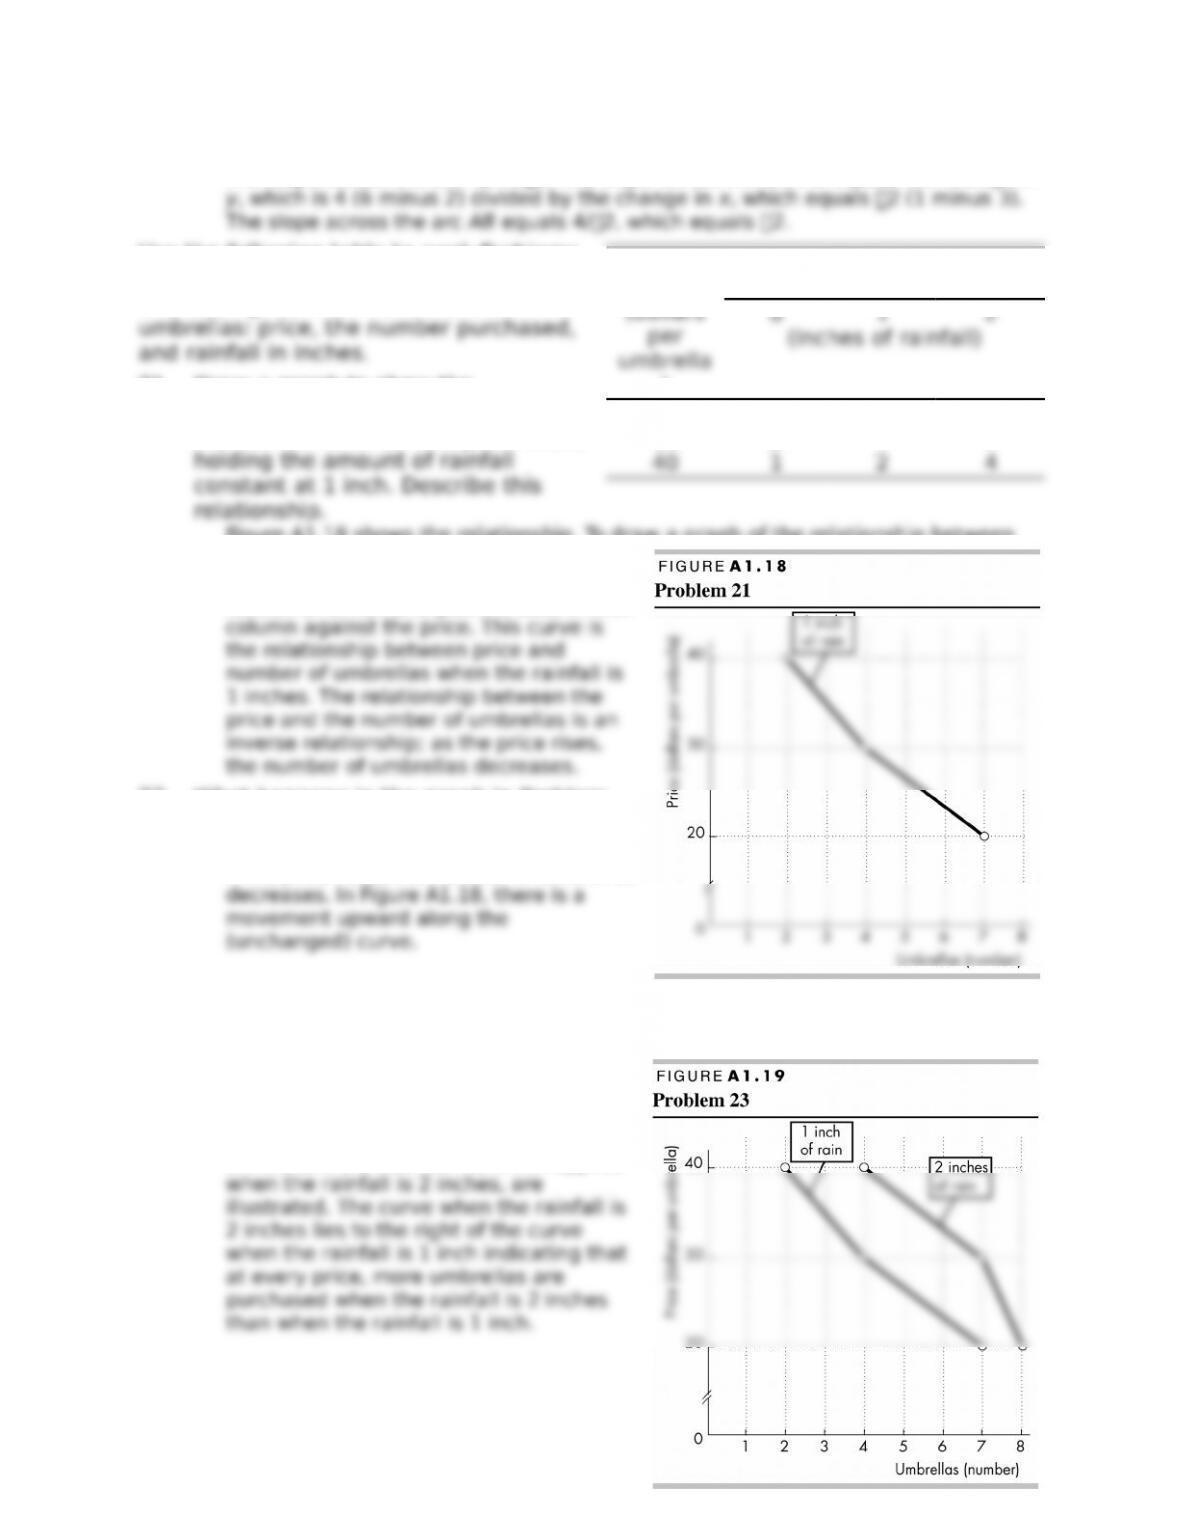
18. Calculate the slope of the curve in
Figure A1.16 at point A.
The slope is 2. The curve is a straight
line, so its slope is the same at all
points on the curve. Slope equals the
change in the variable on the y-axis
divided by the change in the variable
Use Figure A1.17to work Problems 19 and 20.
19. Calculate the slope at point A and at
point B.
The slope at point A is 4, and the slope
at point B is 1. To calculate the slope
at a point on a curved line, draw the
tangent to the line at the point. Then
*nd a second point on the tangent and
calculate the slope of the tangent.
The tangent at point A cuts the x-axis
© 2016 Pearson Education, Inc.
G R A P H S I N E C O N O M I C S 1 0
20. Calculate the slope across the arc AB.
The slope across the arc AB is 2. The slope across the arc AB equals the change in
Use the following table to work Problems
21 to 23.
The table gives information about
21. Draw a graph to show the
relationship between the price and
the number of umbrellas purchased,
Figure A1.18 shows the relationship. To draw a graph of the relationship between
the price and the number of umbrellas
when the rainfall equals 1 inch, keep the
rainfall at 1 inch and plot the data in that
22. What happens in the graph in Problem
21 if the price rises and rainfall is
constant?
If the price rises, the number of umbrellas
23. What happens in the graph in Problem 21 if the rainfall increases from 1 inch
to 2 inches?
As shown in Figure A1.19, the curve shifts
rightward. In that *gure, both the initial
curve, which applies when the rainfall is
1 inch, and the new curve, which applies
© 2016 Pearson Education, Inc.
Price
(dollars
umbrella
)
Umbrellas
(numbers per day)
0 1 2
20 4 7 8
30 2 4 7
1 1 A P P E N D I X 1
© 2016 Pearson Education, Inc.
G R A P H S I N E C O N O M I C S 1 2