W H AT I S E C O N O M I C S ? 9
A n s w e r s t o t h e R e v i e w Q u i z
Page 28
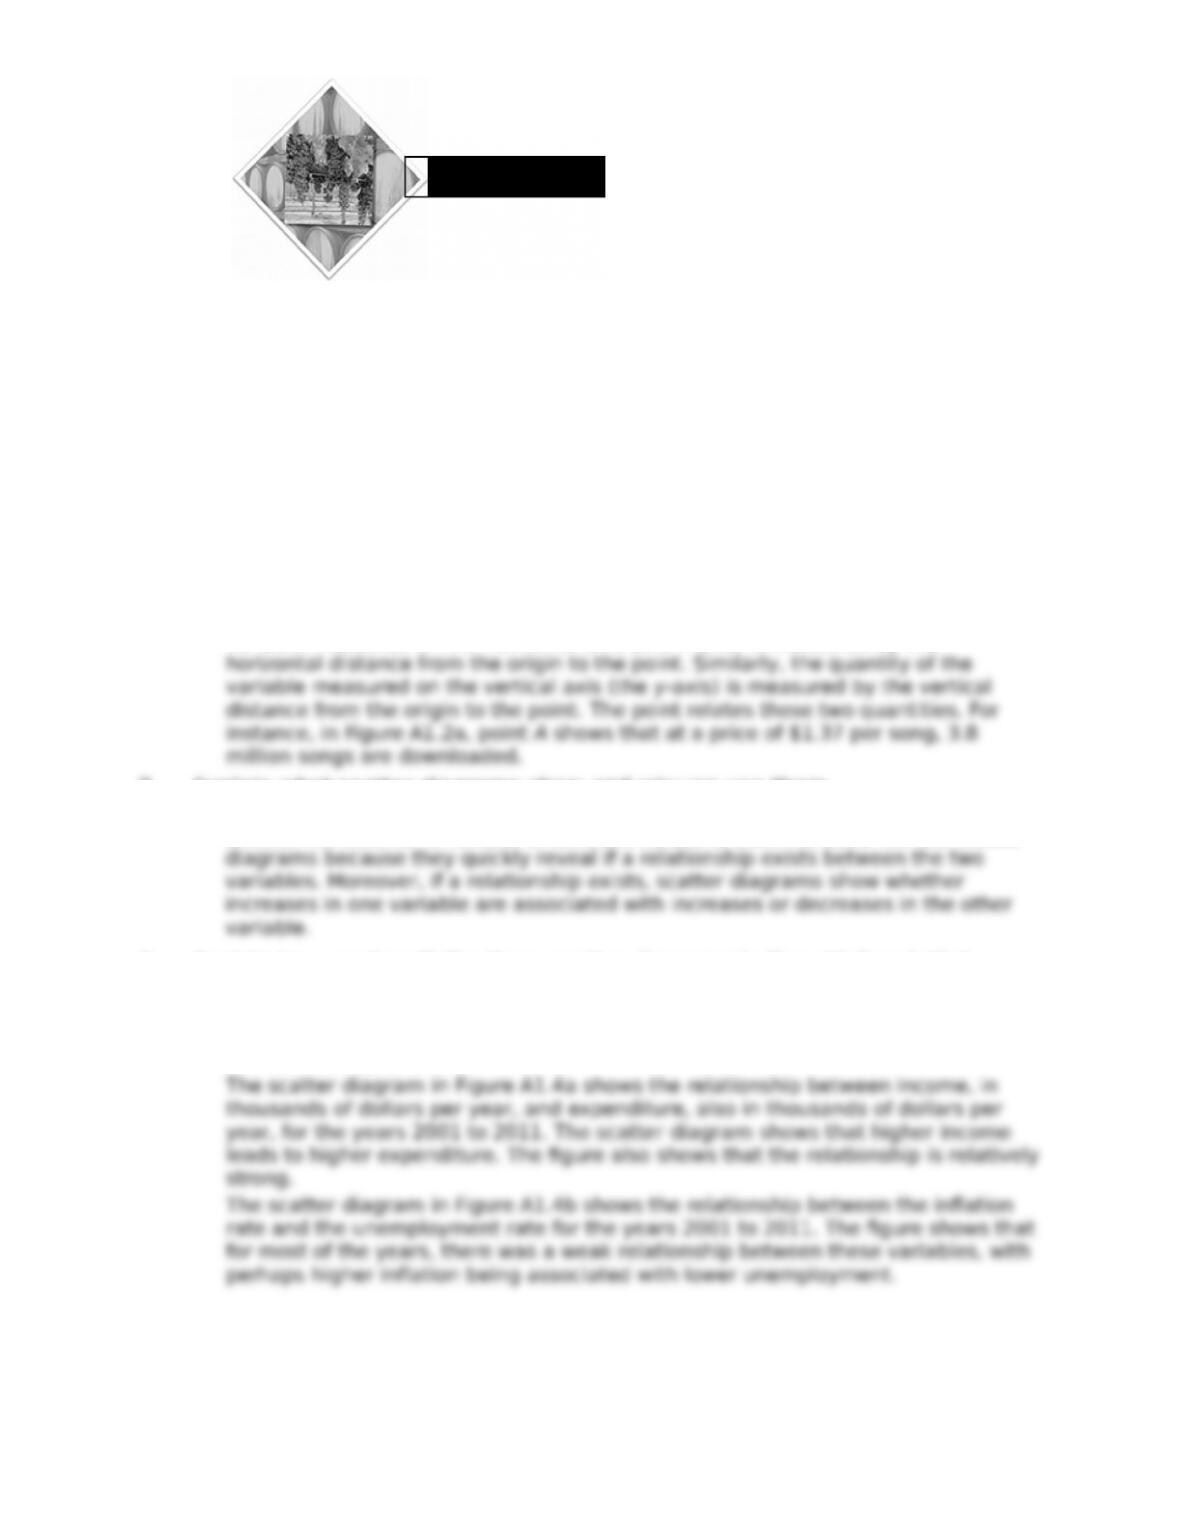
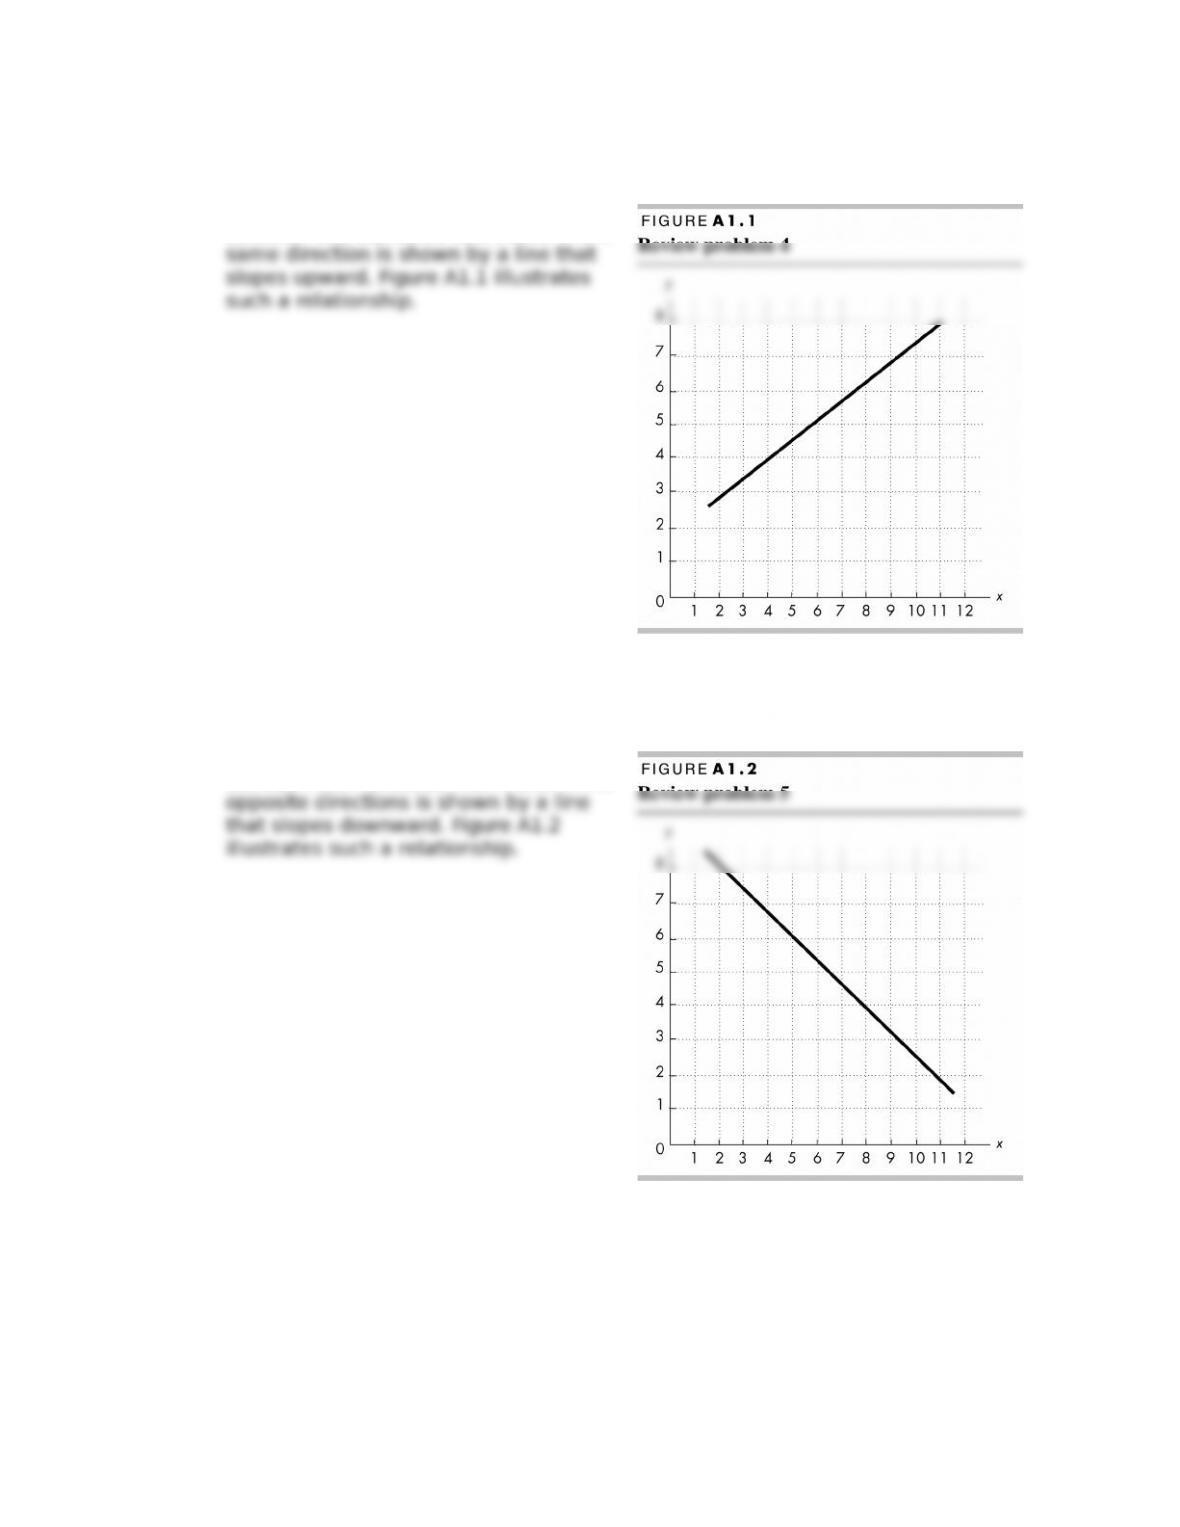
1. Explain how we “read” the three graphs in Figs. A1.1 and A1.2.
The points in the graphs relate the quantity of the variable measured on the one
axis to the quantity of the variable measured on the other axis. The quantity of the
variable measured on the horizontal axis (the x-axis) is measured by the
2. Explain what scatter diagrams show and why we use them.
Scatter diagrams plot the value of one economic variable against the value of
another variable for a number of di4erent values of each variable. We use scatter
3. Explain how we “read” the three scatter diagrams in Figs. A1.3 and A1.4.
The scatter diagram in Figure A1.3 shows the relationship between box o7ce ticket
sales and DVDs sold for 9 popular movies. The ;gure shows that higher box o7ce
sales are associated with a higher number of DVDs sold. But the ;gure shows that
the relationship is weak.
1 GRAPHS IN
ECONOMICS
A p p e n d i x
9
4. Draw a graph to show the relationship between two variables that move in
the same direction.
A graph that shows the relationship
between two variables that move in the
5. Draw a graph to show the relationship between two variables that move in
opposite directions.
A graph that shows the relationship
between two variables that move in the
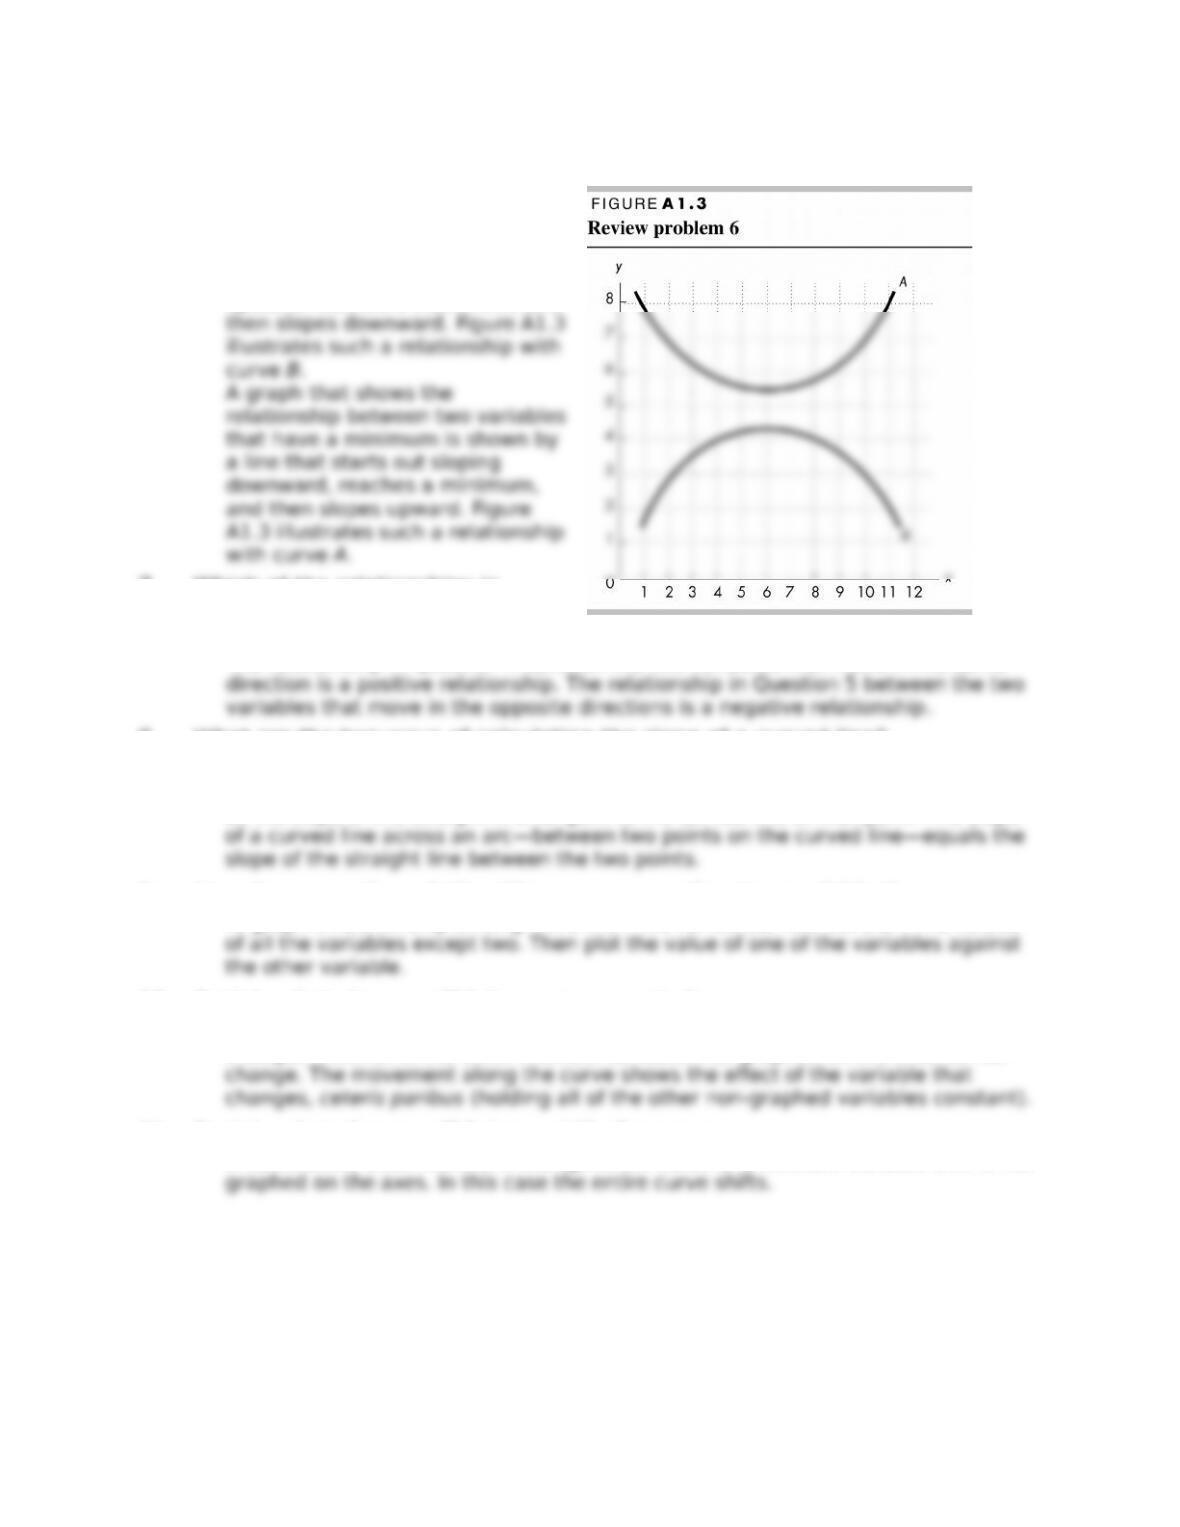
6. Draw a graph of two variables whose relationship shows (i) a maximum and
(ii) a minimum.
A graph that shows the
relationship between two variables
that have a maximum is shown by
a line that starts out sloping
upward, reaches a maximum, and
7. Which of the relationships in
Questions 4 and 5 is a positive
relationship and which is a negative relationship?
The relationship in Question 4 between the two variables that move in the same
8. What are the two ways of calculating the slope of a curved line?
To calculate the slope of a curved line we can calculate the slope at a
point or across an arc. The slope of a curved line at a point on the line is de;ned
as the slope of the straight line tangent to the curved line at that point. The slope
9. How do we graph a relationship among more than two variables?
To graph a relationship among more than two variables, hold constant the values
10. Explain what change will bring a movement along a curve.
A movement along a curve occurs when the value of a variable on one of the axes
changes while all of the other relevant variables not graphed on the axes do not
11. Explain what change will bring a shift of a curve.
A curve shifts when there is a change in the value of a relevant variable that is not
A n s w e r s t o t h e S t u d y P l a n P r o b l e m s a n d
A p p l i c a t i o n s
Use the spreadsheet to work
Problems 1 to 3. The spreadsheet
provides data on the U.S. economy:
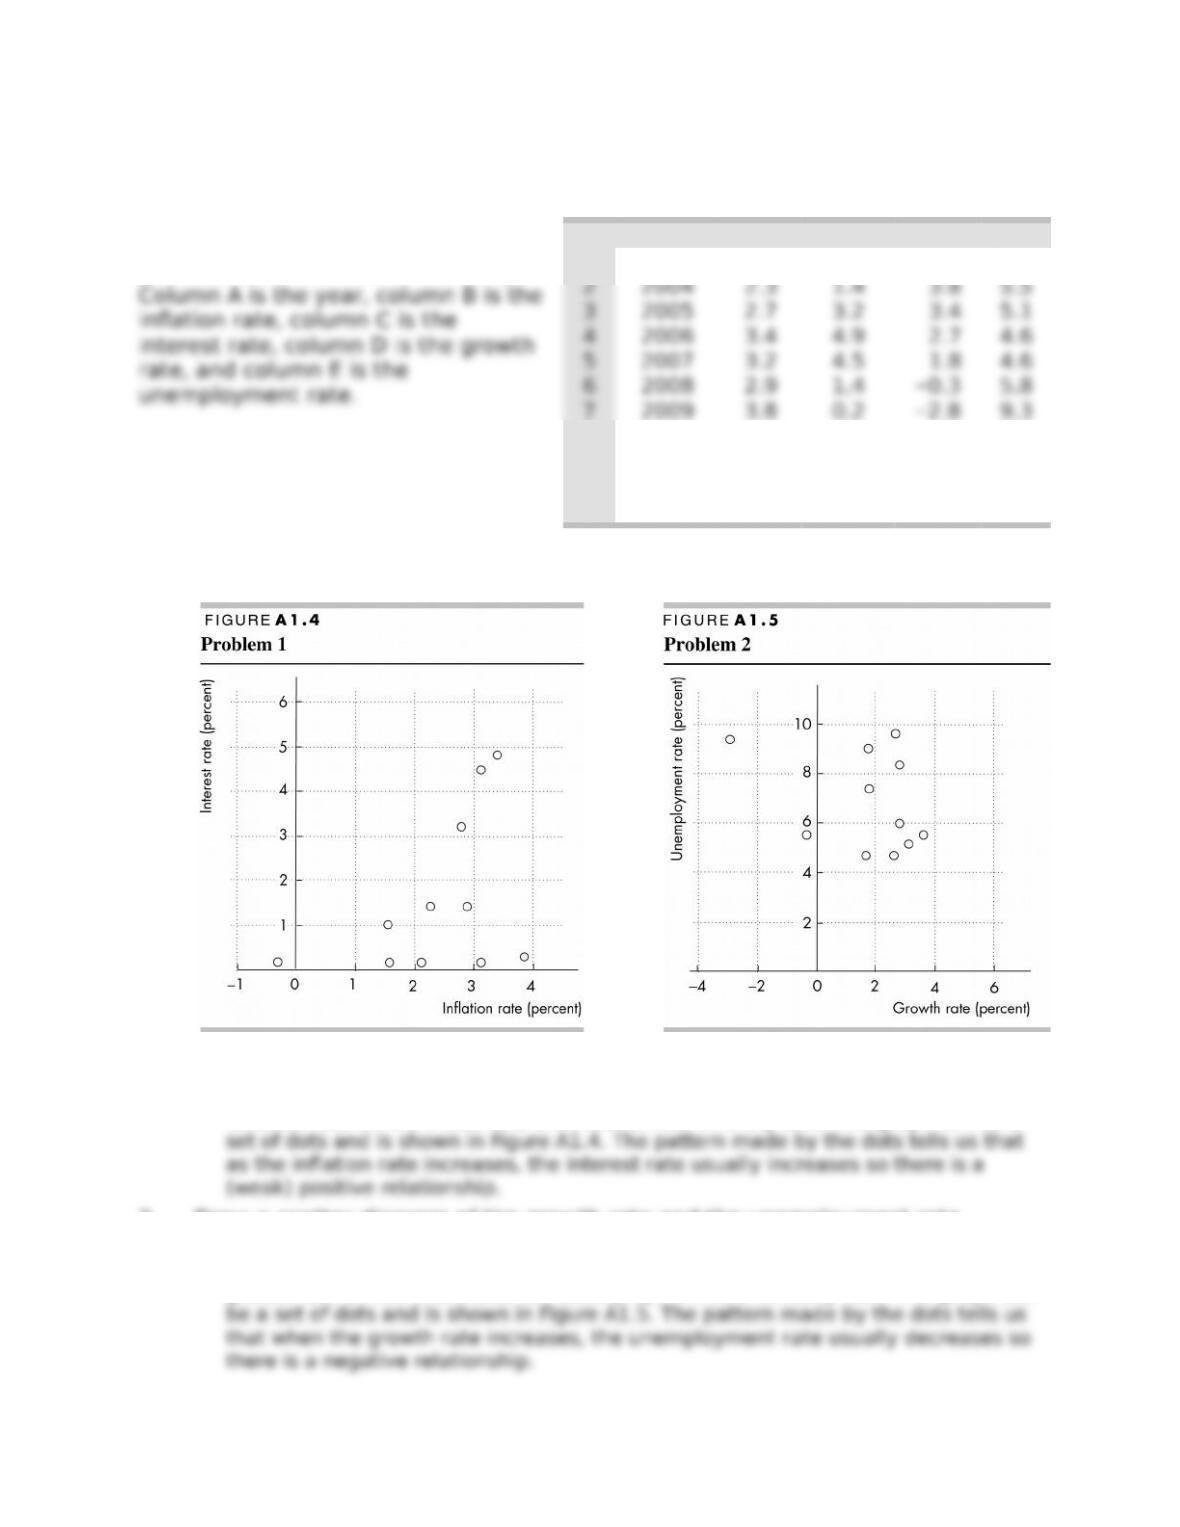
1. Draw a scatter diagram of the in>ation rate and the interest rate. Describe
the relationship.
To make a scatter diagram of the in>ation rate and the interest rate, plot the
in>ation rate on the x-axis and the interest rate on the y-axis. The graph will be a
2. Draw a scatter diagram of the growth rate and the unemployment rate.
Describe the relationship.
To make a scatter diagram of the growth rate and the unemployment rate, plot the
growth rate on the x-axis and the unemployment rate on the y-axis. The graph will
A B C D E
1 2003 1.6 1.0 2.8 6.0
2 2004 2.3 1.4 3.8 5.5
7 2009 3.8 0.2 −2.8 9.3
8 2010 −0.3 0.1 2.5 9.6
9 2011 1.6 0.1 1.8 8.9
10 2012 3,1 0.1 2.8 8.1
11 2013 2.1 0.1 1.9 7.4
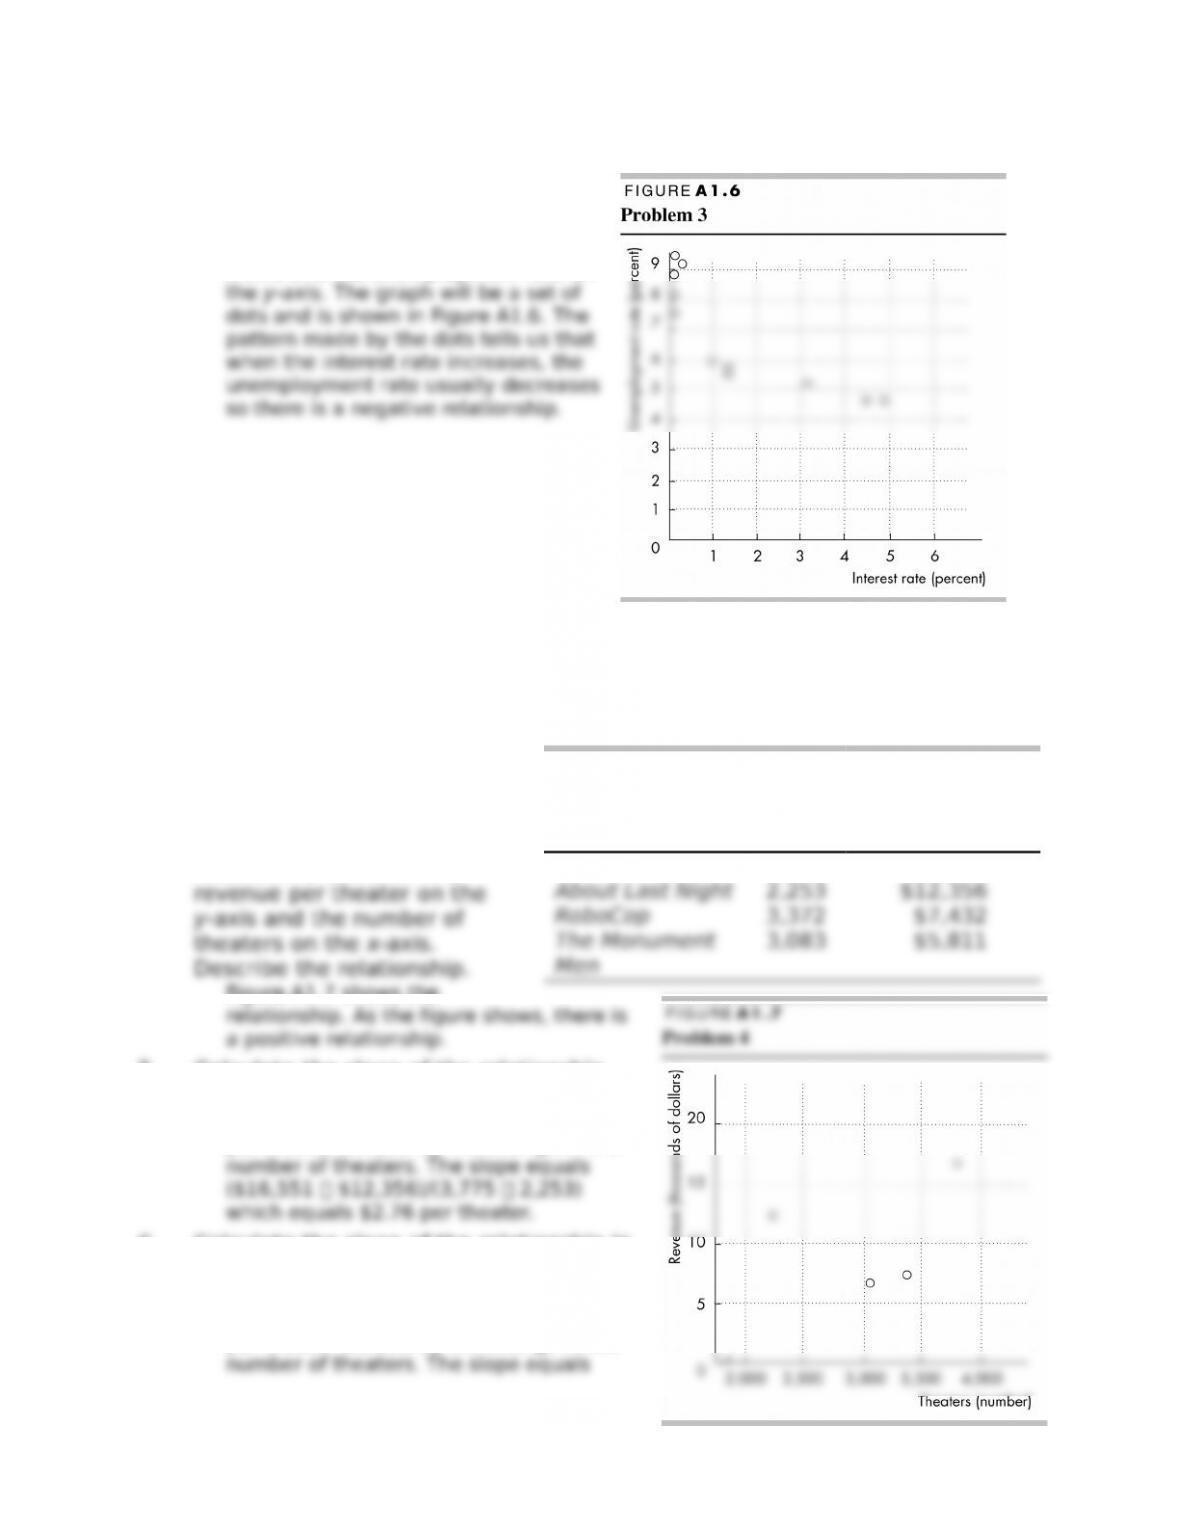
3. Draw a scatter diagram of the interest rate and the unemployment rate.
Describe the relationship.
To make a scatter diagram of the
interest rate and the unemployment
rate, plot the interest rate on the
x-axis and the unemployment rate on
Use the following news clip to work Problems 4 to 6.
Lego Shatters More Records:
Source: Boxo7cemojo.com,
Data for weekend of February
14-17, 2014
4. Draw a graph of the
relationship between the
Figure A1.7 shows the
5. Calculate the slope of the relationship
between 3,775 and 2,253 theaters.
The slope equals the change in revenue
per theater divided by the change in the
6. Calculate the slope of the relationship in
Problem 4 between 2,253 and 3,372
theaters.
The slope equals the change in revenue
per theater divided by the change in the
Movie
Theate
rs
(numb
er)
Revenue
(dollars per
theater)
The LEGO Movie 3,775 $16,551
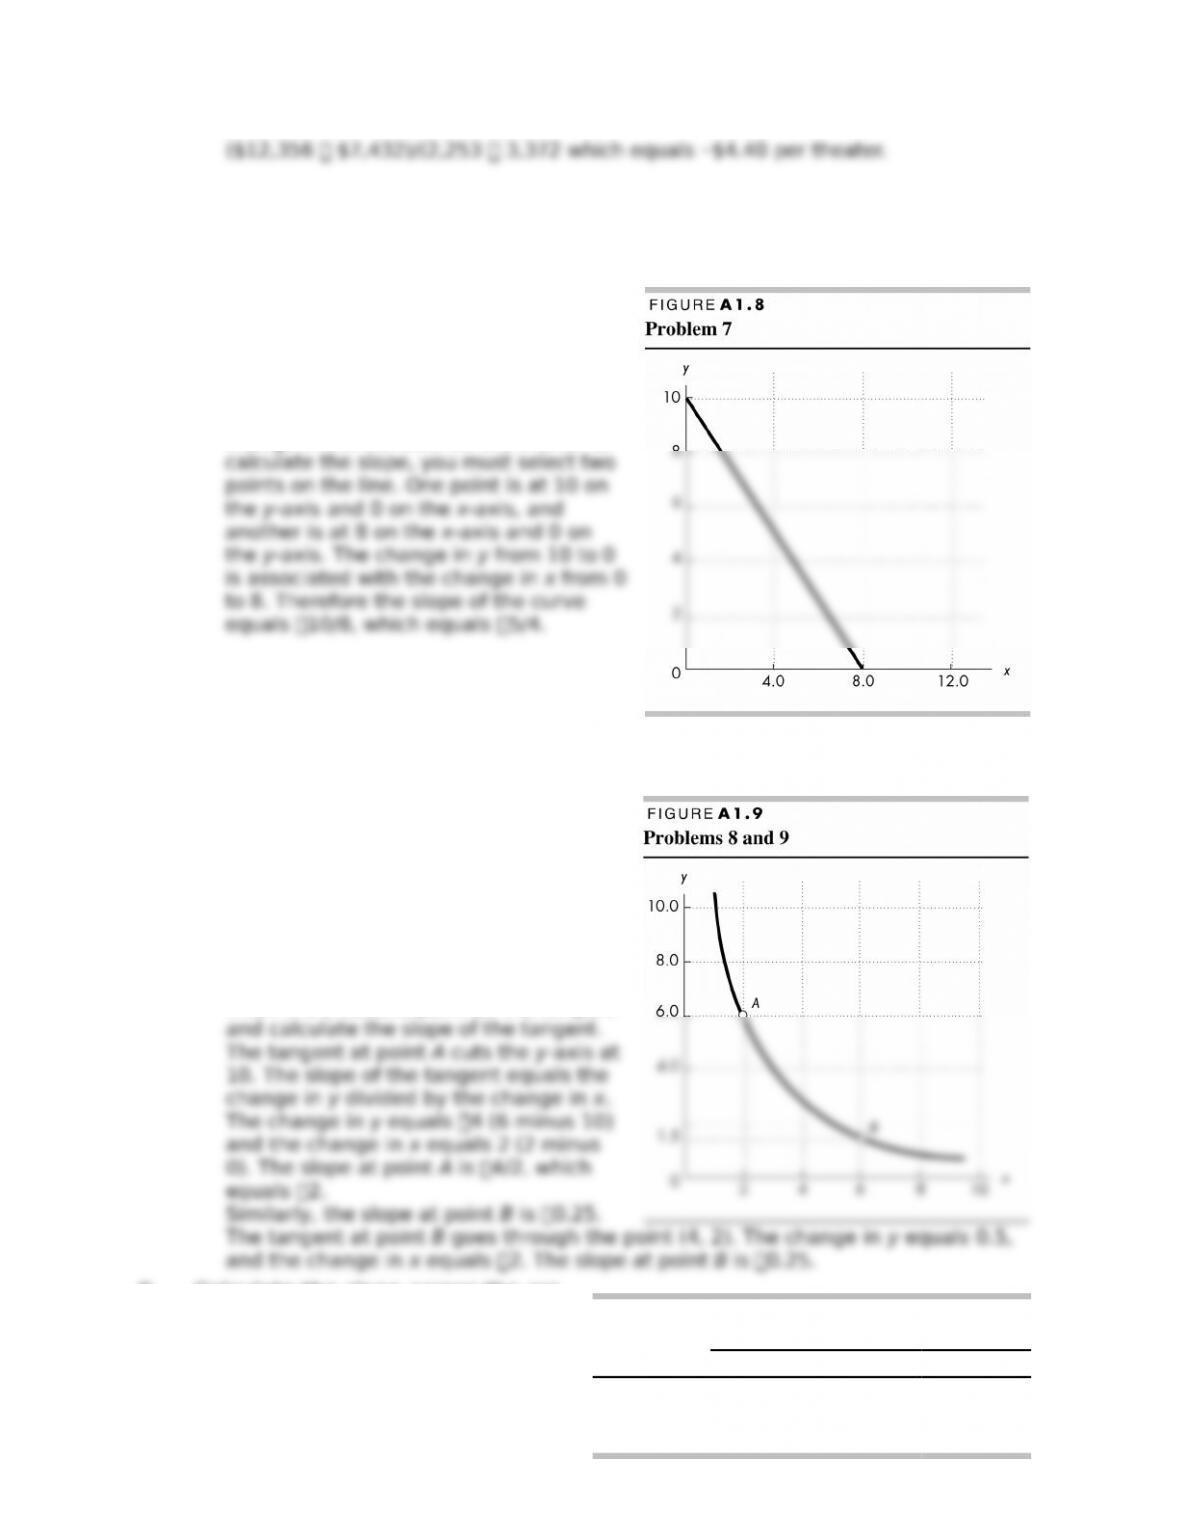
7. Calculate the slope of the relationship
shown in Figure A1.8.
The slope is 5/4. The curve is a straight
line, so its slope is the same at all points
on the curve. Slope equals the change in
the variable on the y-axis divided by the
change in the variable on the x-axis. To
Use the relationship shown in Figure A1.9 to
work Problems 8 and 9.
8. Calculate the slope of the relationship
at point A and at point B.
The slope at point A is 2, and the slope
at point B is 0.25. To calculate the slope
at a point on a curved line, draw the
tangent to the curved line at the point.
Then ;nd a second point on the tangent
9. Calculate the slope across the arc
AB.
The slope across the arc AB is
1.125. The slope across an arc AB
Price
(dollars
per ride)
Balloon rides
(number per day)
50F 70F 90F
5 32 40 50
10 27 32 40
15 18 27 32
Use the table to work Problems 10 and 11
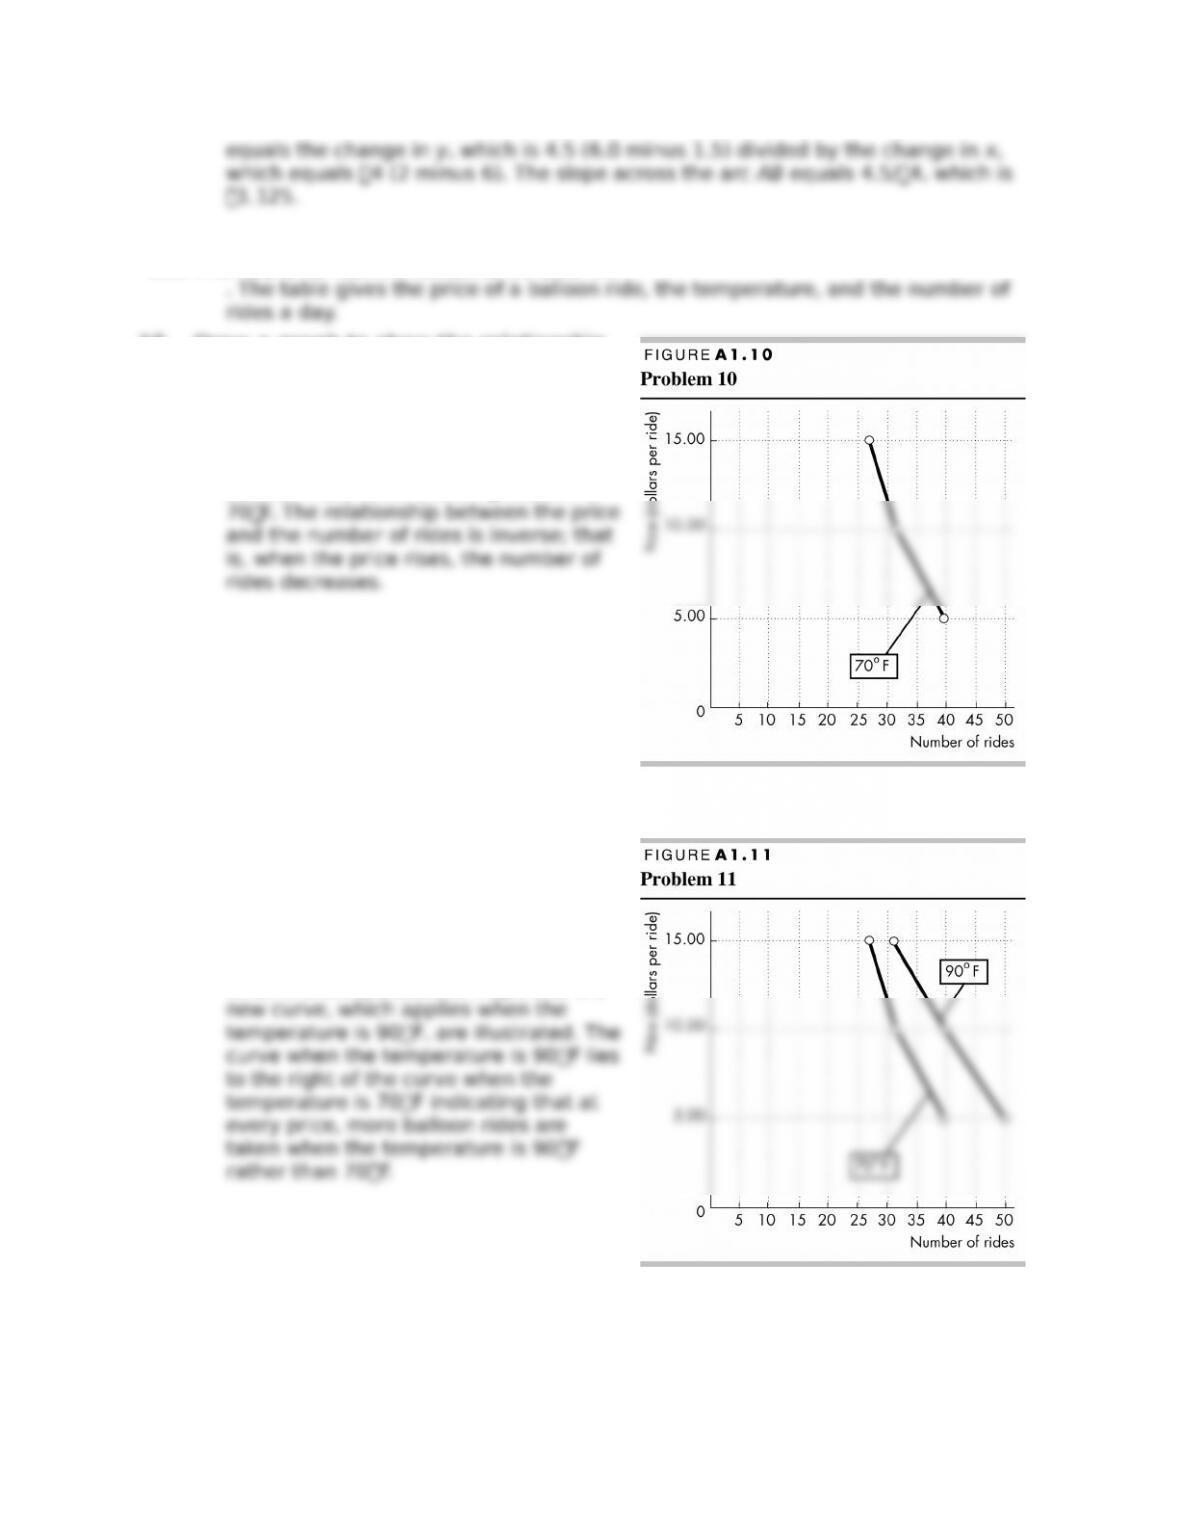
10. Draw a graph to show the relationship
between the price and the number of
rides, when temperature is 70°F.
Describe this relationship.
Figure A1.10 shows the relationship
between the price and the number of
balloon rides when the temperature is
11. What happens in the graph in Problem
10 if the temperature rises to 90°F?
If the temperature rises to 90F, the
curve shifts rightward. This shift is
illustrated in Figure A1.11. In that ;gure,
both the initial curve, which applies
when the temperature is 70F, and the