
Chapter 6
ANSWERS TO QUESTIONS
1. If junk bonds are “junk,” then why do investors buy them?
2. Which should have the higher risk premium on its interest rates, a corporate bond with a
3. Why do U.S. Treasury bills have lower interest rates than large-denomination negotiable
bank CDs?
4. In the fall of 2008, AIG, the largest insurance company in the world at the time, was at risk
of defaulting due to the severity of the global financial crisis. As a result, the U.S.
government stepped in to support AIG with large capital injections and an ownership stake.
How would this affect, if at all, the yield and risk premium on AIG corporate debt?
The risk of default would significantly decrease demand for AIG corporate debt, resulting in
5. Risk premiums on corporate bonds are usually anticyclical; that is, they decrease during
business cycle expansions and increase during recessions. Why is this so?

6. “If bonds of different maturities are close substitutes, their interest rates are more likely to
move together.” Is this statement true, false, or uncertain? Explain your answer.
7. The U.S. Treasury offers some of its debt as Treasury Inflation Protected Securities, or TIPS,
in which the price of bonds is adjusted for inflation over the life of the debt instrument. TIPS
bonds are traded on a much smaller scale than nominal U.S. Treasury bonds of equivalent
maturity. What can you conclude about the liquidity premiums of TIPS versus nominal U.S.
bonds?
8. Predict what will happen to interest rates on a corporation’s bonds if the federal government
guarantees today that it will pay creditors if the corporation goes bankrupt in the future.
What will happen to the interest rates on Treasury securities?
9. Predict what will happen to the risk premiums on corporate bonds if brokerage commissions
are lowered in the corporate bond market.
10. During 2008, the difference in yield (the yield spread) between three-month AA-rated
financial commercial paper and three-month AA-rated nonfinancial commercial paper
steadily increased from its usual level of close to zero, spiking to over a full percentage point
at its peak in October 2008. What explains this sudden increase?

11. If the income tax exemption on municipal bonds were abolished, what would happen to the
interest rates on these bonds? What effect would the change have on interest rates on U.S.
Treasury securities?
12. Prior to 2008, mortgage lenders required a house inspection to assess a home’s value, and
often used the same one or two inspection companies in the same geographical market.
Following the collapse of the housing market in 2008, mortgage lenders required a house
in the global financial crisis?
Credit rating agencies had a conflict of interest that was said to contribute to the crisis in that
the rating agencies had an incentive to provide overly optimistic ratings to clients whom they
13. “According to the expectations theory of the term structure, it is better to invest in one-year
bonds, reinvested over two years, than to invest in a two-year bond if interest rates on one-
uncertain?
1,
tt
that one-period bond rates are expected to be the same across both periods. With a $1
14. If bond investors decide that 30-year bonds are no longer as desirable an investment as they
were previously, predict what will happen to the yield curve, assuming (a) the expectations
theory of the term structure holds; and (b) the segmented markets theory of the term structure
holds.
15. Suppose the interest rates on one-, five-, and ten-year U.S. Treasury bonds are currently 3%,
6%, and 6%, respectively. Investor A chooses to hold only one-year bonds, and Investor B is
indifferent with regard to holding five- and ten-year bonds. How can you explain the
behavior of Investors A and B?
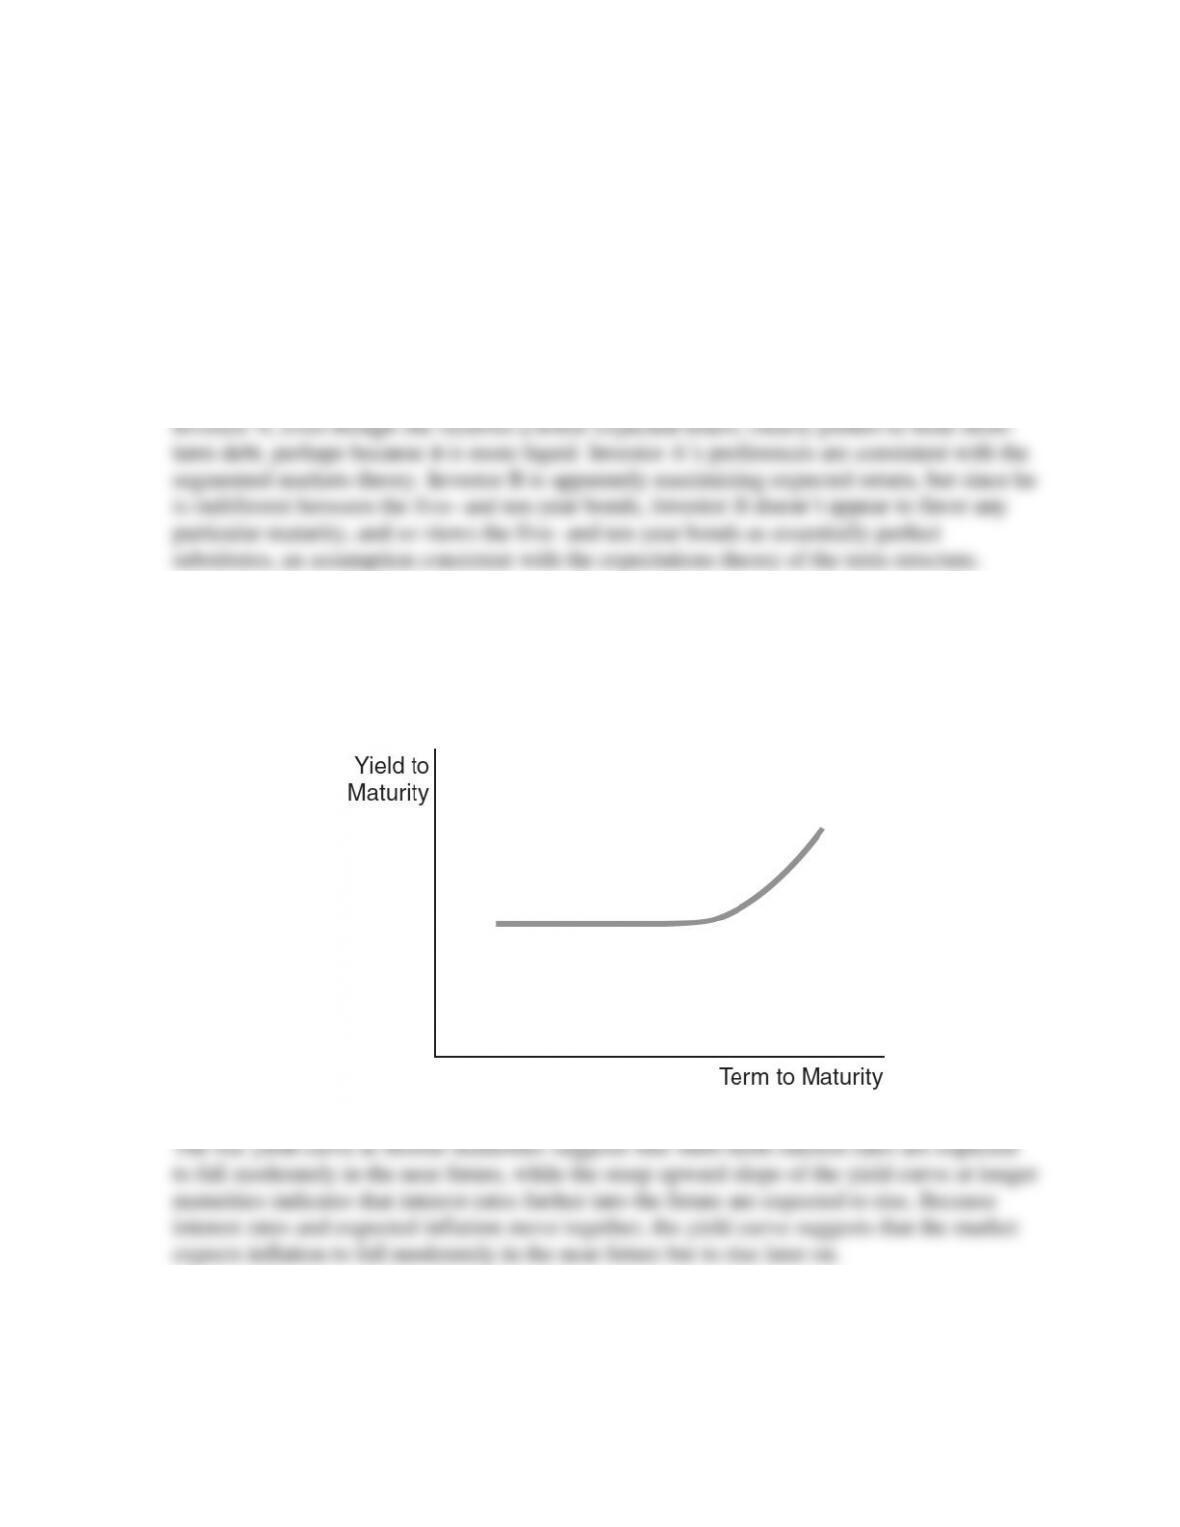
16. If a yield curve looks like the one shown in the figure below, what is the market predicting
about the movement of future short-term interest rates? What might the yield curve indicate
about the market’s predictions for the inflation rate in the future?
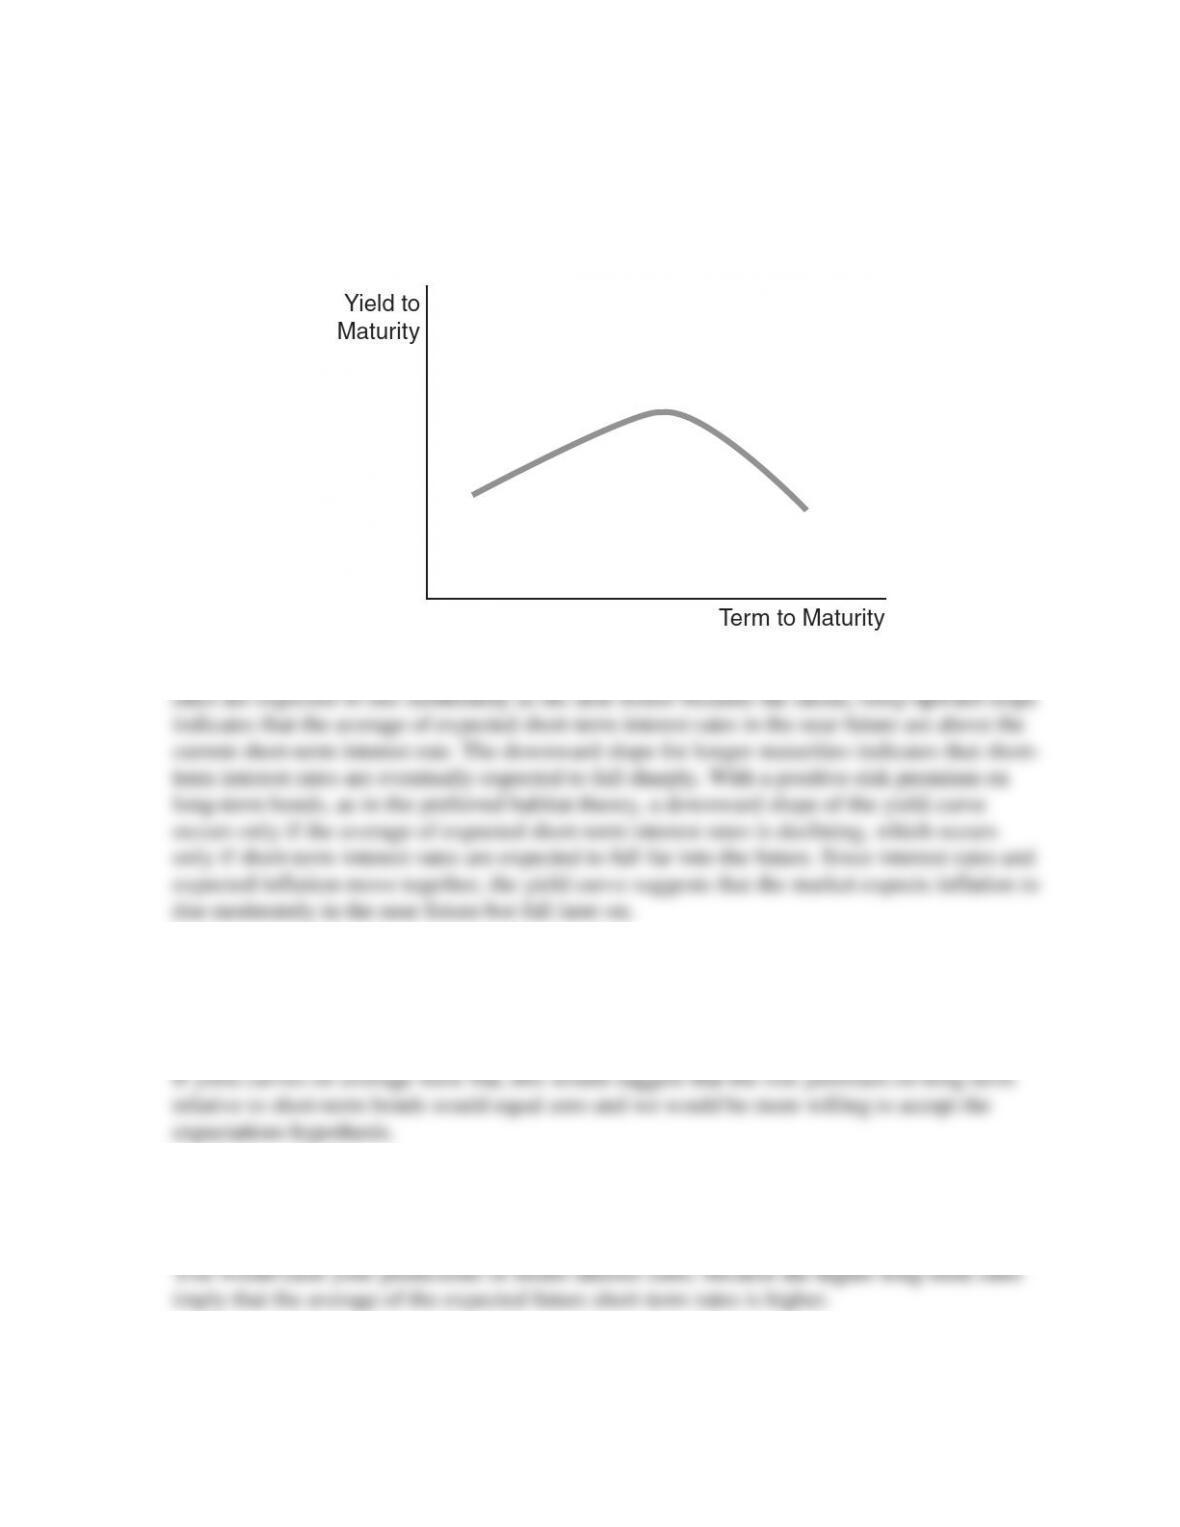
17. If a yield curve looks like the one shown in the figure below, what is the market predicting
about the movement of future short-term interest rates? What might the yield curve indicate
about the market’s predictions for the inflation rate in the future?
The steep upward-sloping yield curve at shorter maturities suggests that short-term interest
18. If yield curves, on average, were flat, what would this say about the liquidity (term)
premiums in the term structure? Would you be more or less willing to accept the expectations
theory?
19. If the yield curve suddenly became steeper, how would you revise your predictions of interest
rates in the future?

20. If expectations of future short-term interest rates suddenly fell, what would happen to the
slope of the yield curve?
21. Following a policy meeting on March 19, 2009, the Federal Reserve made an announcement
that it would purchase up to $300 billion of longer-term Treasury securities over the following
six months. What effect might this policy have on the yield curve?
ANSWERS TO APPLIED PROBLEMS
22. In 2010 and 2011, the government of Greece risked defaulting on its debt due to a severe
budget crisis. Using bond market graphs, compare the effects on the risk premium between
23. Assuming the expectations theory is the correct theory of the term structure, calculate the
interest rates in the term structure for maturities of one to five years, and plot the resulting
yield curves for the following paths of one-year interest rates over the plot the resulting
yield curves for the following paths of one-year interest rates over the next five years:
a. 5%, 6%, 7%, 6%, 5%
b. 5%, 4%, 3%, 4%, 5%
How would your yield curves change if people preferred shorter-term bonds over longer–
term bonds?
24. Assuming the expectations theory is the correct theory of the term structure, calculate the
interest rates in the term structure for maturities of one to five years, and plot the resulting
yield curves for the following paths of one-year interest rates over the next five years:
a. 5%, 6%, 7%, 6%, 5%
b. 5%, 4%, 3%, 4%, 5%
How would your yield curves change if people preferred shorter-term bonds over longer-
term bonds?
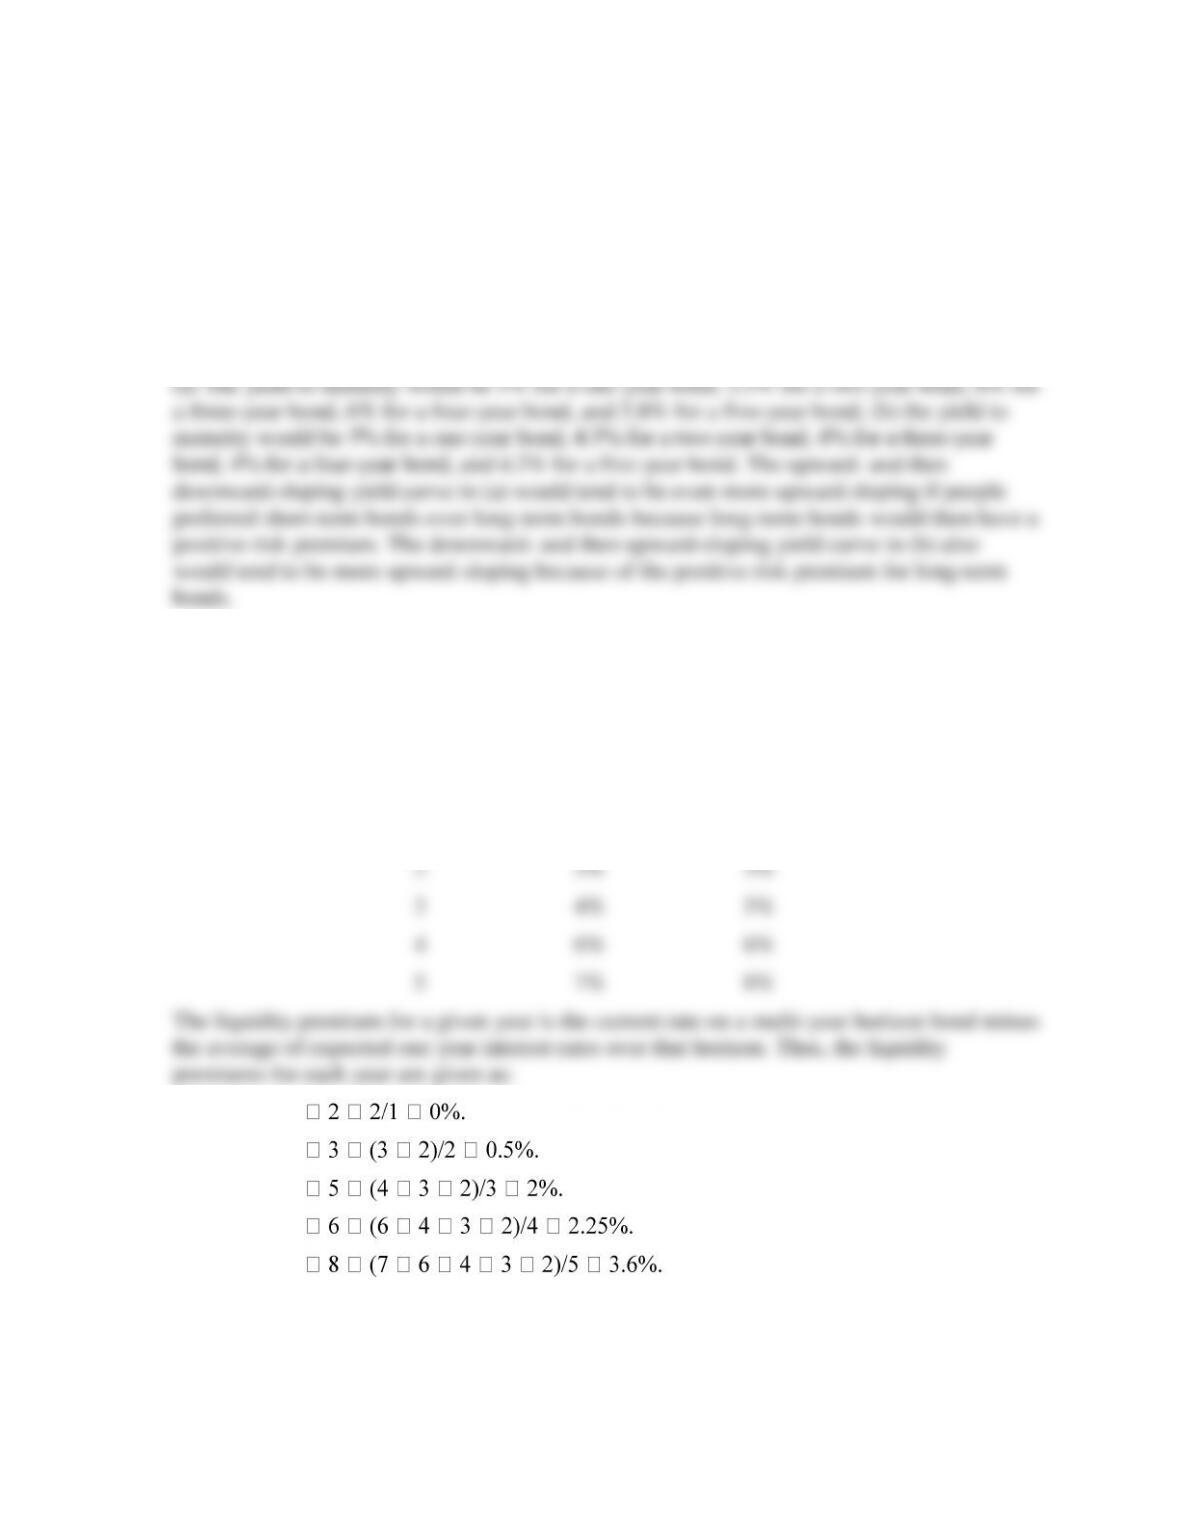
25. The table below shows current and expected future one-year interest rates, as well as current
interest rates on multiyear bonds. Use the table to calculate the liquidity premium for each
multiyear bond.
Year
One-Year
Bond Rate
Multiyear
Bond Rate
1
2%
2%
2
3%
3%
3
4%
5%
4
6%
6%
5
7%
8%
l11
l21
l31
l41
l51

ANSWERS TO DATA ANALYSIS PROBLEMS
1. Go to the St. Louis Federal Reserve FRED database, and find data on Moody’s Aaa
corporate bond yield (AAA) and Moody’s Baa corporate bond yield (BAA). Download the
data into a spreadsheet.
b. Calculate the spread again, for the same month but one year prior, and compare the
result to your answer to part (a). What do your answers say about how the risk premium
has changed over the past year?
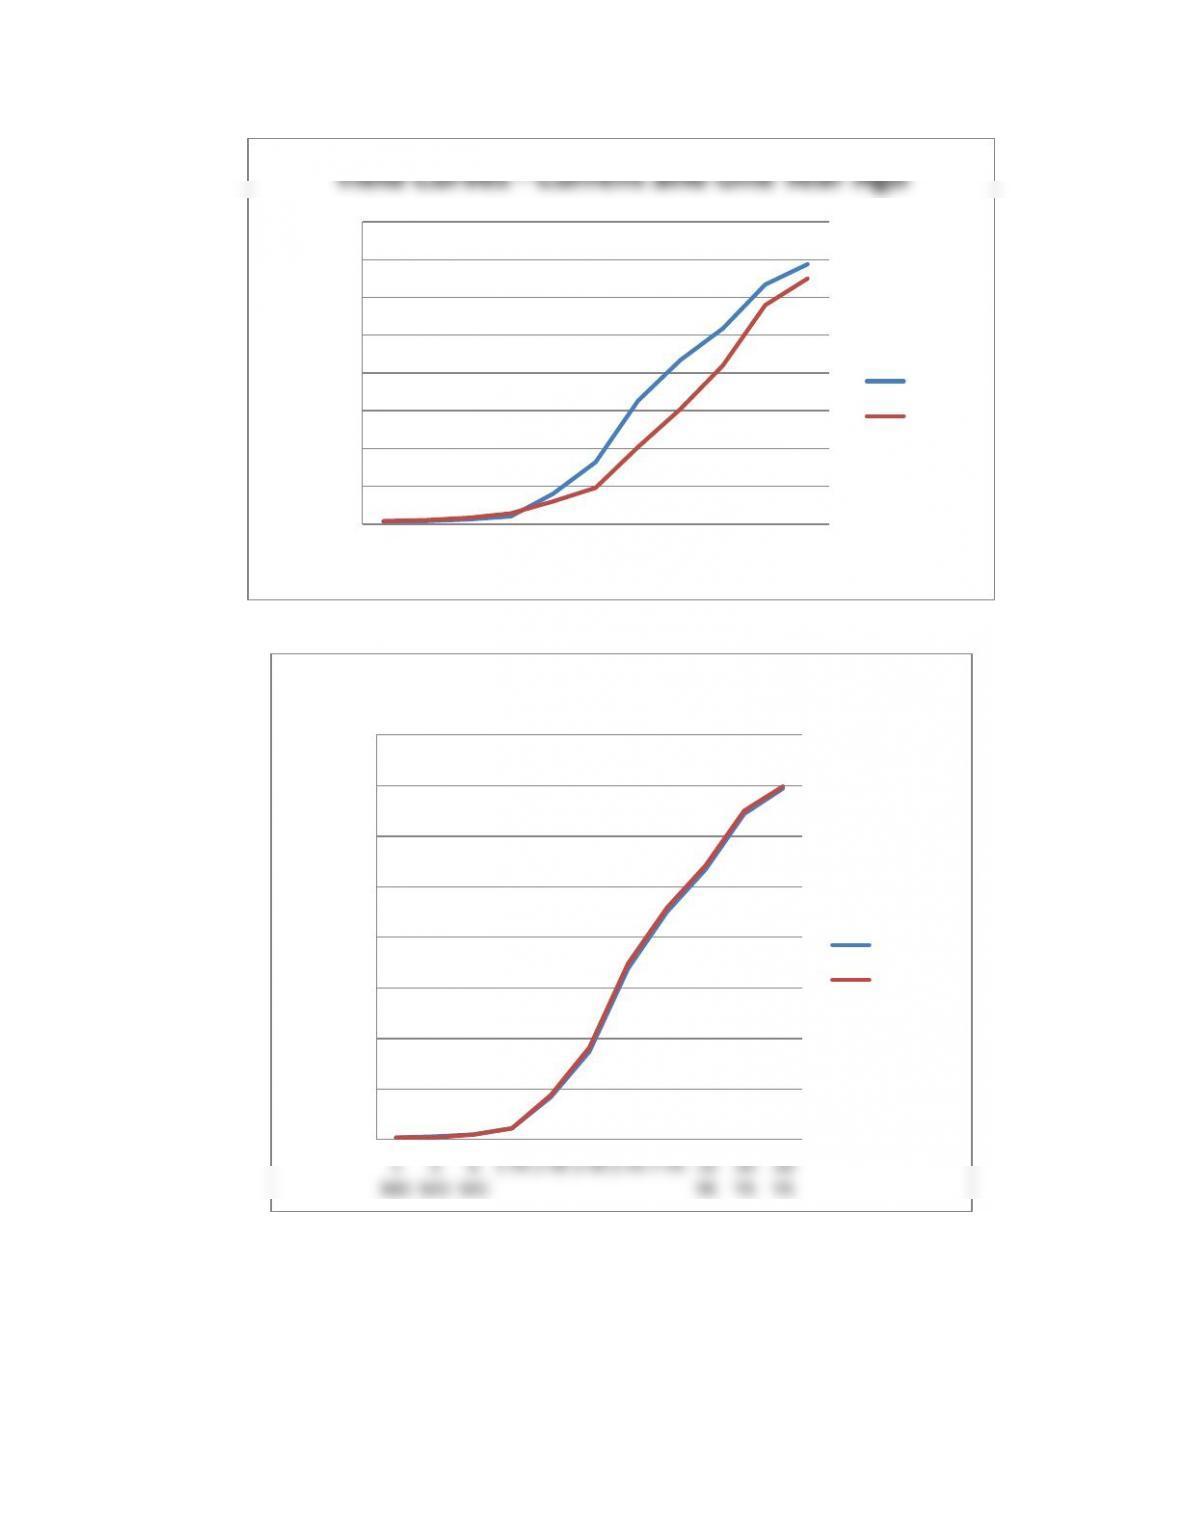
2. Go to the St. Louis Federal Reserve FRED database, and find daily yield data on the
following U.S. treasuries securities: one-month (DGS1MO), three-month (DGS3MO), six-
month (DGS6MO), one-year (DGS1), two-year (DGS2), three-year (DGS3), five-year
(DGS5), seven-year (DGS7), 10-year (DGS10), 20-year (DGS20), and 30-year (DGS30).
Download the last full year of data available into a spreadsheet.
a. Construct a yield curve by creating a line graph for the most recent day of data
available, and for the same day (or as close to the same day as possible) one year prior,
across all the maturities. How do the yield curves compare? What does the changing
slope say about potential changes in economic conditions?
b. Determine the date of the most recent Federal Open Market Committee policy statement.
Construct yield curves for both the day before the policy statement was released and the

day on which the policy statement was released. Was there any significant change in the
yield curve as a result of the policy statement? How might this be explained?
0.00
0.50
1.00
1.50
2.00
2.50
3.00
3.50
4.00
1
MO
3
MO
6
MO
1 YR 2 YR 3 YR 5 YR 7 YR 10
YR
20
YR
30
YR
Yield
Yield Curves – Current and One Year Ago
5-Jun-14
5-Jun-13
0.00
0.50
1.00
1.50
2.00
2.50
3.00
3.50
4.00
1
MO
3
MO
6
MO
1 YR 2 YR 3 YR 5 YR 7 YR 10
YR
20
YR
30
YR
Yield
Yield Curve – Policy Announcement
30-Apr-14
29-Apr-14