Chapter 3
ANSWERS TO QUESTIONS
1. Why is simply counting currency an inadequate measure of money?
2. In prison, cigarettes are sometimes used among inmates as a form of payment. How is it
possible for cigarettes to solve the “double coincidence of wants” problem, even if a
prisoner does not smoke?
1. Three goods are produced in an economy by three individuals:
Good Producer
Apples Orchard Owner
Bananas Banana Grower
Chocolate Chocolatier
If the orchard owner likes only bananas, the banana grower likes only chocolate, and the
chocolatier likes only apples, will any trade between these three persons take place in a
barter economy? How will introducing money into the economy benefit these three
producers?
2. Why did cavemen not need money?
5. Most of the time it is quite difficult to separate the three functions of money. Money performs
its three functions at all times, but sometimes we can stress one in particular. For each of the
following situations, identify which function of money is emphasized.
a. Brooke accepts money in exchange for performing her daily tasks at her office, since she
knows she can use that money to buy goods and services.
society.
b. Tim wants to calculate the relative value of oranges and apples, and therefore checks the
price per pound of each of these goods as quoted in currency units.
c. Maria is currently pregnant. She expects her expenditures to increase in the future and
decides to increase the balance in her savings account.
Maria is contemplating the store-of-value function of money. As a medium of exchange
6. In Brazil, a country that underwent a rapid inflation before 1994, many transactions were
conducted in dollars rather than in reals, the domestic currency. Why?
7. Was money a better store of value in the United States in the 1950s than in the 1970s? Why
or why not? In which period would you have been more willing to hold money?
8. Why have some economists described money during a hyperinflation as a “hot potato” that
is quickly passed from one person to another?
9. Why were people in the United States in the nineteenth century sometimes willing to be paid
by check rather than with gold, even though they knew there was a possibility that the check
might bounce?
10. In ancient Greece, why was gold a more likely candidate for use as money than wine?
candidate for use as money.
11. If you use an online payment system such as PayPal to purchase goods or services on the
Internet, does this affect the M1 money supply, the M2 money supply, both, or neither?
Explain.
12. Rank the following assets from most liquid to least liquid:
a. Checking account deposits
b. Houses
c. Currency
d. Automobiles
e. Savings deposits
f. Common stock
13. Which of the Federal Reserve’s measures of the monetary aggregates—M1 or M2—is
composed of the most liquid assets? Which is the larger measure?
14. It is not unusual to find a business that displays a sign saying “no personal checks, please.”
On the basis of this observation, comment on the relative degree of liquidity of a checking
account versus currency.
15. For each of the following assets, indicate which of the monetary aggregates (M1 and M2)
includes them:
a. Currency
b. Money market mutual funds
16. Assume that you are interested in earning some return on the idle balances you usually keep
in your checking account and decide to buy some money market mutual funds shares by
writing a check. Comment on the effect of your action (with everything else the same) on M1
and M2.
Your actions will reduce your checking account balance and increase your holdings of
money market mutual fund shares. Considering this transaction only, M1 will decrease as
17. In April 2009, the growth rate of M1 fell to 6.1%, while the growth rate of M2 rose to 10.3%.
In September 2013, the year-over-year growth rate of the M1 money supply was 6.5%, while
the growth rate of the M2 money supply was about 8.3%. How should Federal Reserve
18. Suppose a researcher discovers that a measure of the total amount of debt in the U.S.
economy over the past twenty years was a better predictor of inflation and the business cycle
than M1 or M2. Does this discovery mean that we should define money as equal to the total
amount of debt in the economy?
ANSWERS TO APPLIED PROBLEMS
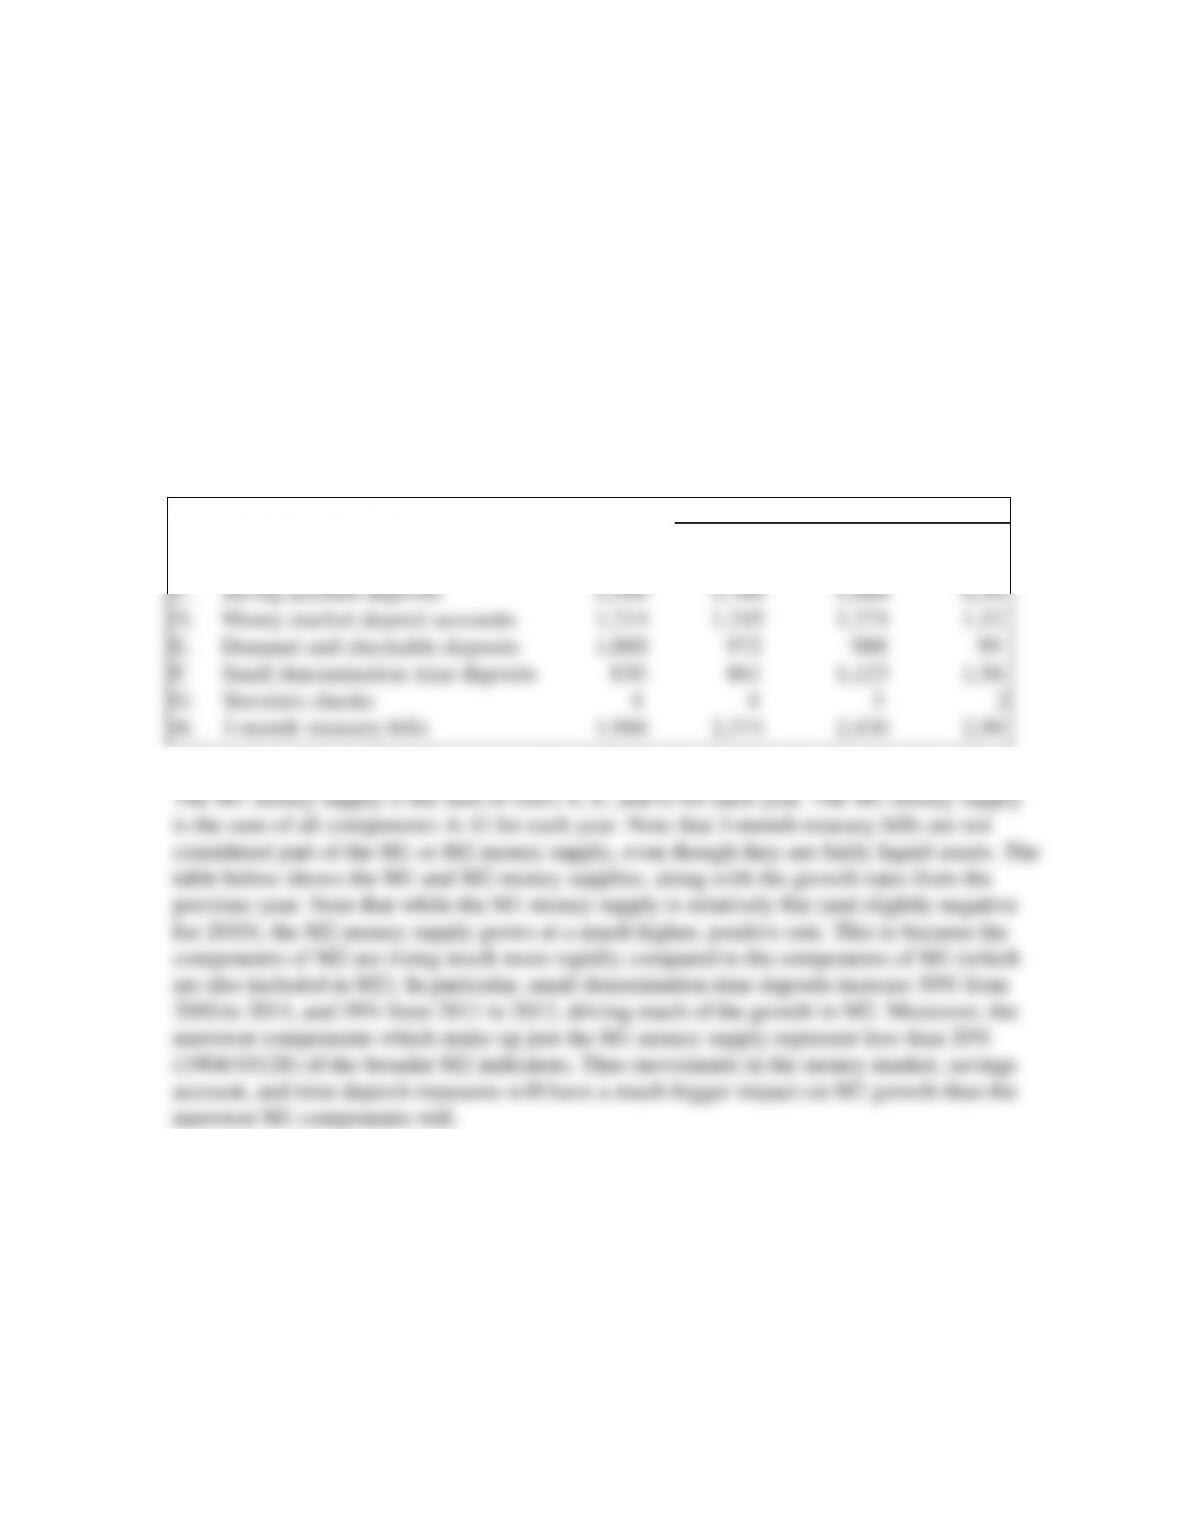
19. The table below shows hypothetical values, in billions of dollars, of different forms of money.
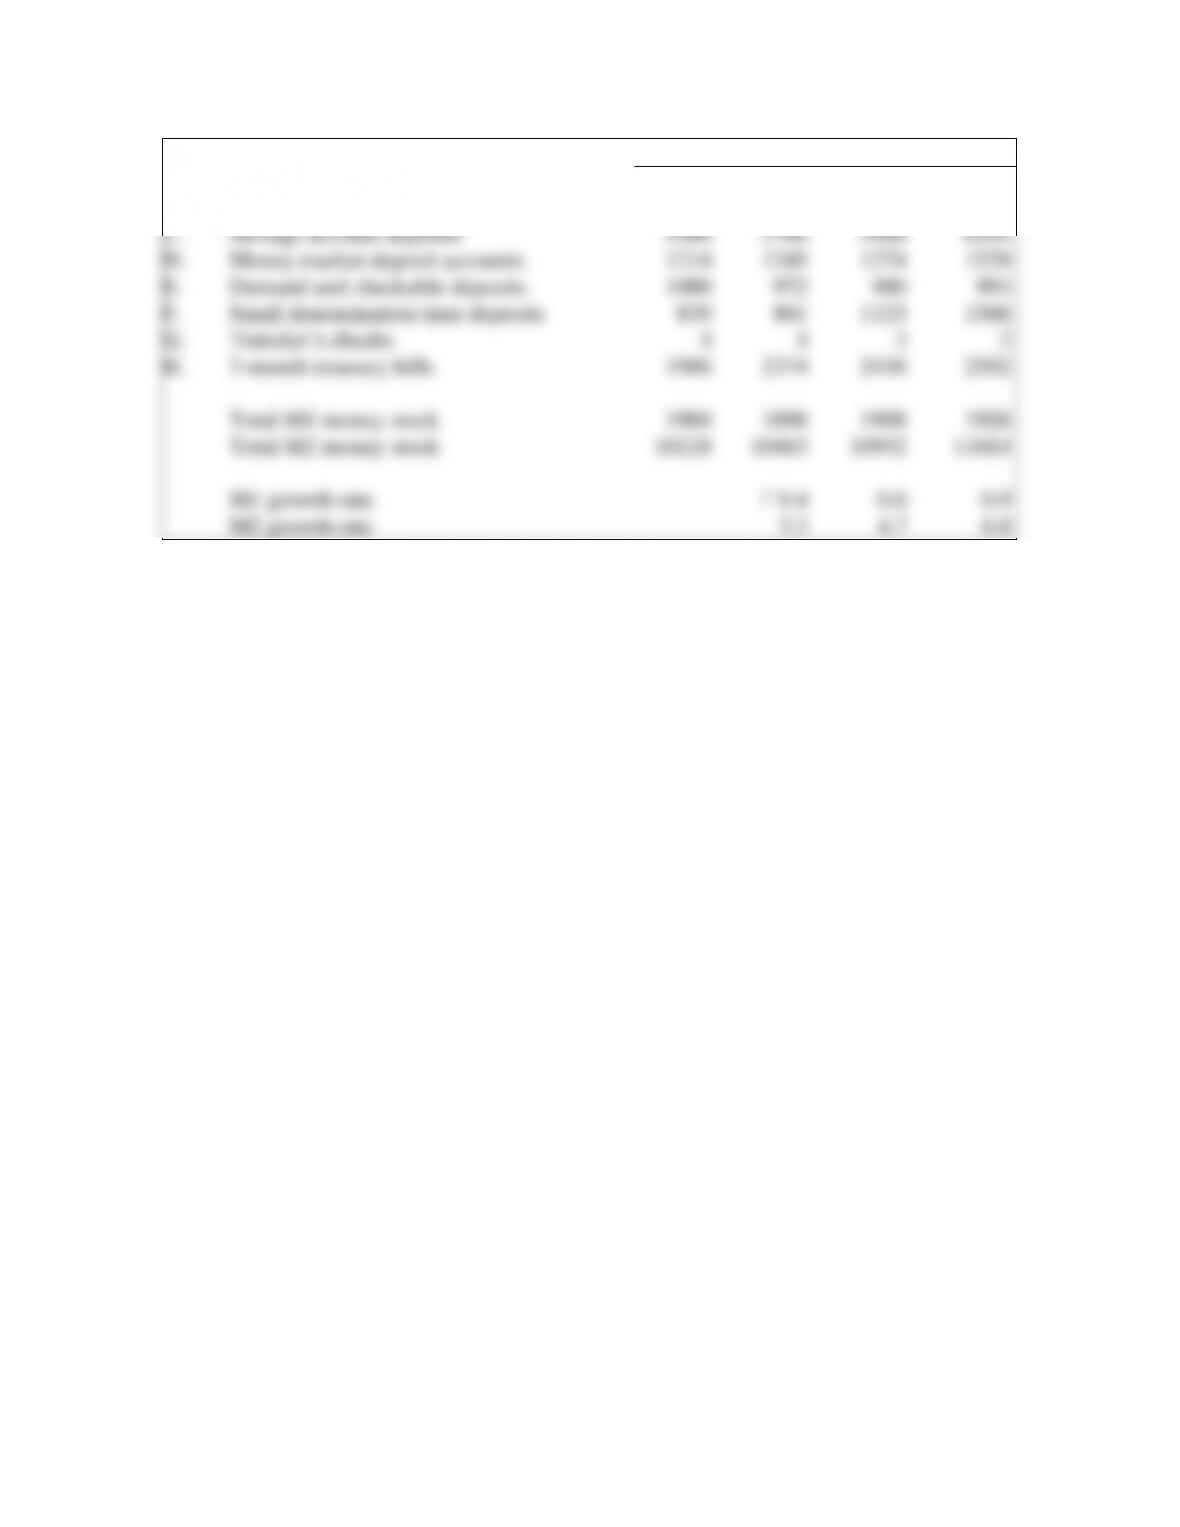
a. Use the table to calculate the M1 and M2 money
sup
plies for each year, as well as the
growth rates of
the
M1 and M2 money supplies from the previous year.
b. Why are the growth rates of M1 and M2 so different? Explain.
2015
2016
2017
201
8
A.
Curr
ency
900
920
925
93
1
B.
Money market mutual fund
shares
680
681
679
68
8
C.
Saving
account deposits
5,500
5,780
5,968
6,10
5
D.
Money
market deposit accounts
1,214
1,245
1,274
1,32
9
E.
Demand and checkable deposits
1,000
972
980
99
3
F.
Small
denomination time deposits
830
861
1,123
1,56
6
G.
T
raveler
’
s
checks
4
4
3
2
H.
3-month treasury bills
1,986
2,374
2,436
2,50
2
2009
2010
2011
2012
A.
Currency
900
920
925
931
B.
Money market mutual fund shares
680
681
679
688
C.
Savings account deposits
5500
5780
5968
6105
D.
Money market deposit accounts
1214
1245
1274
1329
E.
Demand and checkable deposits
1000
972
980
993
F.
Small denomination time deposits
830
861
1123
1566
G.
Traveler’s checks
4
4
3
2
H.
3-month treasury bills
1986
2374
2436
2502
Total M1 money stock
1904
1896
1908
1926
Total M2 money stock
10128
10463
10952
11614
M1 growth rate
0.6
0.9
M2 growth rate
3.3
4.7
6.0
ANSWERS TO DATA ANALYSIS PROBLEMS
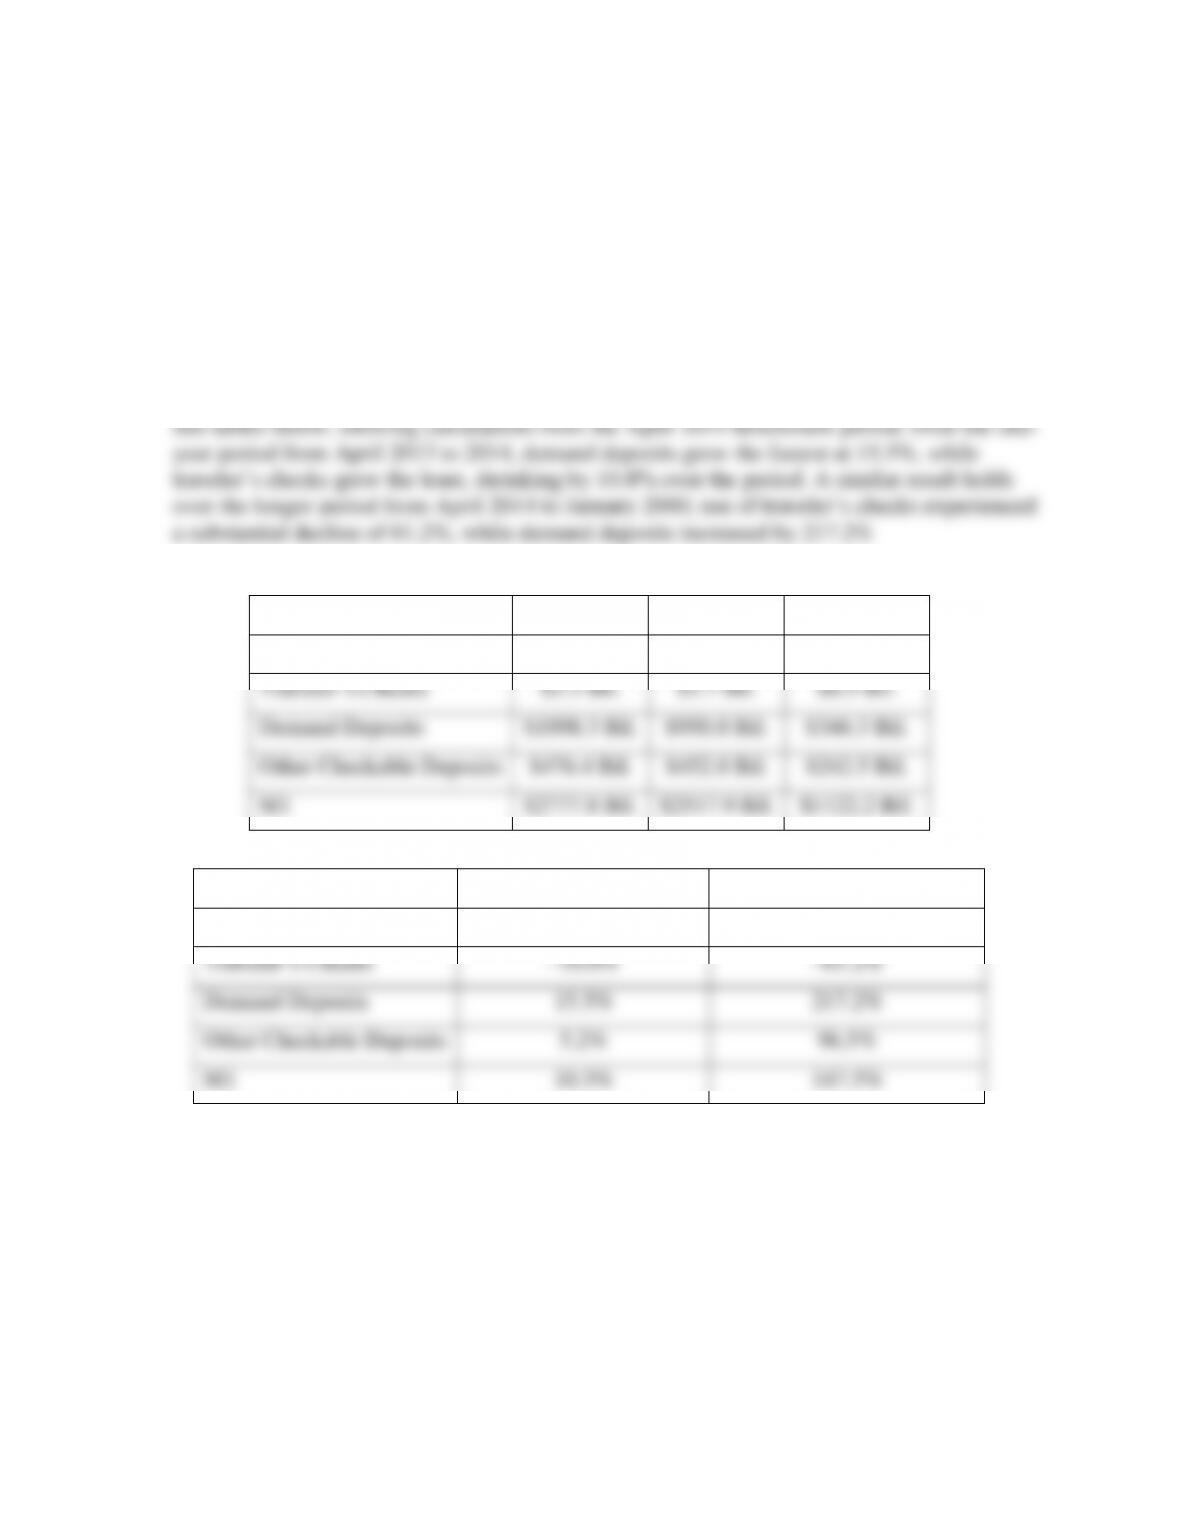
1. Go to the St. Louis Federal Reserve FRED database, and find data on currency (CURRSL),
traveler’s checks (TVCKSSL), demand deposits (DEMDEPSL), and other checkable deposits
(OCDSL). Calculate the M1 money supply, and calculate the percentage change in M1 and
in each of the four components of M1 from the most recent month of data available to the
same time one year prior. Which component has the highest growth rate? The lowest growth
rate? Repeat the calculations using the data from January 2000 to the most recent month of
data available, and compare your results.
April 2014
April 2013
January 2000
Currency
$1199.8 Bil.
$1110.6 Bil.
$524.9 Bil.
Traveler’s Checks
$3.3 Bil.
$3.7 Bil.
$8.5 Bil.
Demand Deposits
$1098.3 Bil.
$950.8 Bil.
$346.3 Bil.
Other Checkable Deposits
$476.4 Bil.
$452.8 Bil.
$242.5 Bil.
M1
$2777.8 Bil.
$2517.9 Bil.
$1122.2 Bil.
April 2013 to April 2014
January 2000 to April 2014
Currency
8.0%
128.6%
Traveler’s Checks
–10.8%
–61.2%
Demand Deposits
15.5%
217.2%
Other Checkable Deposits
5.2%
96.5%
M1
10.3%
147.5%
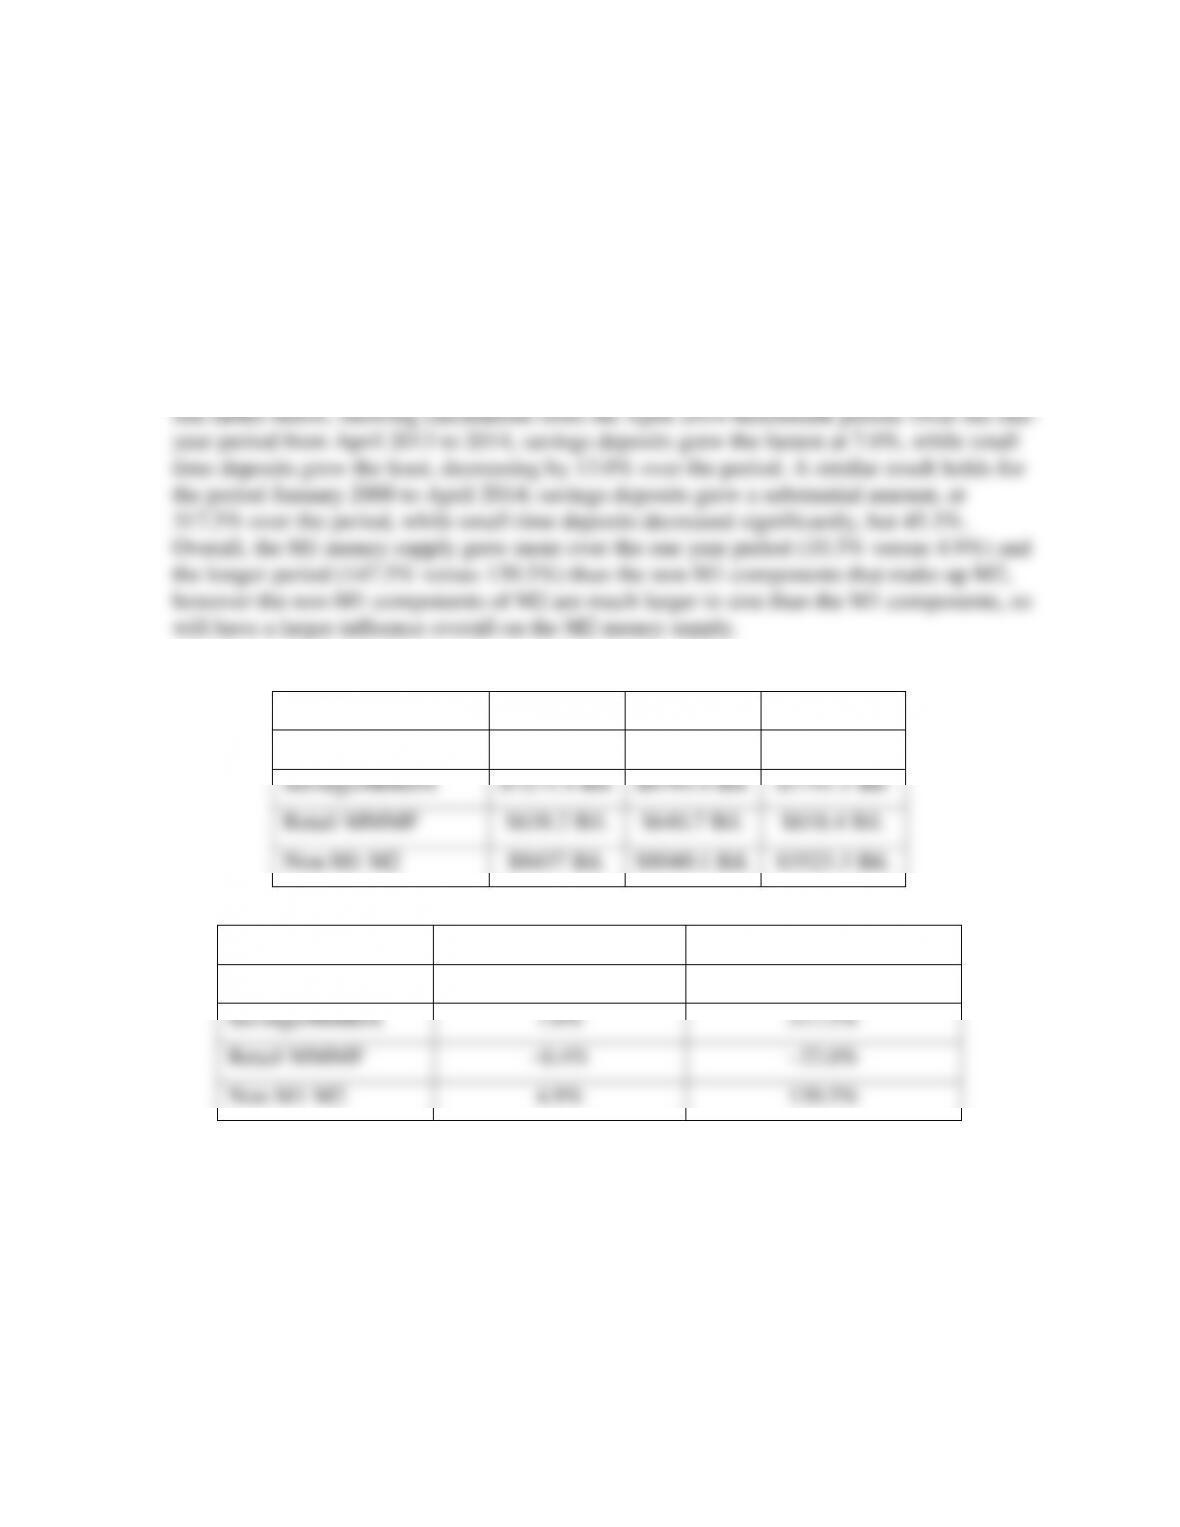
2. Go to the St. Louis Federal Reserve FRED database, and find data on small-denomination
time deposits (STDSL), savings deposits and money market deposit accounts (SAVINGSL),
and retail money market funds (RMFSL). Calculate the percentage change of each of these
three components of M2 (not included in M1) from the most recent month of data available to
the same time one year prior. Which component has the highest growth rate? The lowest
growth rate? Repeat the calculations using the data from January 2000 to the most recent
month of data available, and compare your results. Use your answers from question 1 to
determine which grew faster: the non-M1 components of M2, or the M1 money supply.
April 2014
April 2013
January 2000
Small Time Deposits
$527.4 Bil.
$606 Bil.
$963.4 Bil.
Savings/MMDA
$7271.4 Bil.
$6793.4 Bil.
$1741.5 Bil.
Retail MMMF
$638.2 Bil.
$640.7 Bil.
$818.4 Bil.
Non-M1 M2
$8437 Bil.
$8040.1 Bil.
$3523.3 Bil.
April 2013 to April 2014
January 2000 to April 2014
Small Time Deposits
–13.0%
–45.3%
Savings/MMDA
7.0%
317.5%
Retail MMMF
–0.4%
–22.0%
Non-M1 M2
4.9%
139.5%