21. What traits characterize a “conservative” central banker?
ANSWERS TO APPLIED PROBLEMS
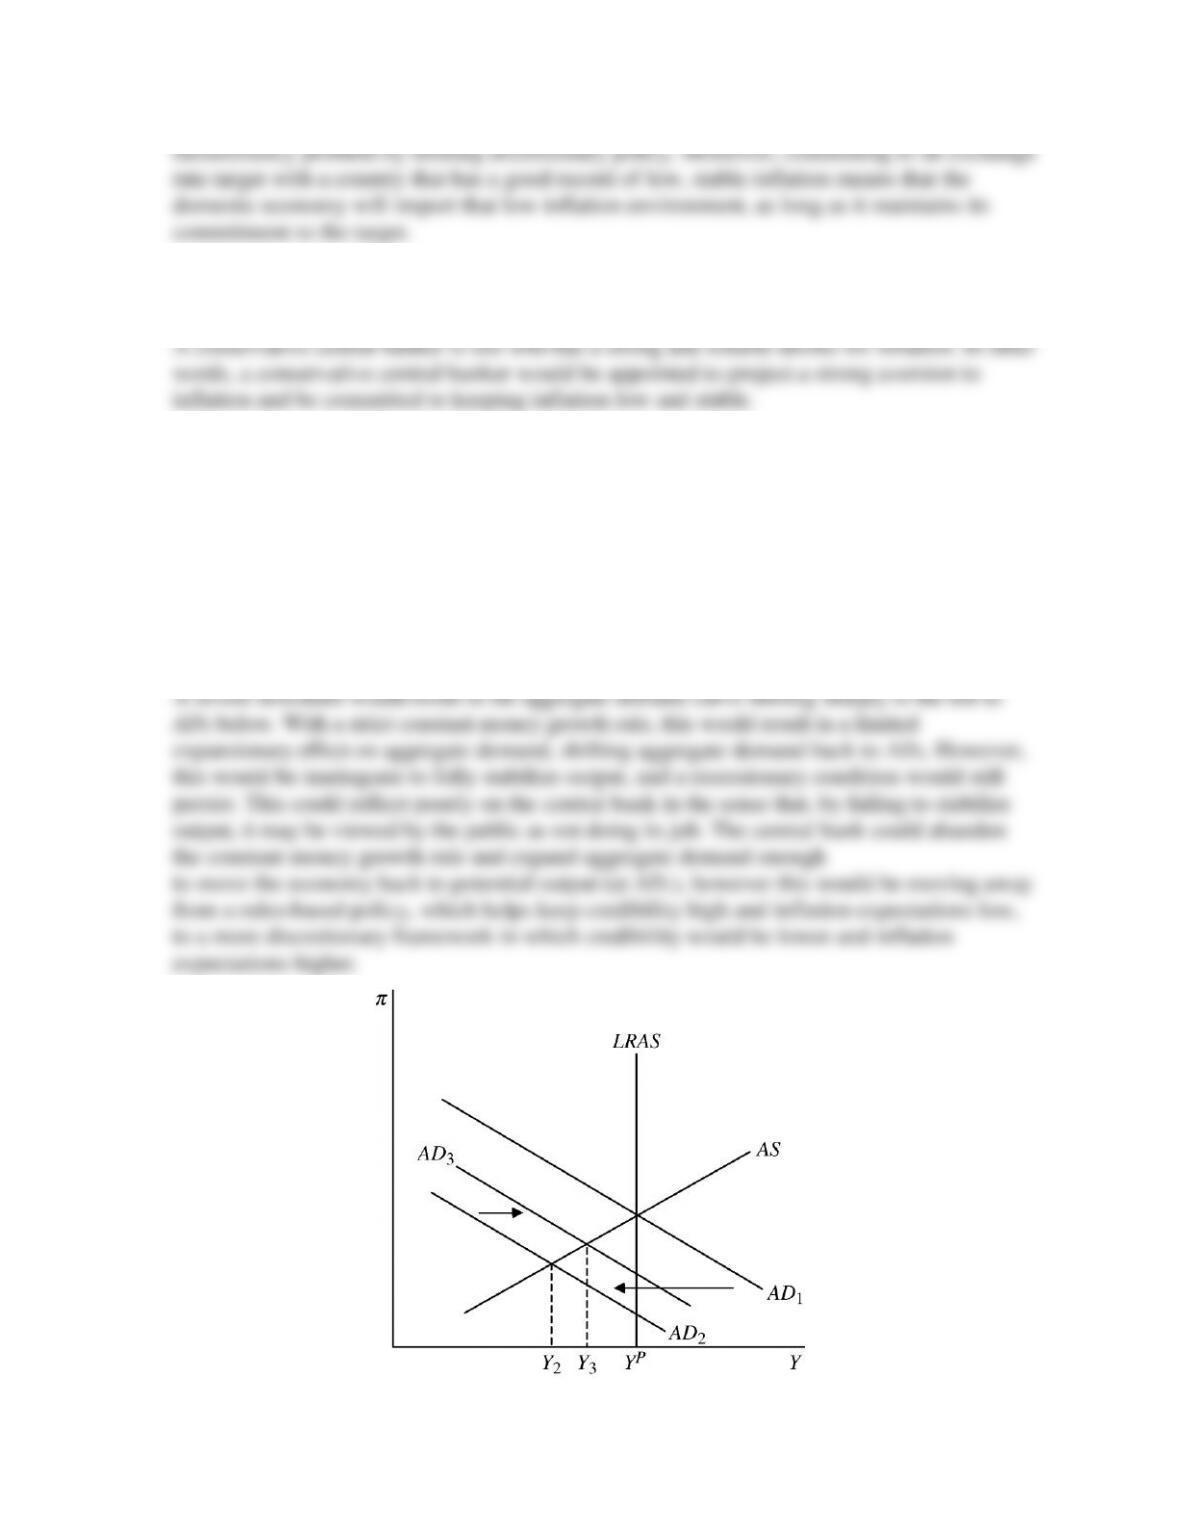
22. Suppose the central bank is following a constant-money-growth-rate rule and the economy is hit
with a severe economic downturn. Use an aggregate supply and demand graph to show the
possible effects on the economy. How does this situation reflect on the credibility of the central
bank if it maintains the money growth rule? How does it reflect on the central bank’s credibility
if it abandons the money growth rule to respond to the downturn?
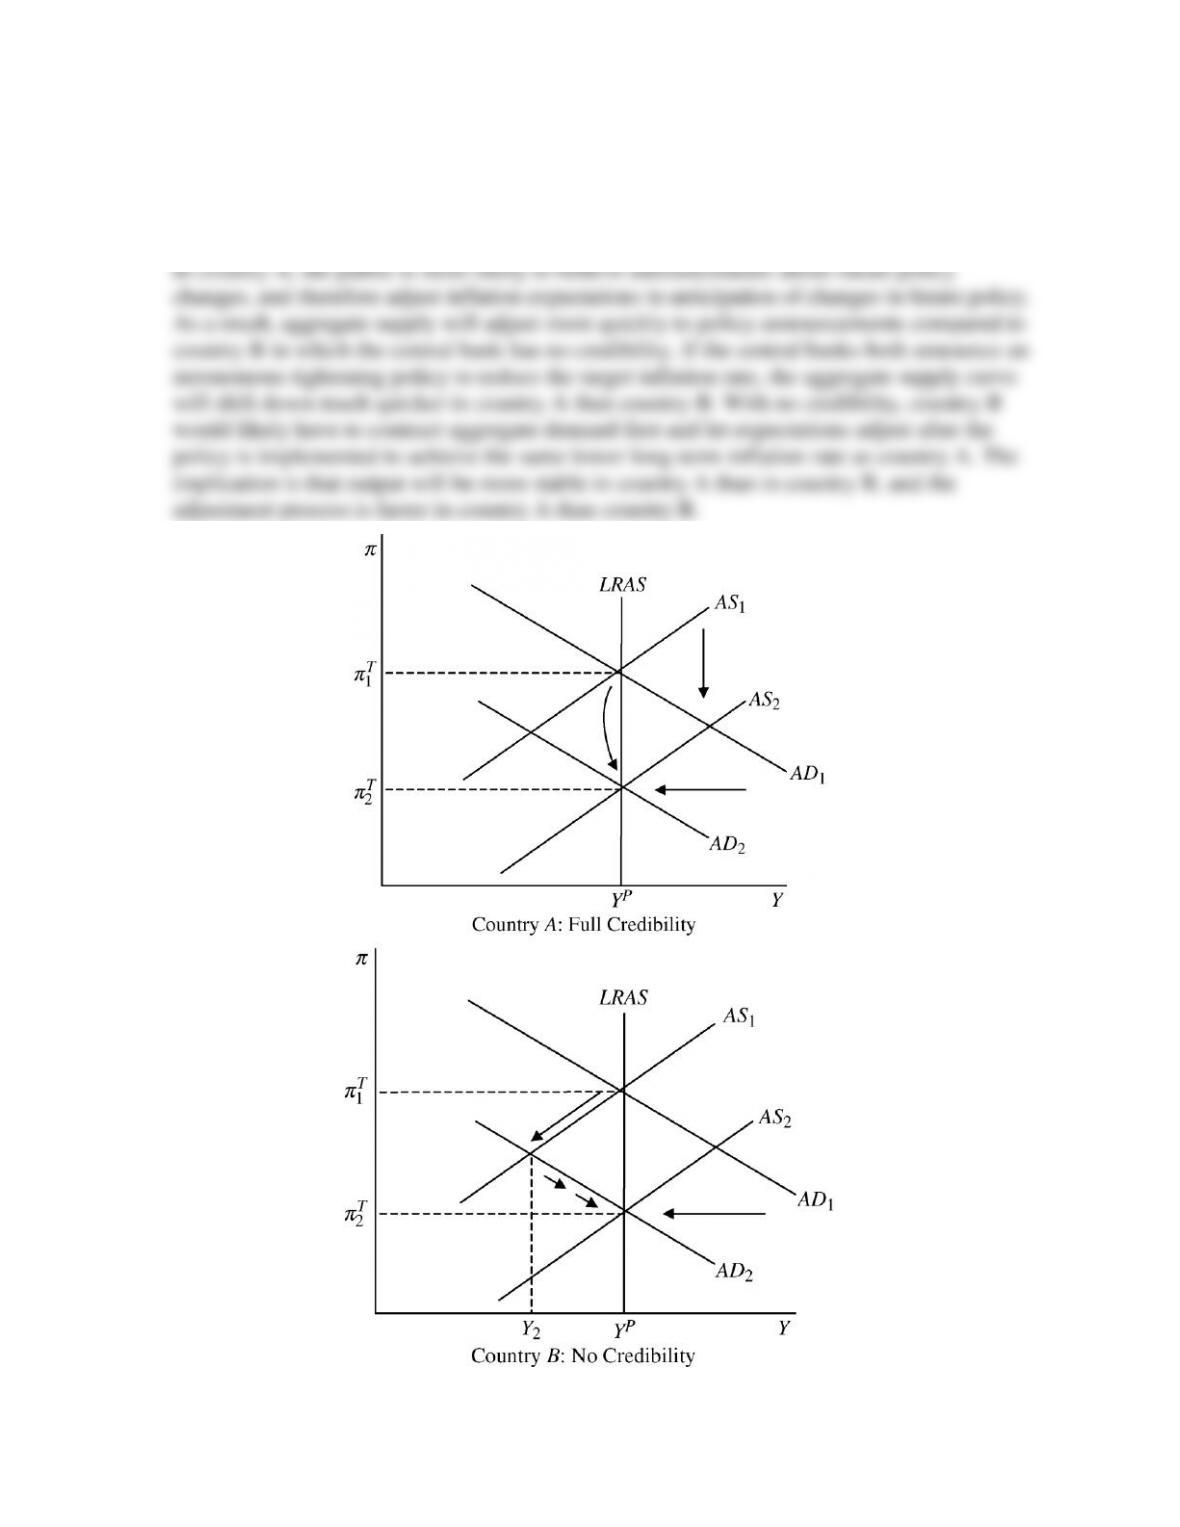
23. Suppose country A has a central bank with full credibility, and country B has a central bank
with no credibility. How does the credibility of each country’s central bank affect the speed
of adjustment of the aggregate supply curve to policy announcements? How does this result
affect output stability? Use an aggregate supply and demand diagram to demonstrate.
24. Suppose two countries have identical aggregate demand curves and potential levels of
your answer.
Country A
Country B
2015
3.0
3.0
2016
3.8
5.5
2017
3.5
5.0
2018
3.2
4.3
2019
3.0
%
3.8
%
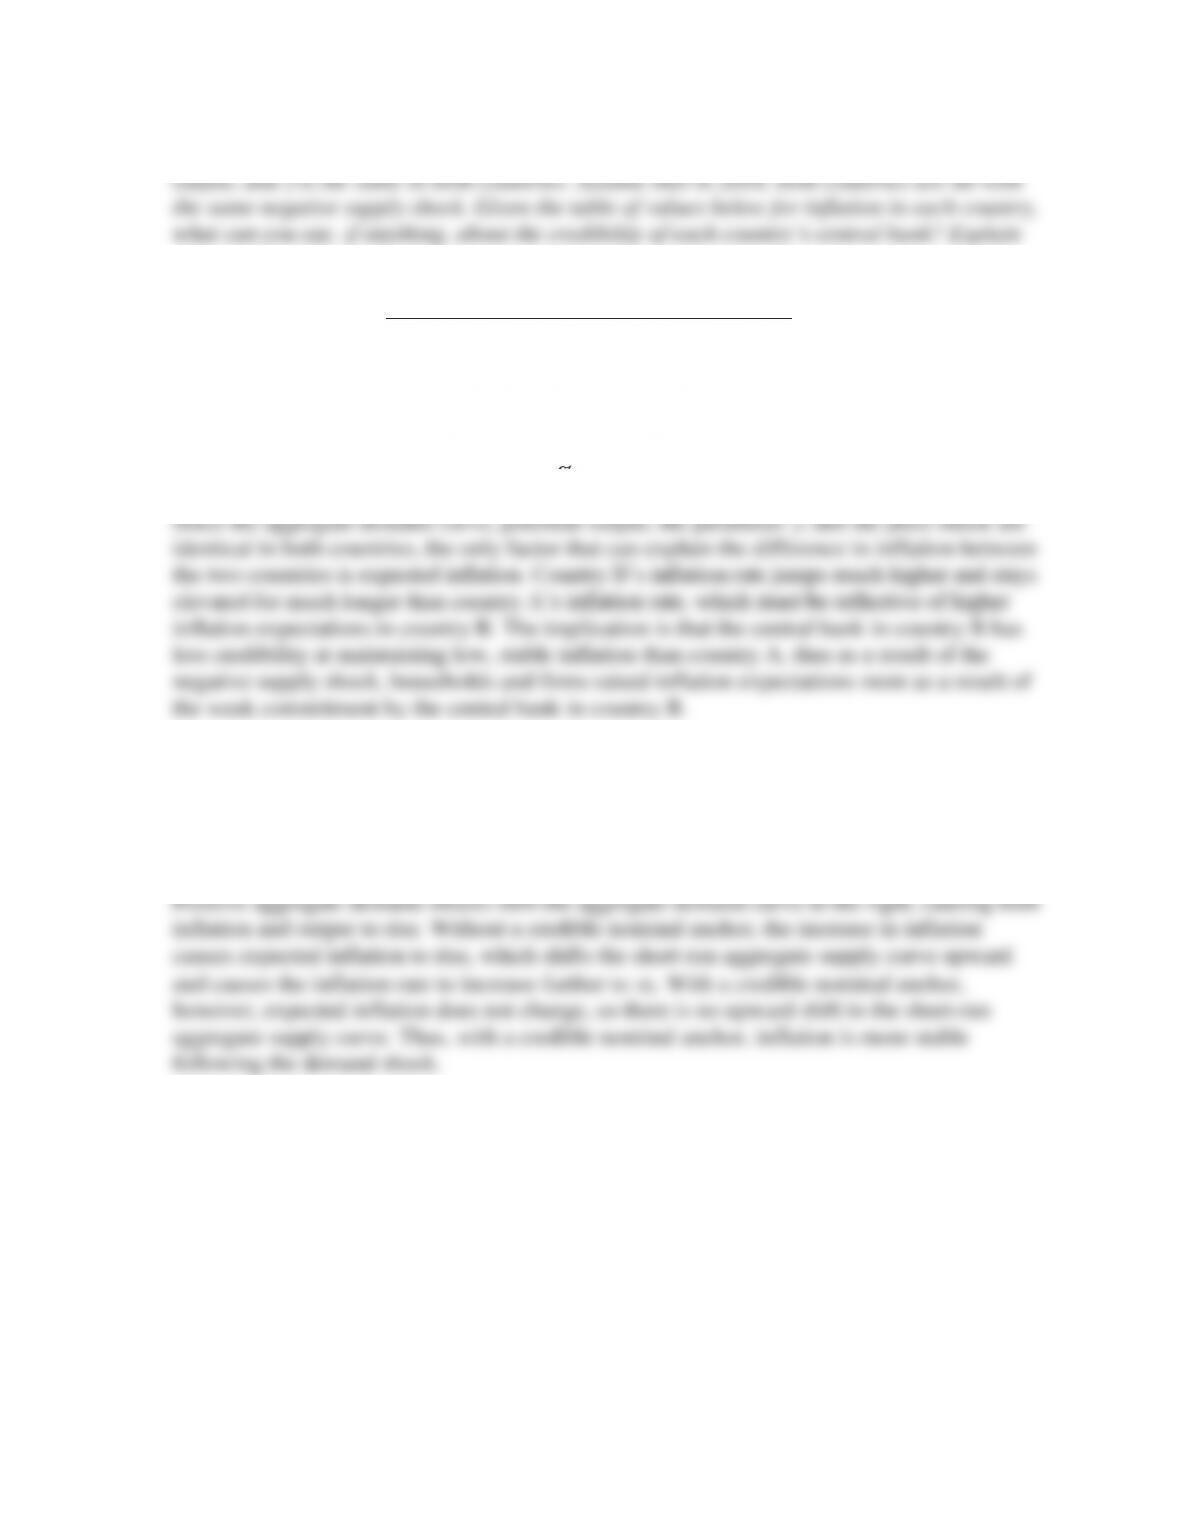
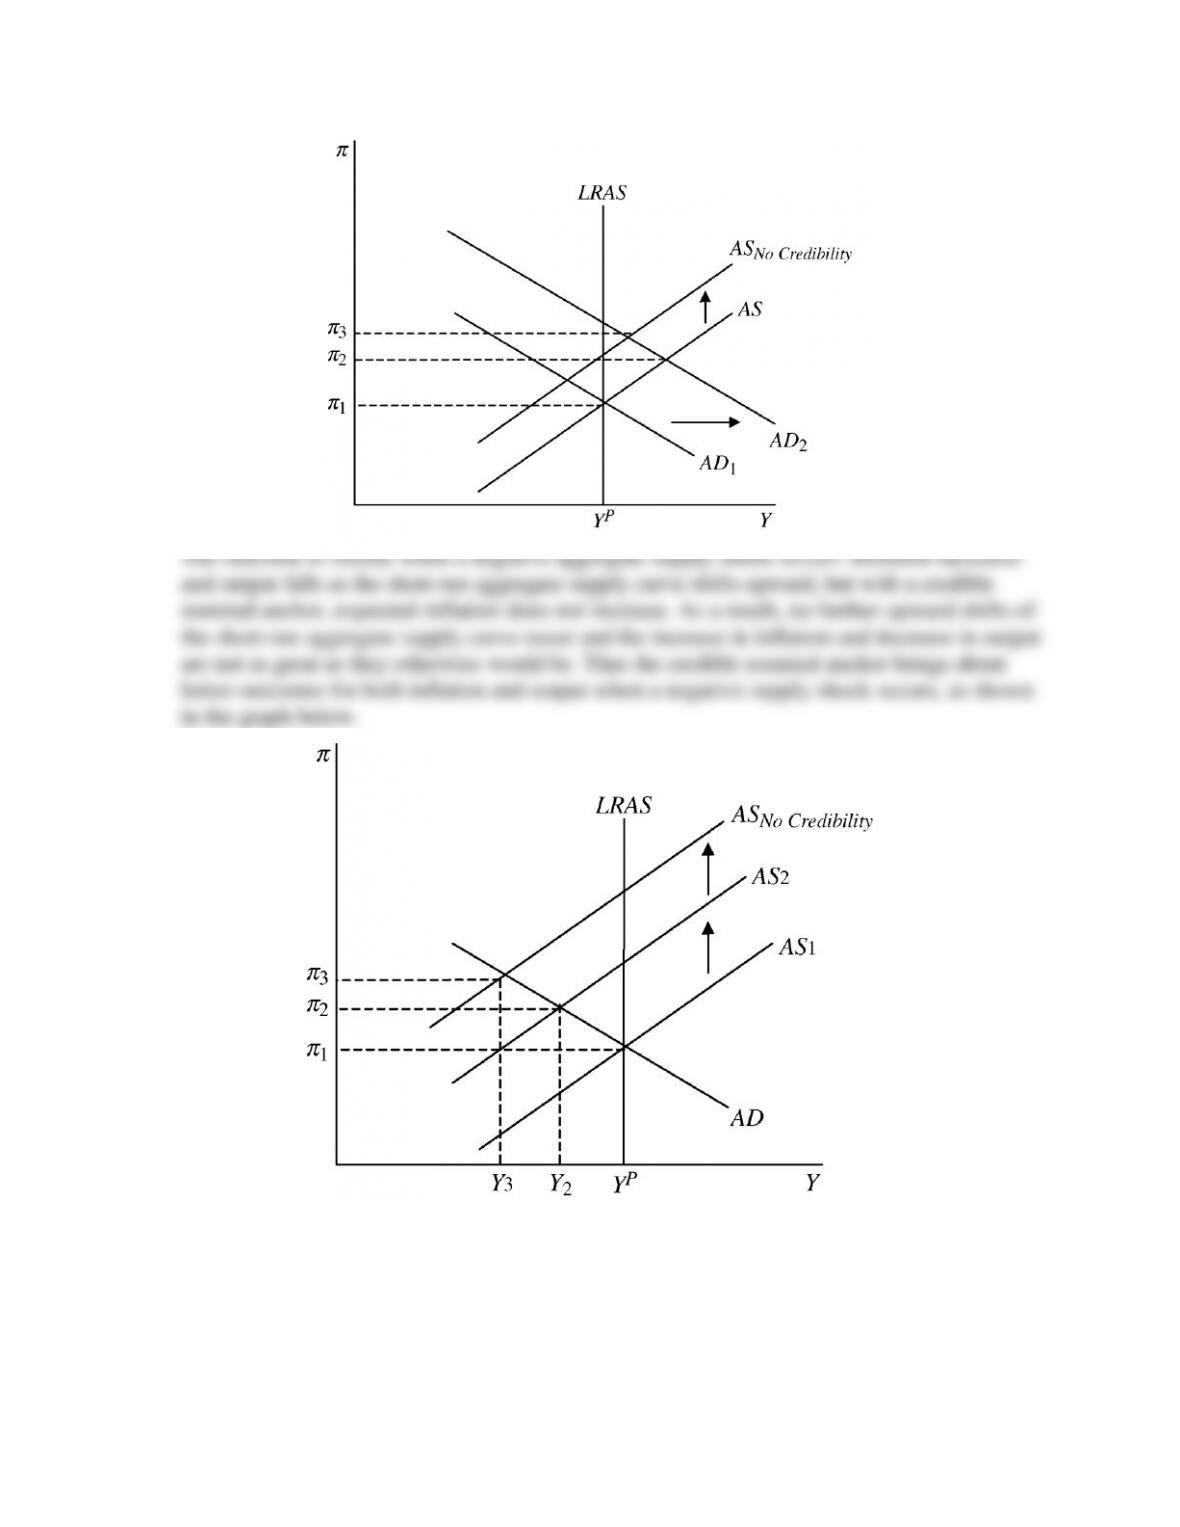
25. How does a credible nominal anchor help improve the economic outcomes that result from a
positive aggregate demand shock? How does a credible nominal anchor help if a negative
aggregate supply shock occurs? Use graphs of aggregate supply and demand to
demonstrate.
ANSWERS TO DATA ANALYSIS PROBLEMS
1. Go to the St. Louis Federal Reserve FRED database, and find data on the personal
consumption expenditure price index (PCECTPI). Convert the units setting to “Percent
Change from Year Ago,” and download the data. Beginning in January 2012, the Fed
formally announced a 2% inflation goal over the “longer–term.”
a. Calculate the average inflation rate over the last four and the last eight quarters of data
available. How does it compare to the 2% inflation goal?
b. What, if anything, does your answer to part (a) imply about Federal Reserve credibility?
2. Go to the St. Louis Federal Reserve FRED database, and find data on the GDP deflator
(GDPDEF) and the price of a barrel of oil (MCOILWTICO). For the GDP deflator, convert
the units setting to “Percent Change from Year Ago,” and download the data.
a. Calculate the average percent change in the price of oil over the most recent five years of
data available. To do this, calculate the percentage change from the beginning of the
period to the end, and divide this number by 5. What is the change in the inflation rate
over the same time period?
1990. To do this, calculate the percentage change from the beginning of the period to the
end, and divide this number by 4. What is the change in the inflation rate over the same
time period?
c. Based on your answers to parts (a) and (b) above, what can you conclude about
credibility of current monetary policy compared to its credibility in the earlier periods?