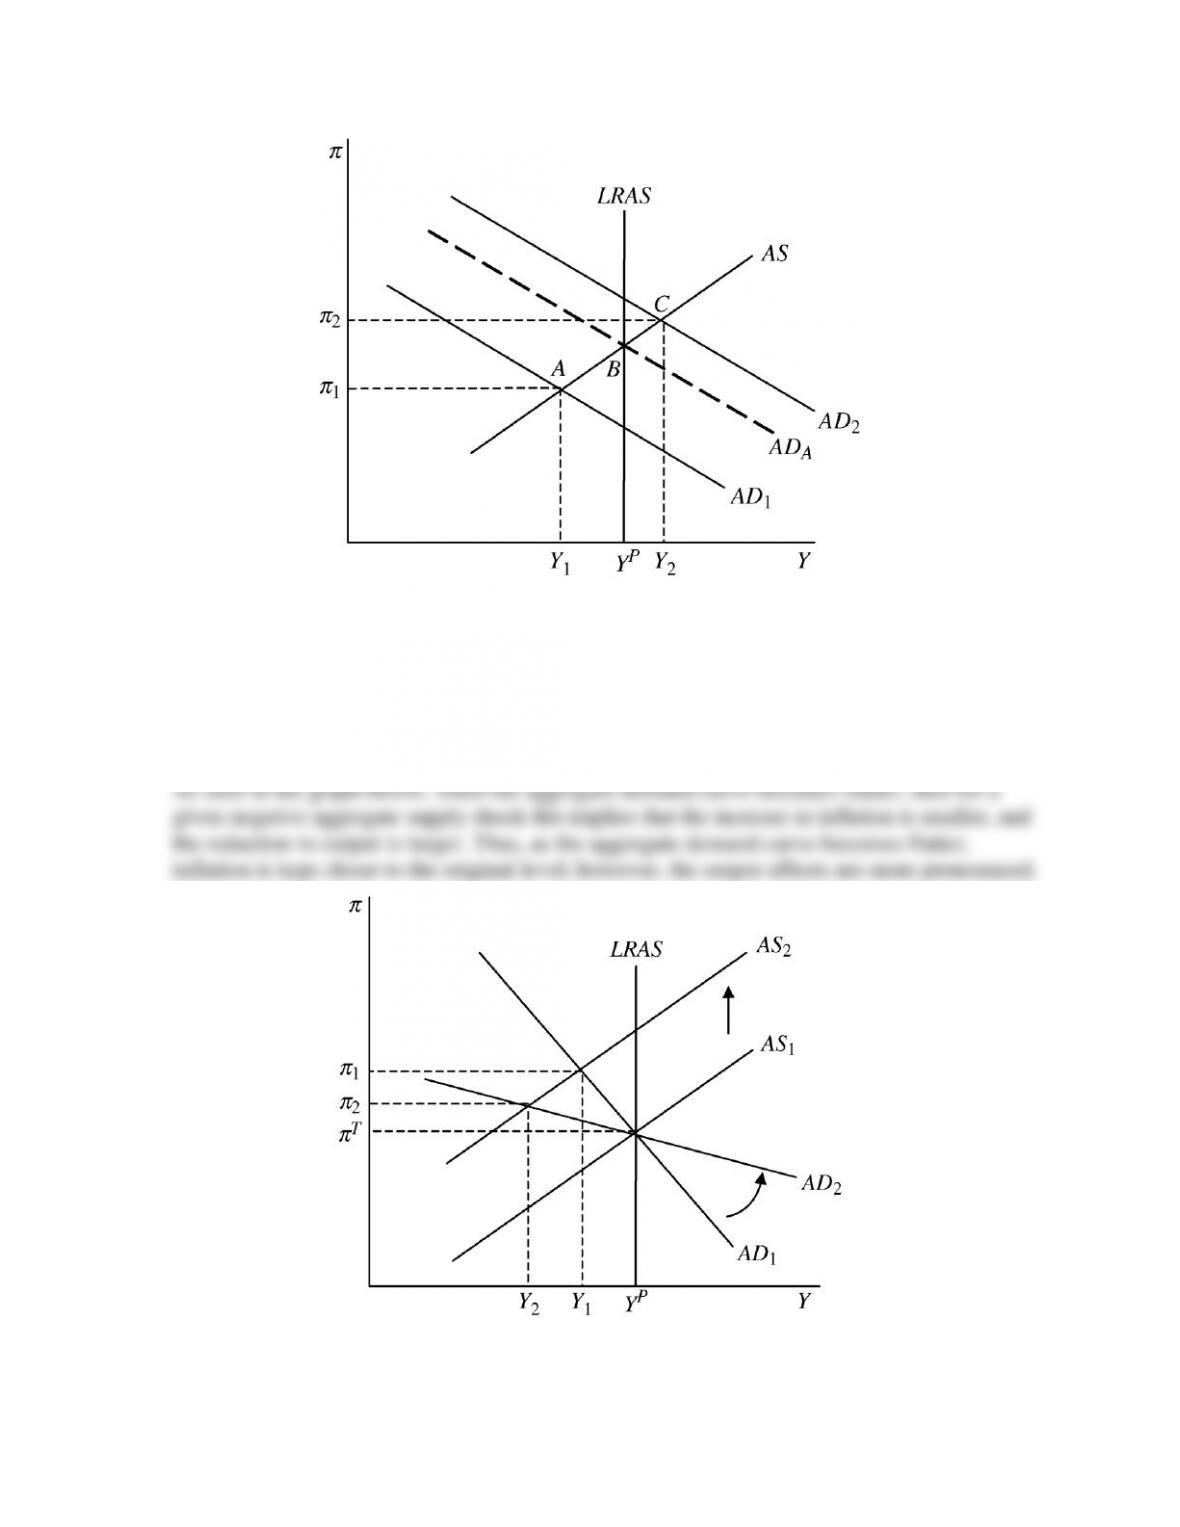
27. As monetary policymakers become more concerned with inflation stabilization, the slope of
the aggregate demand curve becomes flatter. How does the resulting change in the slope of
the aggregate demand curve help stabilize inflation when the economy is hit with a
temporary negative supply shock? How does this affect output? Use a graph of aggregate
demand and supply to demonstrate.
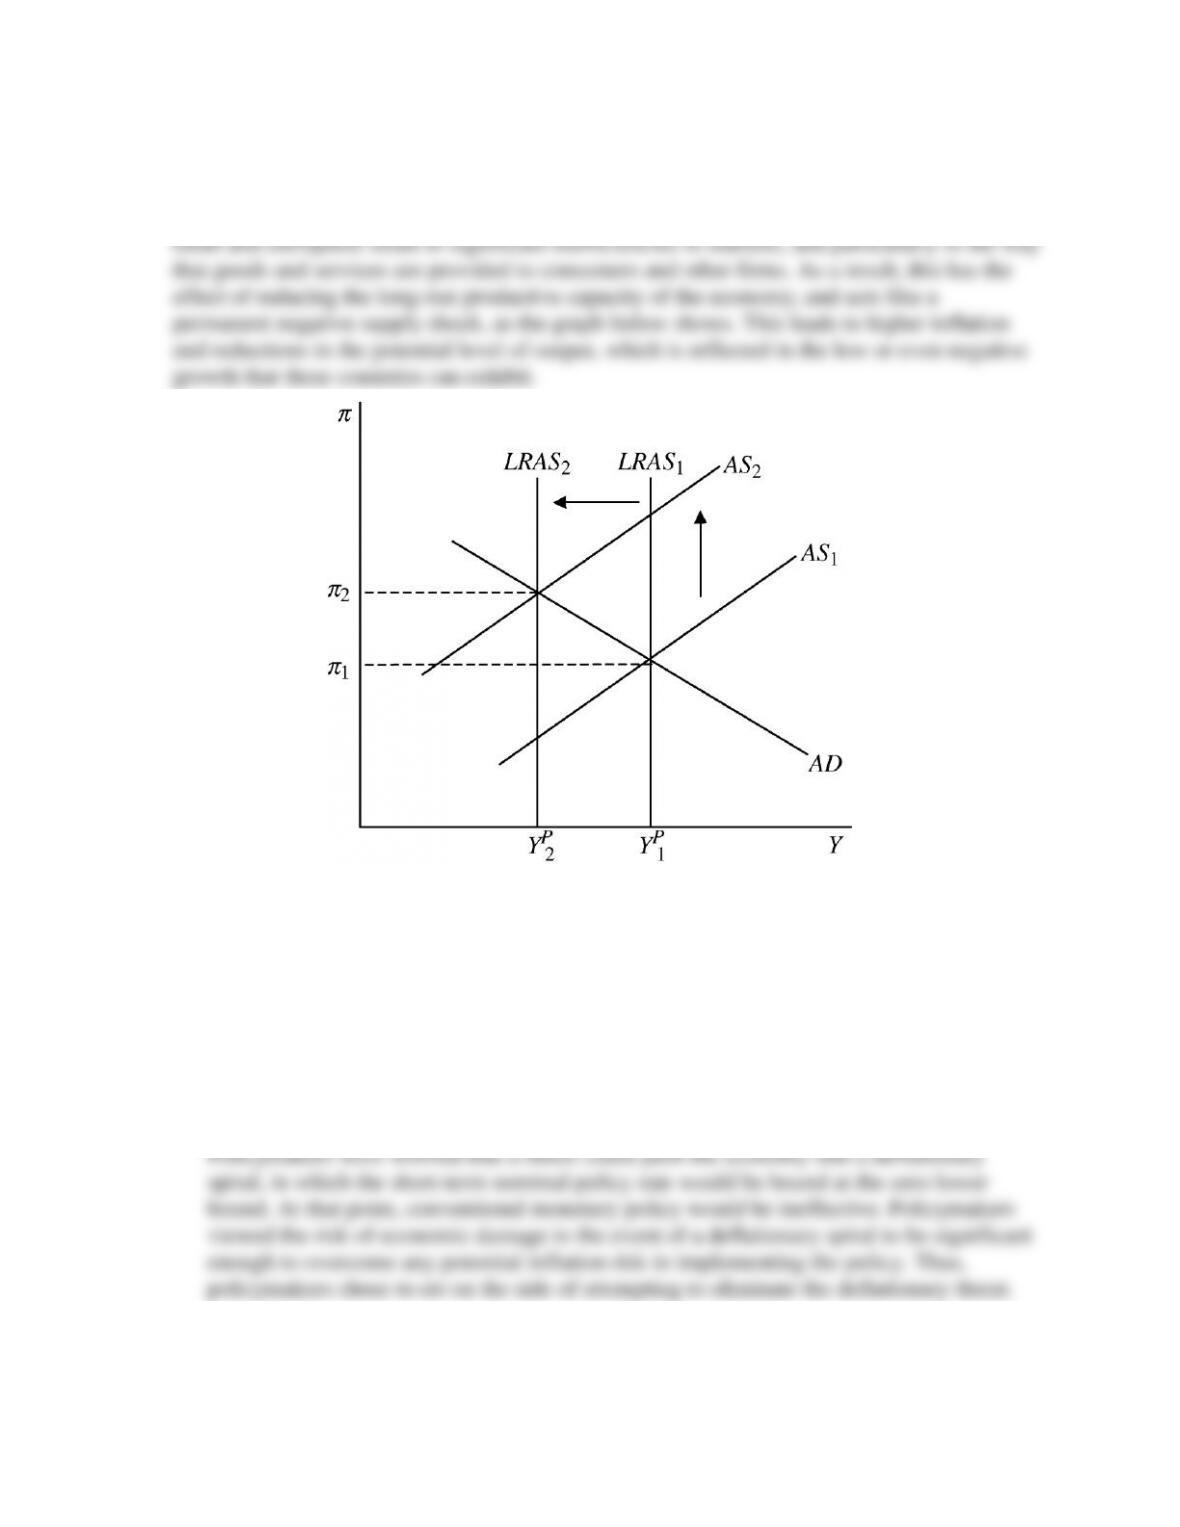
28. Many developing countries suffer from endemic corruption. How does this help explain why
these countries’ economies typically have high inflation and economic stagnation? Use a
graph of aggregate demand and supply to demonstrate.
29. In 2003, as the U.S. economy finally seemed poised to exit its ongoing recession, the Fed
began to worry about a “soft patch” in the economy, in particular the possibility of a
deflation. As a result, the Fed proactively lowered the federal funds rate from 1.75% in late
2002 to 1% by mid-2003, the lowest federal funds rate on record up to that point in time. In
addition, the Fed committed to keeping the federal funds rate at this level for a considerable
period of time. This policy was considered highly expansionary and was seen by some as
potentially inflationary and unnecessary.
a. How might fears of a zero lower bound justify such a policy, even if the economy was not
actually in a recession?
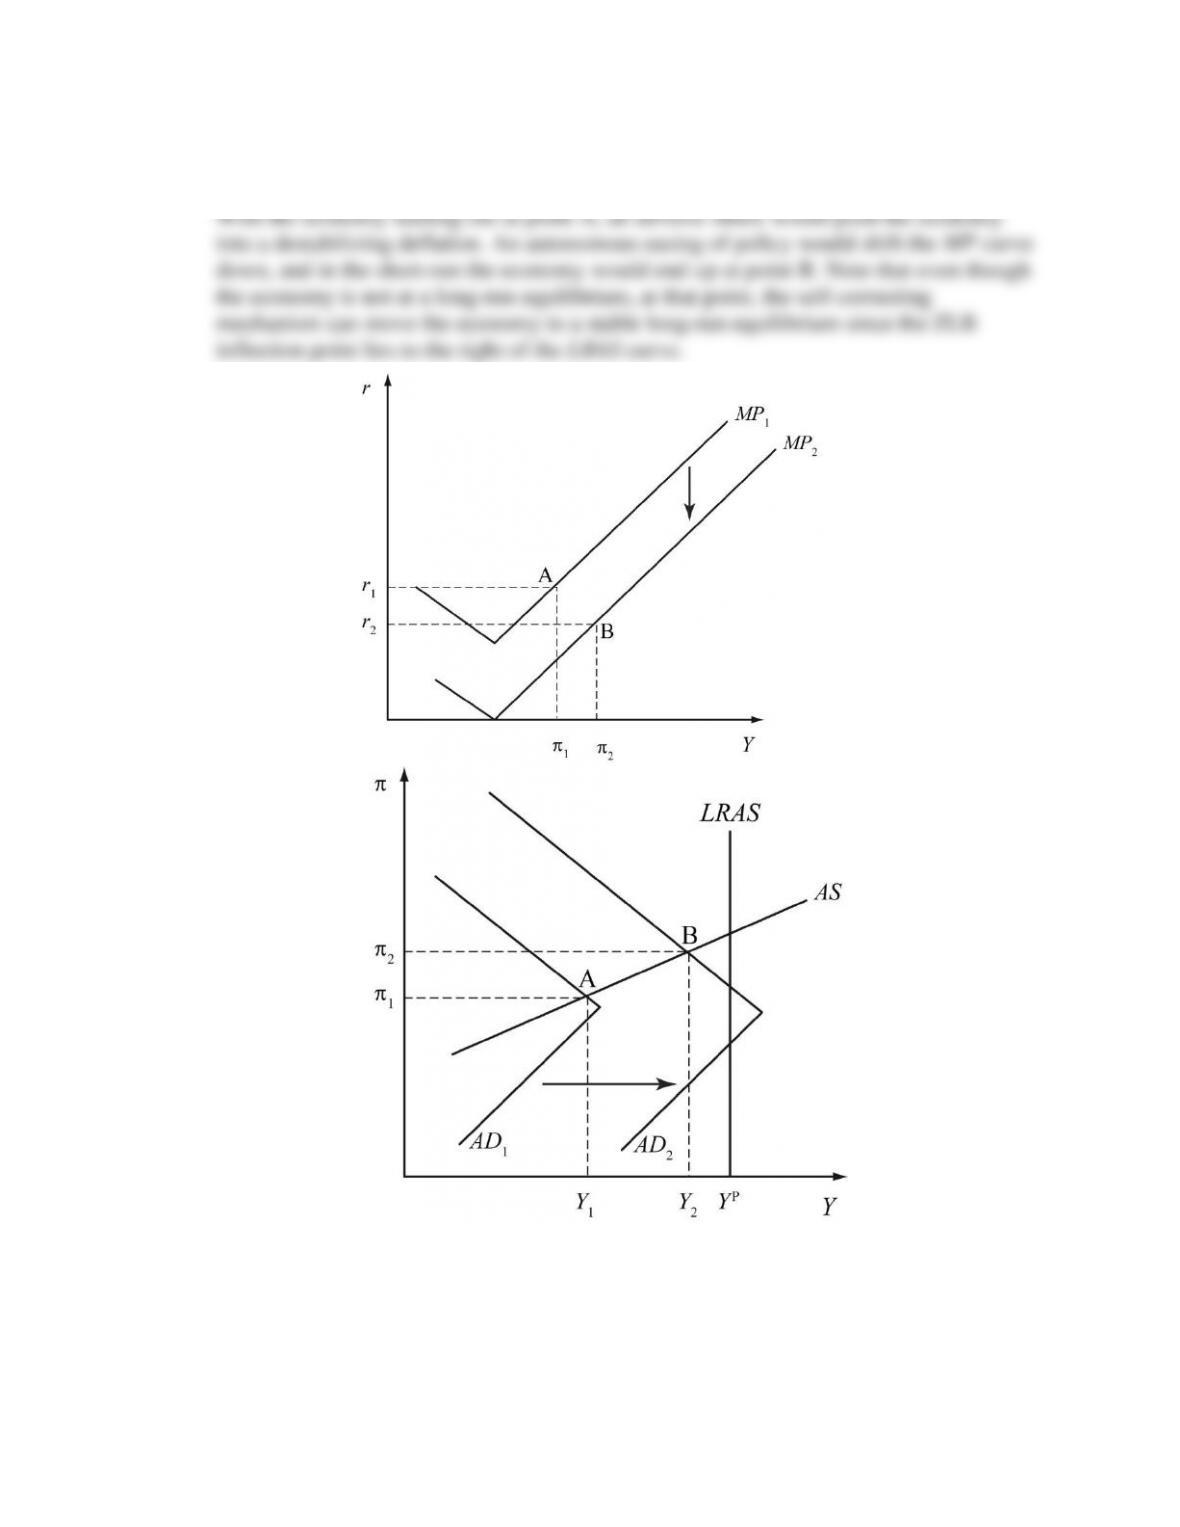
b. Show the impact of these policies on the MP curve and the AD/AS graph. Be sure to show
the initial conditions in 2003 and the impact of the policy on the deflation threat.
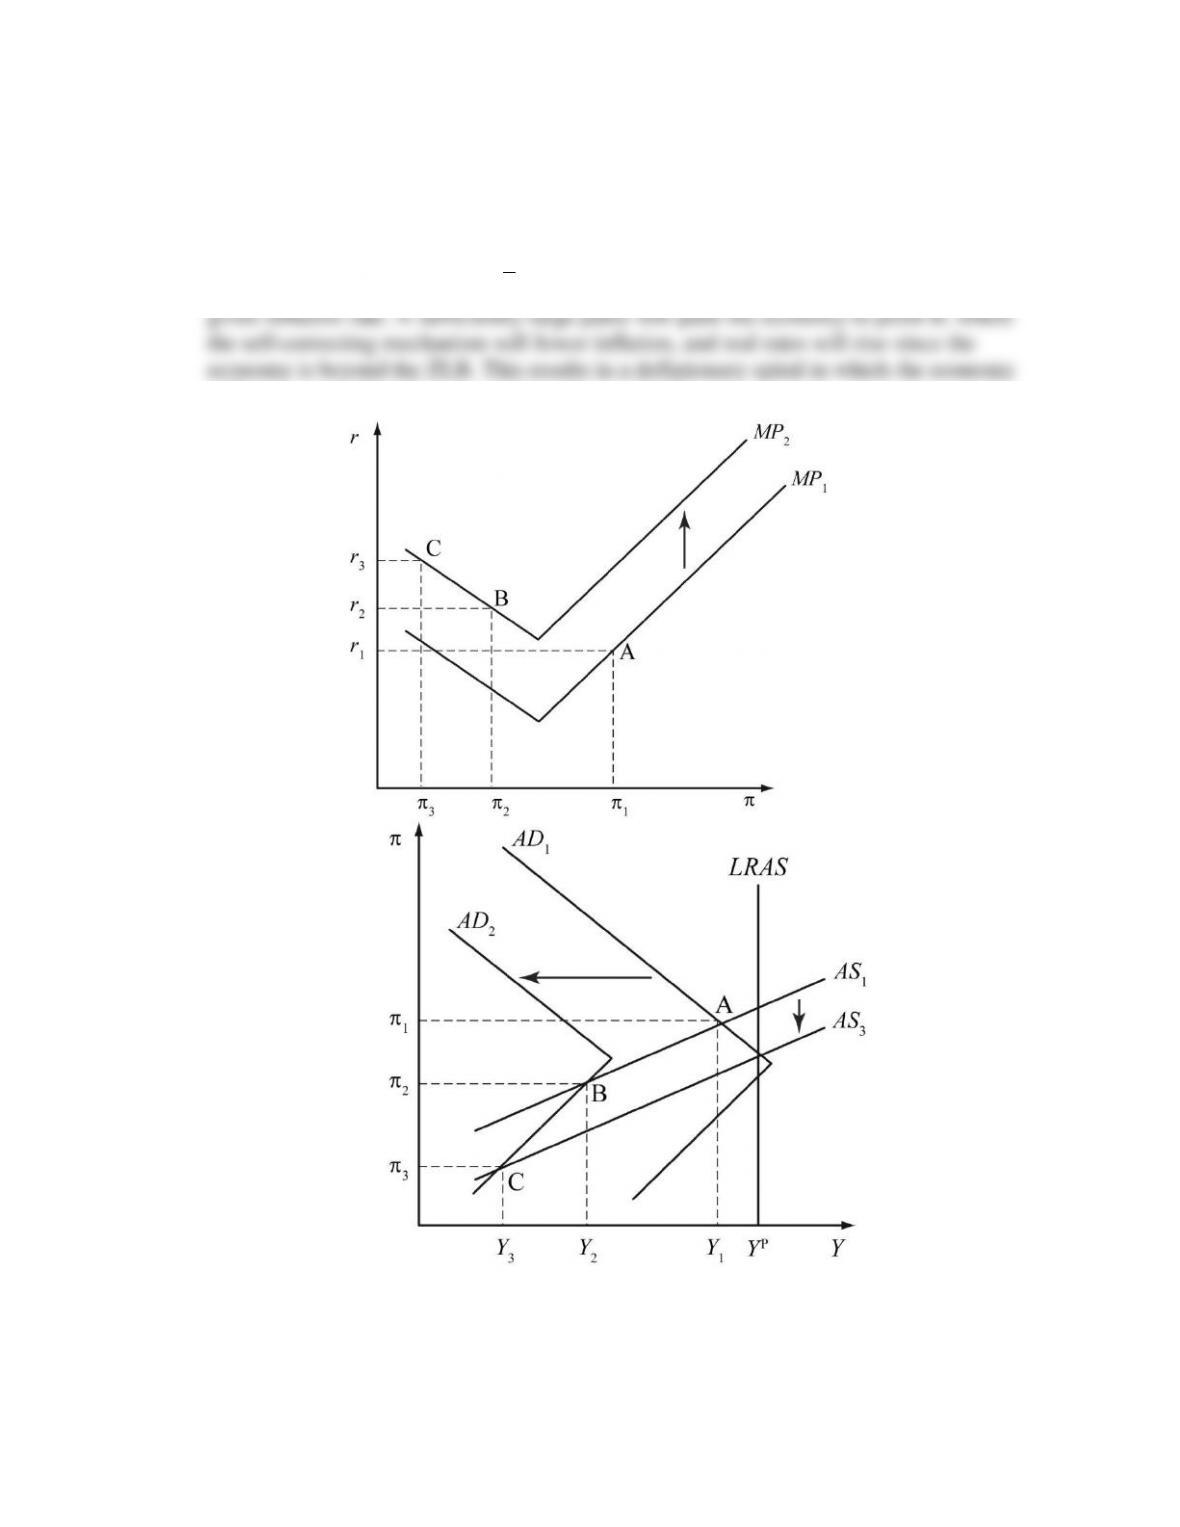
30. Suppose that f is determined by two factors: financial panic and asset purchases.
a. Using an MP curve and an AS/AD graph, show how a sufficiently large financial panic
can pull the economy below the zero lower bound and into a destabilizing deflationary
spiral.
A financial panic will increase
f
, thus raising the real interest rate on investments at any
will move toward (and past) a point such as point C.
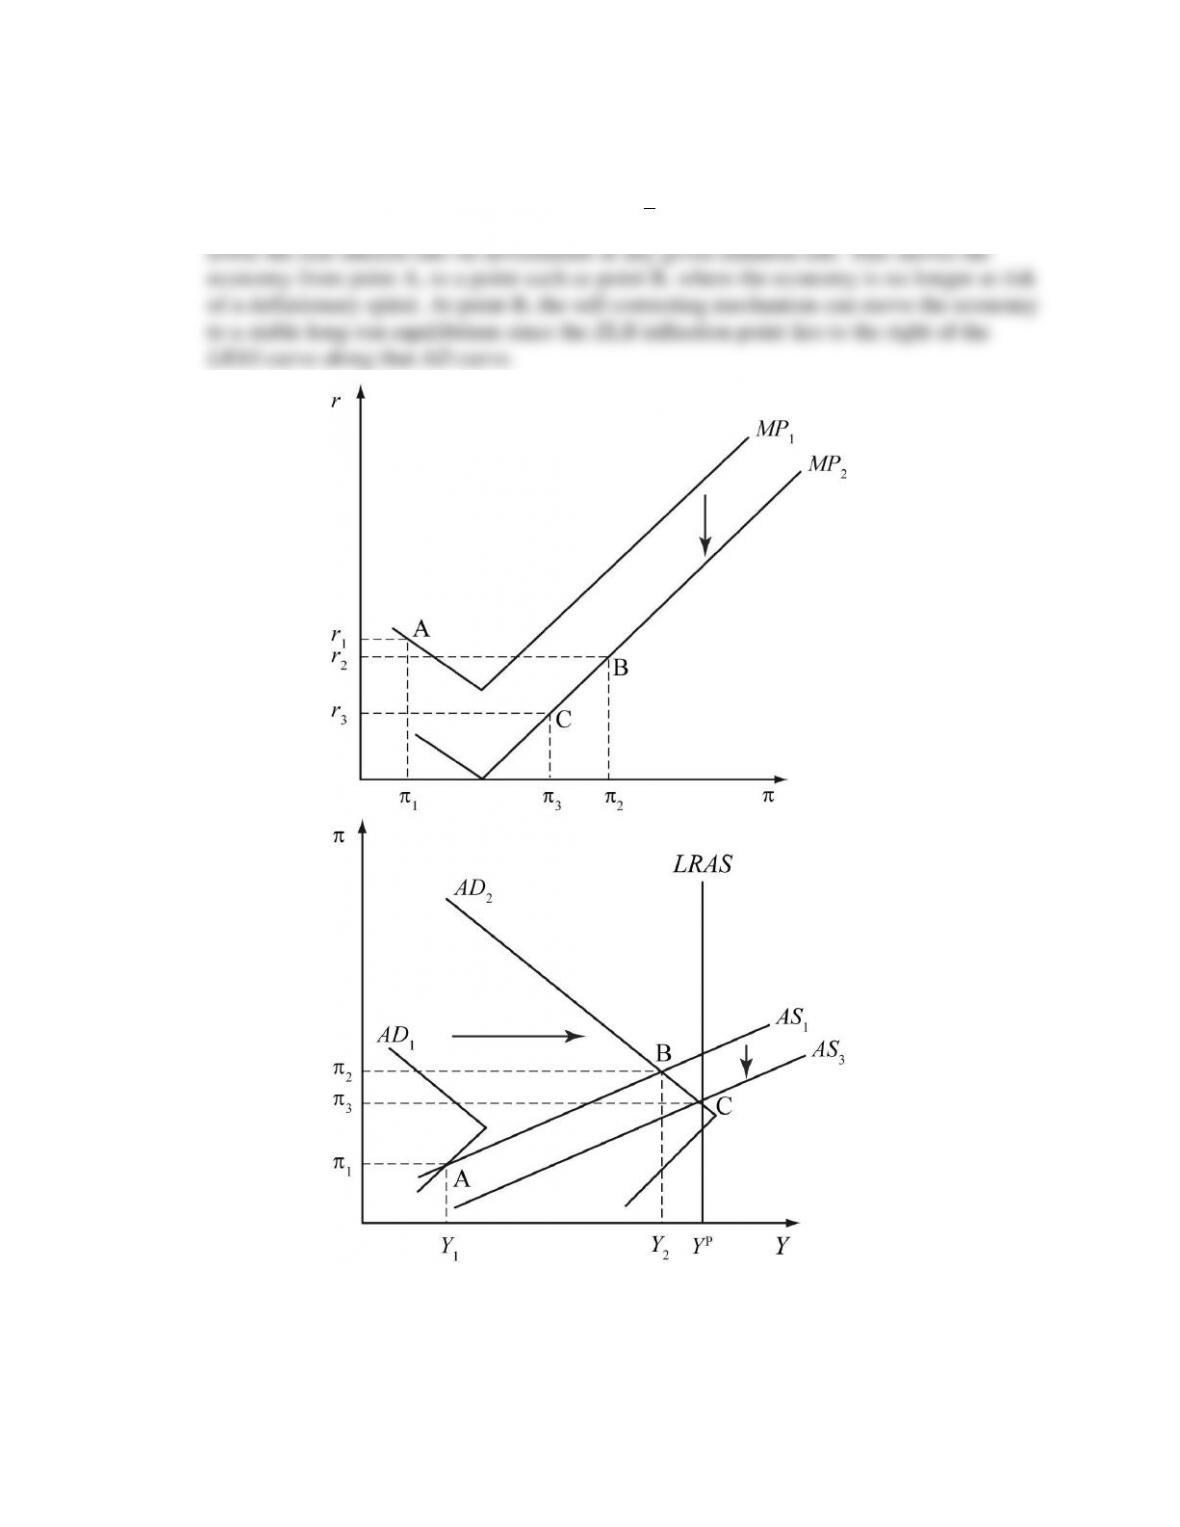
b. Using an MP curve and an AS/AD graph, show how a sufficient amount of asset
purchases can reverse the effects of the financial panic depicted in part (a).
A sufficient enough asset purchase will lower
f
, reversing the effects of the panic, and
ANSWERS TO DATA ANALYSIS PROBLEMS
1. On January 28, 2014, the Federal Reserve released a special statement that clarified its
goals of “price stability” and “maximum employment.” Specifically, it stated that “the
Committee judges that inflation at the rate of 2 percent, as measured by the annual change in
the price index for personal consumption expenditures, is most consistent over the longer run
with the Federal Reserve’s statutory mandate” and that “FOMC participants’ estimates of
the longer-run normal rate of unemployment had a central tendency of 5.2 percent to 6.0
percent.” Assume this statement implies that the natural rate of unemployment is believed to
be 5.6%. Go to the St. Louis Federal Reserve FRED database, and find data on the personal
consumption expenditure price index (PCECTPI), the unemployment rate (UNRATE), real
GDP (GDPC1), and real potential gross domestic product (GDPPOT), an estimate of
potential GDP. For the price index, adjust the units setting to “Percent Change From Year
Ago.” Download the data into a spreadsheet.
a. For the most recent four quarters of data available, calculate the average inflation gap
using the 2% target referenced by the Fed. Calculate this value as the average of the
inflation gaps over the four quarters.
b. For the most recent four quarters of data available, calculate the average output gap
using the GDP measure and the potential GDP estimate. Calculate the gap as the
percentage deviation of output from the potential level of output. Calculate the average
value over the most recent four quarters of data available.
c. For the most recent 12 months of data available, calculate the average unemployment
gap, using 5.6% as the presumed natural rate of unemployment. Based on your answers
to parts (a) through (c), does the divine coincidence apply to the current economic
situation? Why or why not? What does your answer imply about the sources of shocks
that have impacted the current economy? Briefly explain.
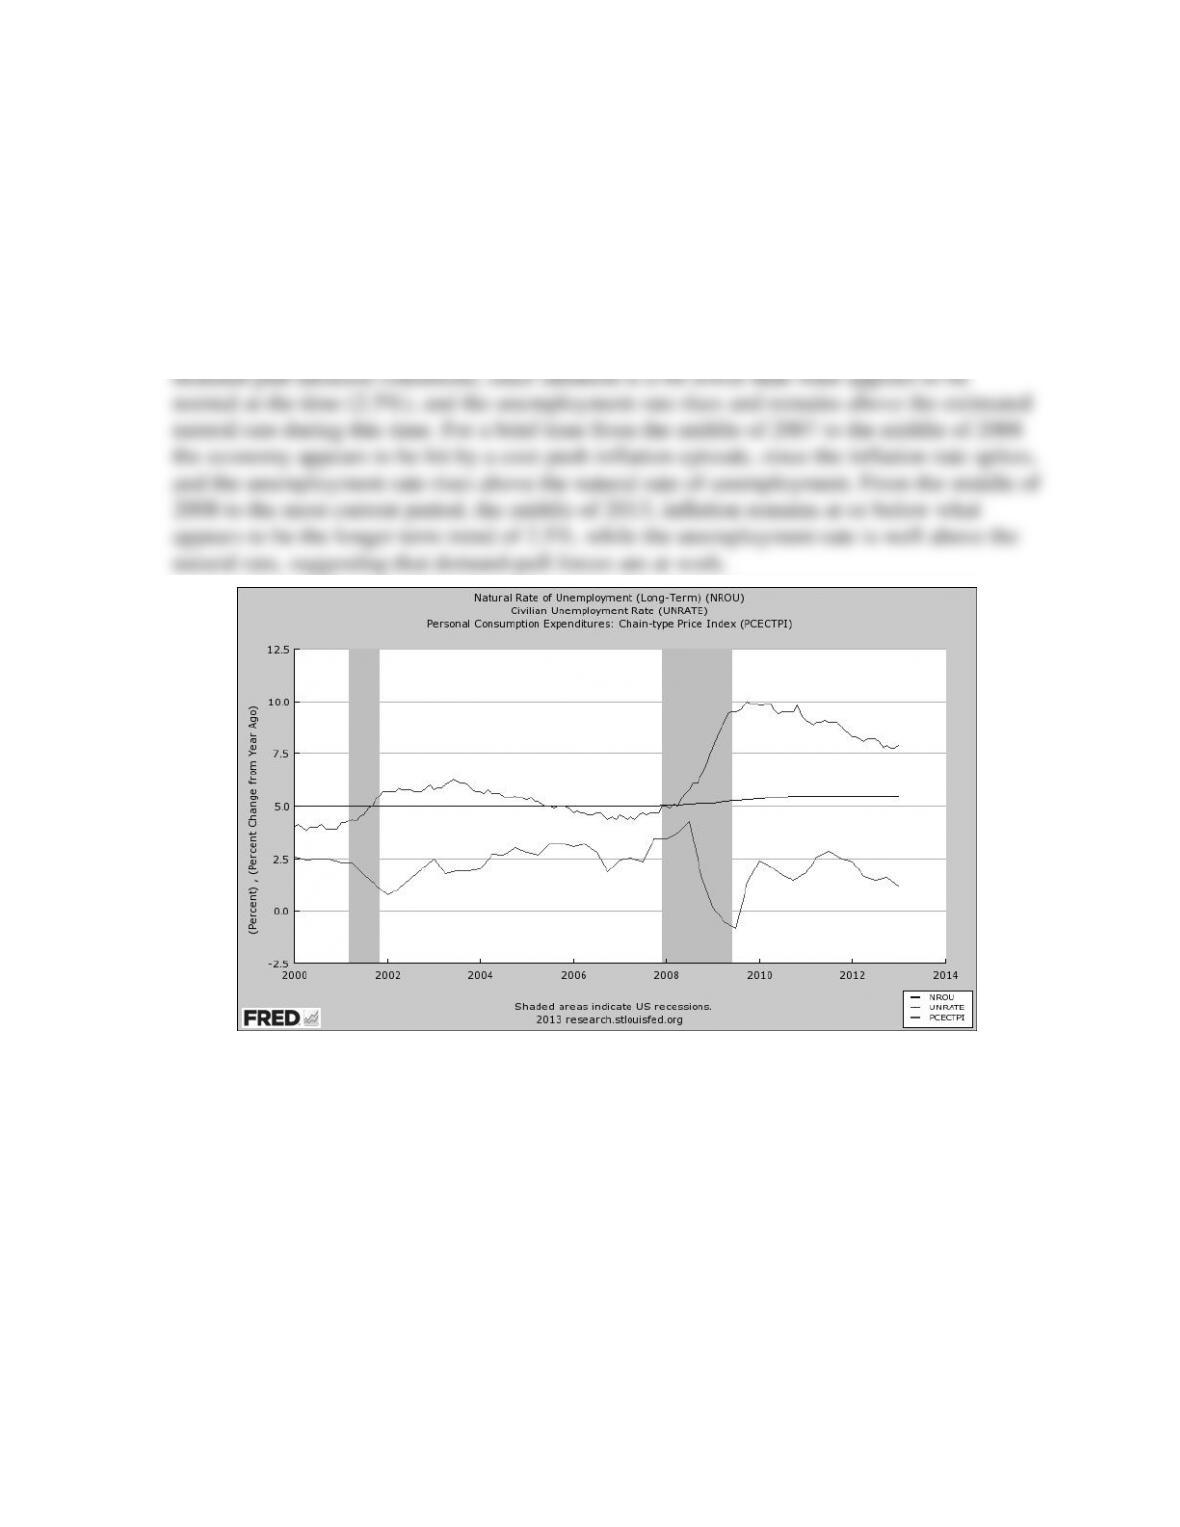
2. Go to the St. Louis Federal Reserve FRED database, and find data on the personal
consumption expenditure price index (PCECTPI), the unemployment rate (UNRATE), and an
estimate of the natural rate of unemployment (NROU). For the price index, adjust the units
setting to “Percent Change From Year Ago.” Select the data from 2000 through the most
current data available, download the data, and plot all three variables on the same graph.
Using your graph, identify periods of demand-pull or cost-push movements in the inflation
rate. Briefly explain your reasoning.
The period from around early 2001 to around the end of 2003 appears to be influenced by