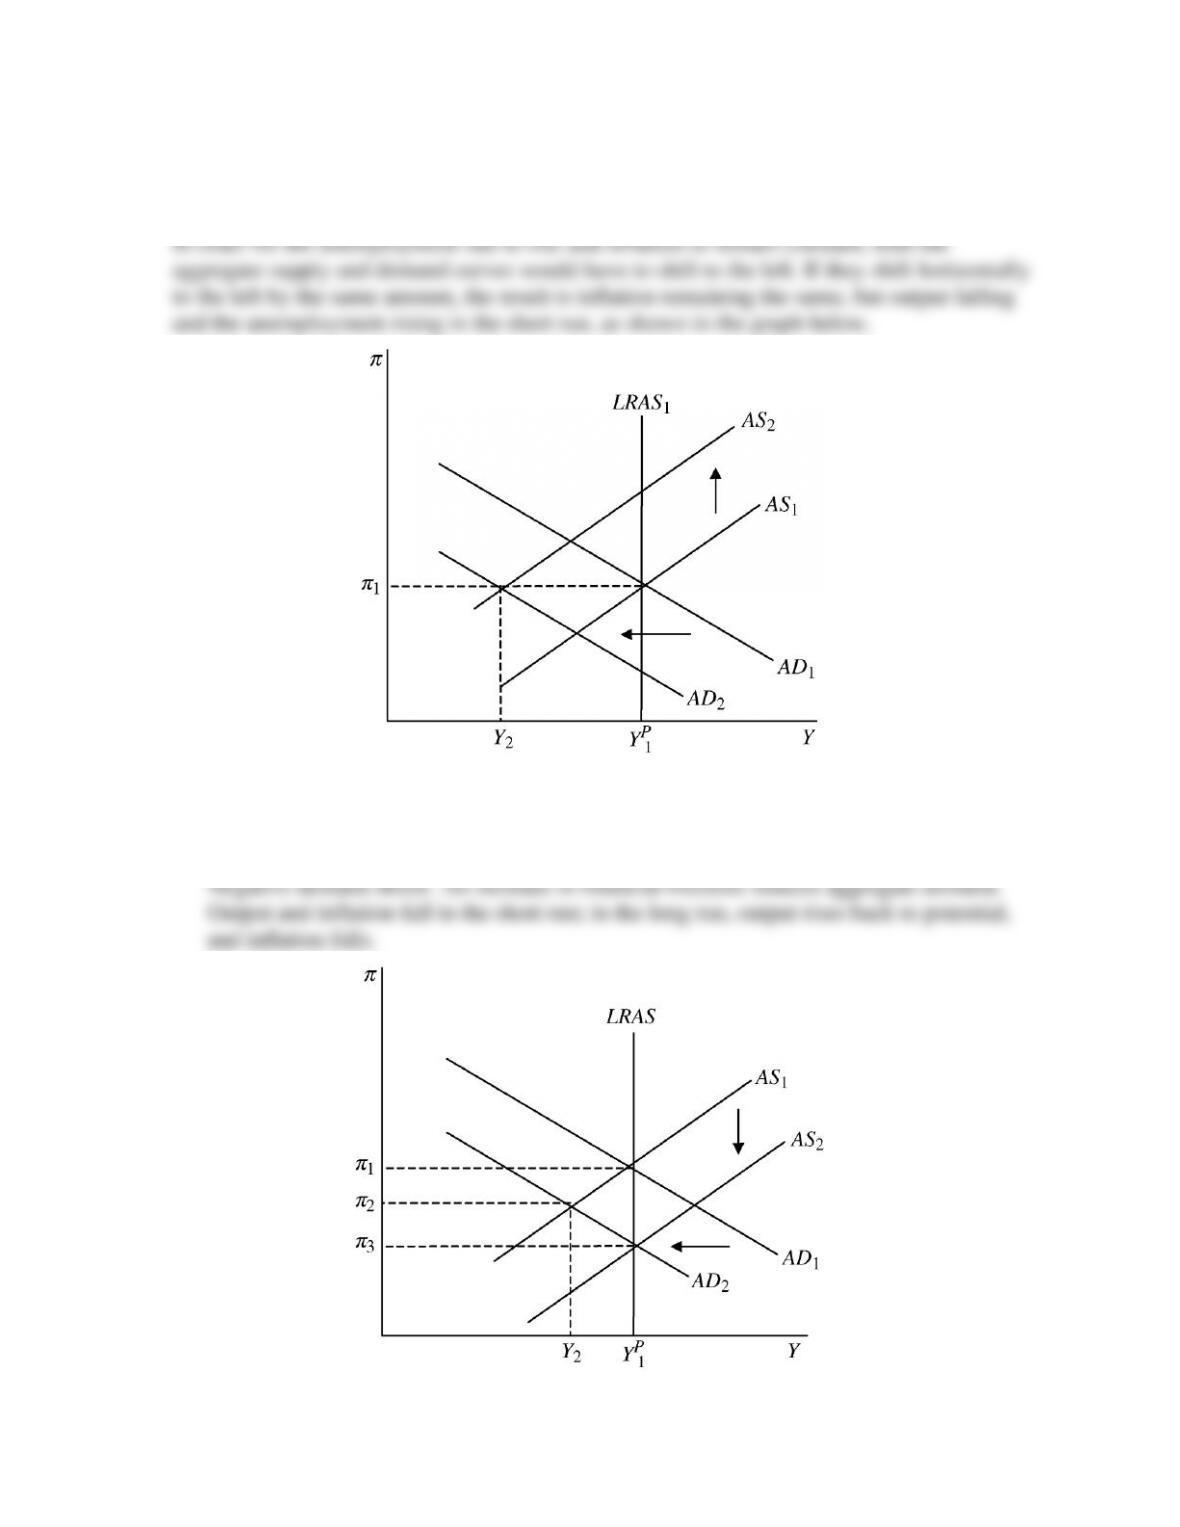
23. Suppose the inflation rate remains relatively constant while output decreases and the
unemployment rate increases. Using an aggregate demand and supply graph, show how this
scenario is possible.
24. Classify each of the following as a supply shock or a demand shock. Use a graph to show the
effects on inflation and output in the short run and in the long run.
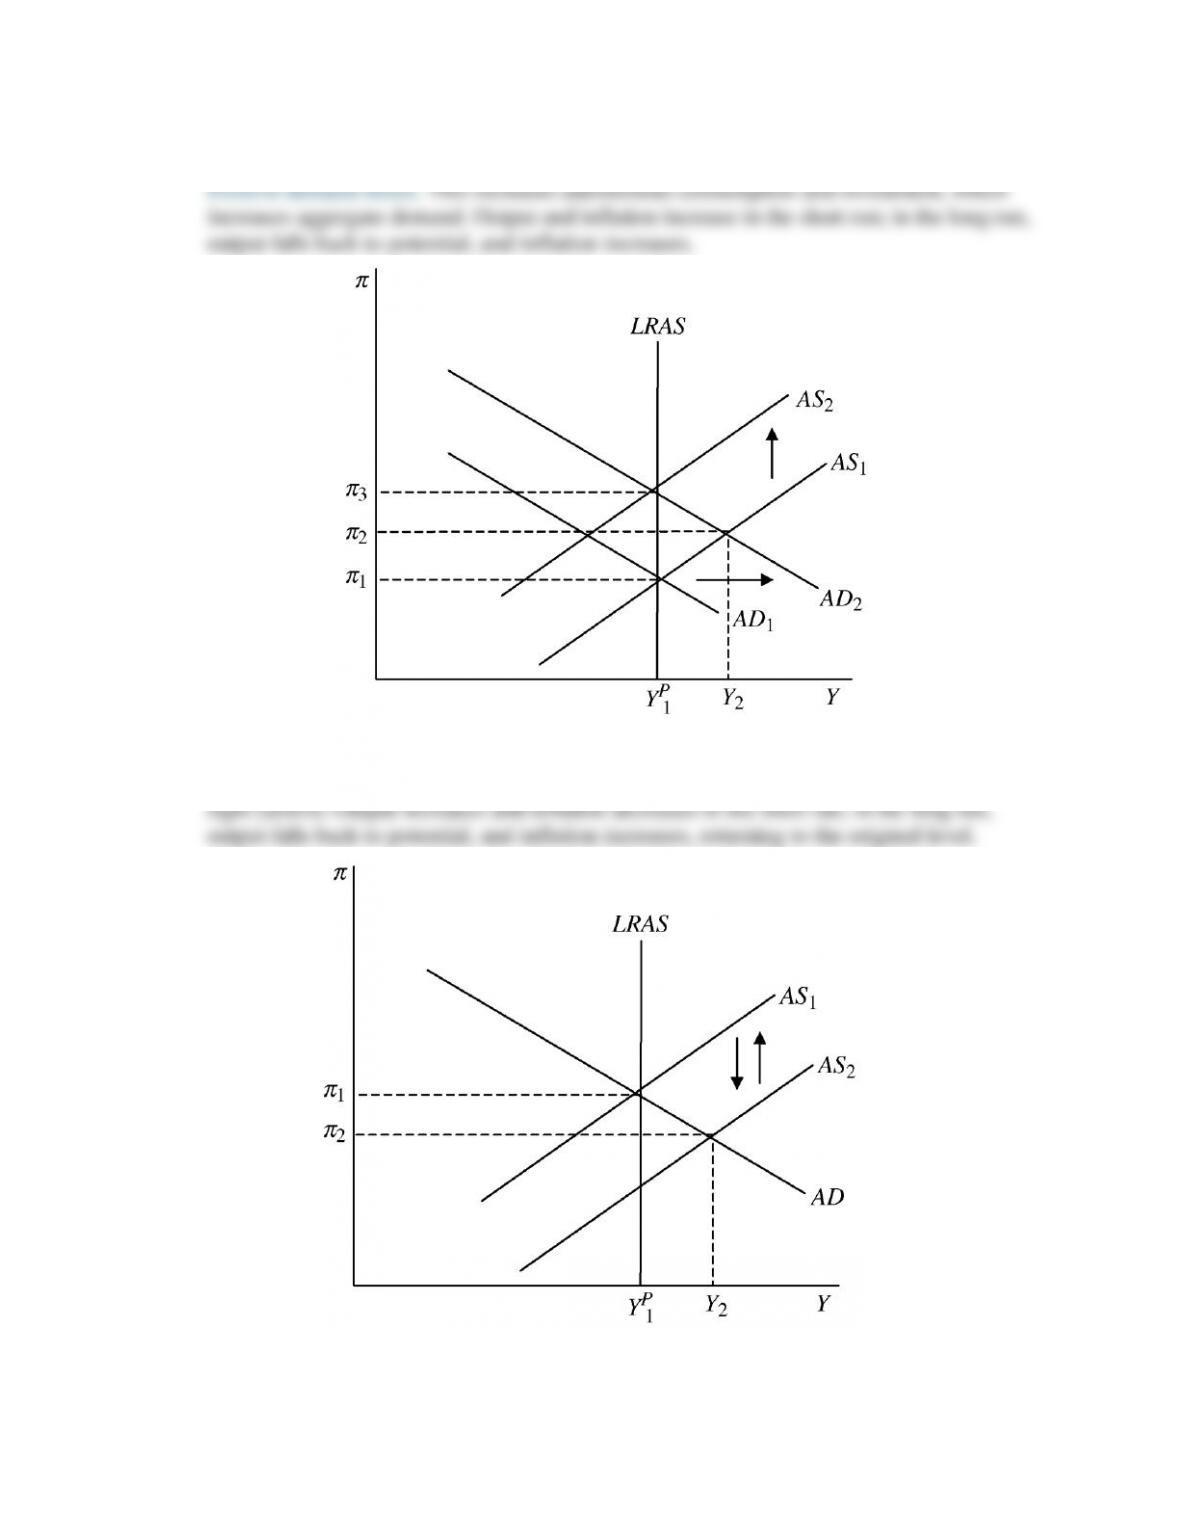
a. Financial frictions increase.
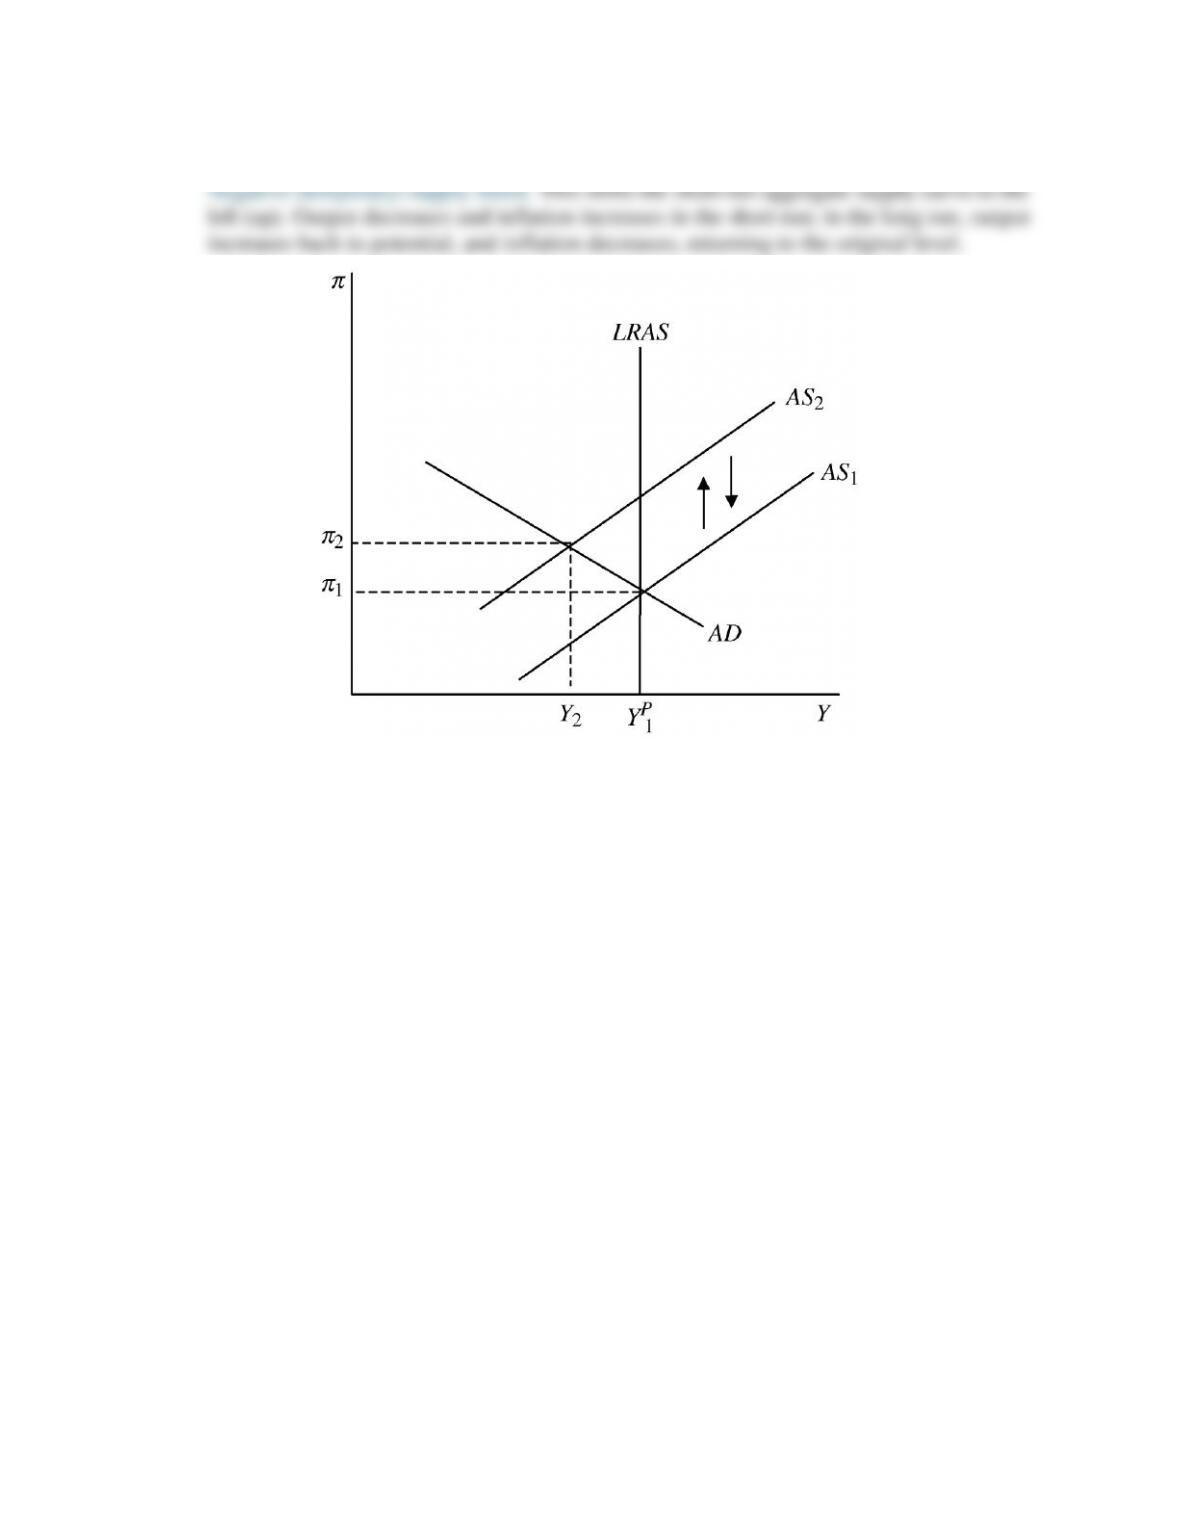
b. Households and firms become more optimistic about the economy.
c. Favorable weather produces a record crop of wheat and corn in the Midwest.
Positive (temporary) supply shock. This shifts the short-run aggregate supply curve to the
d. Auto workers go on strike for four months.
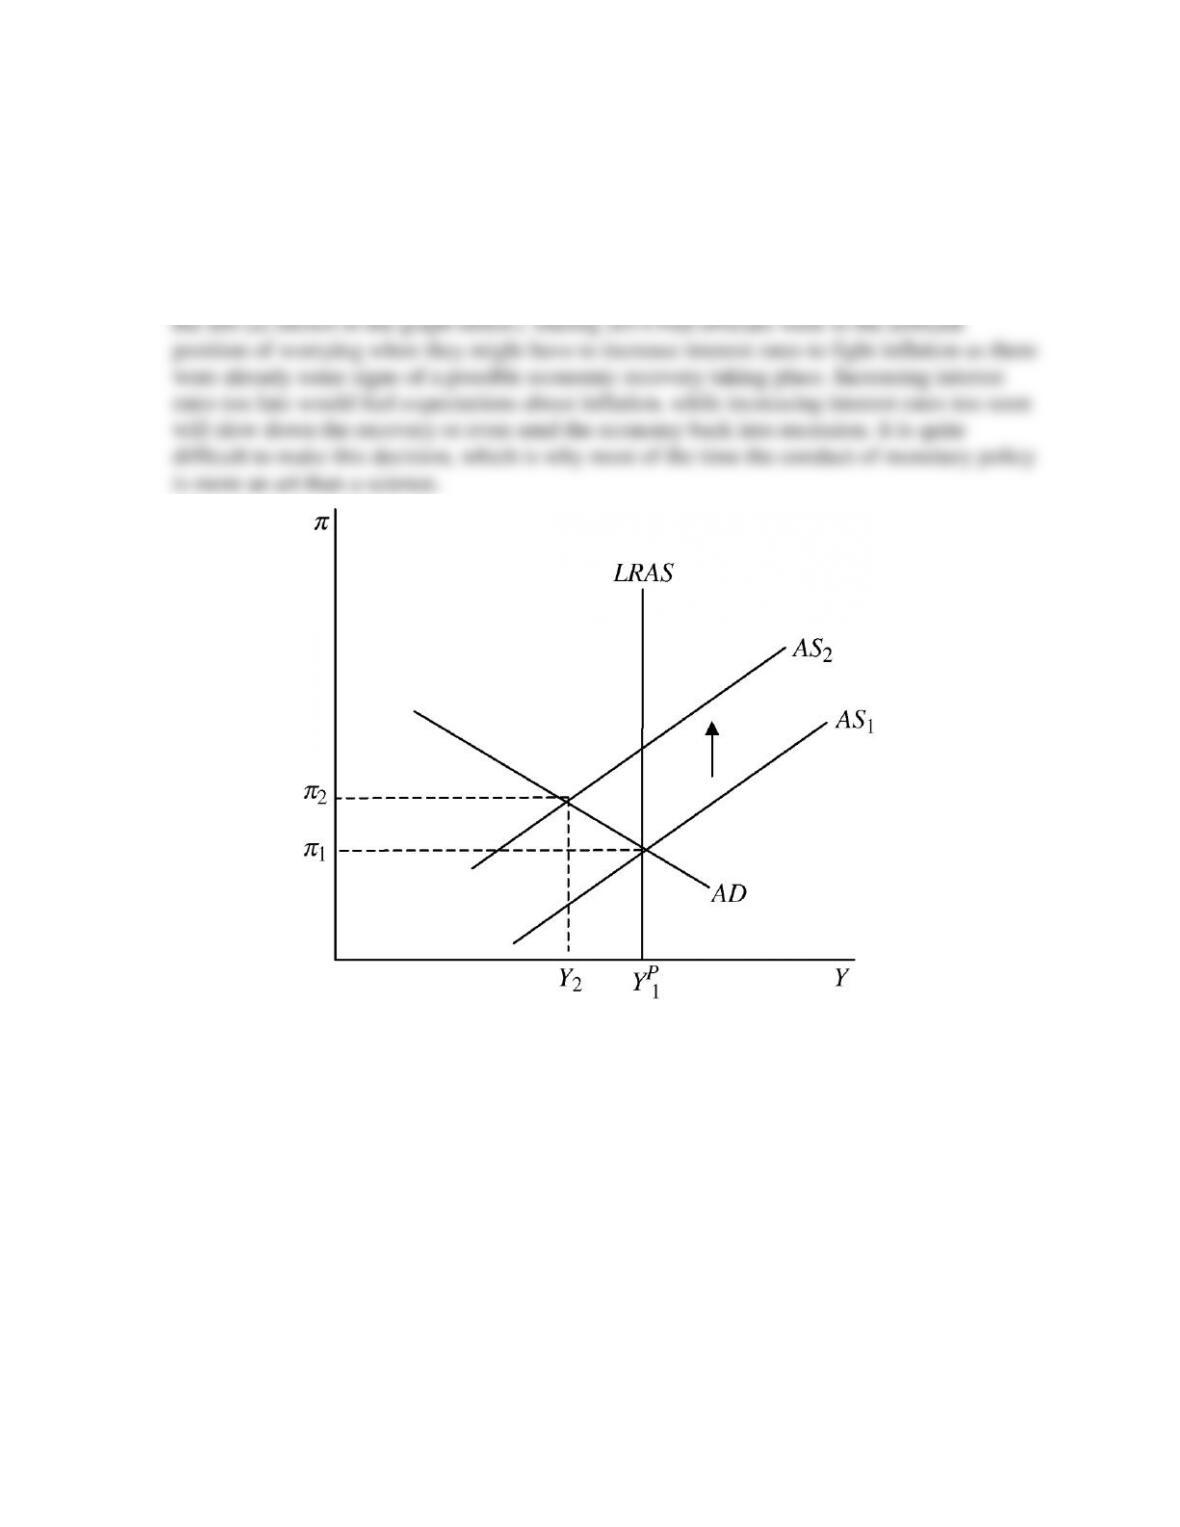
25. During 2014, some Fed officials discussed the possibility of increasing interest rates as a
way of fighting potential increases in expected inflation. If the public came to expect higher
inflation rates in the future, what would be the effect on the short-run aggregate supply
curve? Use an aggregate demand and supply graph to illustrate your answer.
If the public assumes that the current Fed officials are not that worried about inflation,
expected inflation will increase, shifting the short-run aggregate supply curve upward and to
ANSWERS TO DATA ANALYSIS PROBLEMS
1. Go to the St. Louis Federal Reserve FRED database, and find data on real government
spending (GCEC1), real GDP (GDPC1), taxes (W006RC-1Q027SBEA), and the personal
consumption expenditure price index (PCECTPI), a measure of the price level. Download all
of the data into a spreadsheet, and convert the tax data series into real taxes. To do this, for
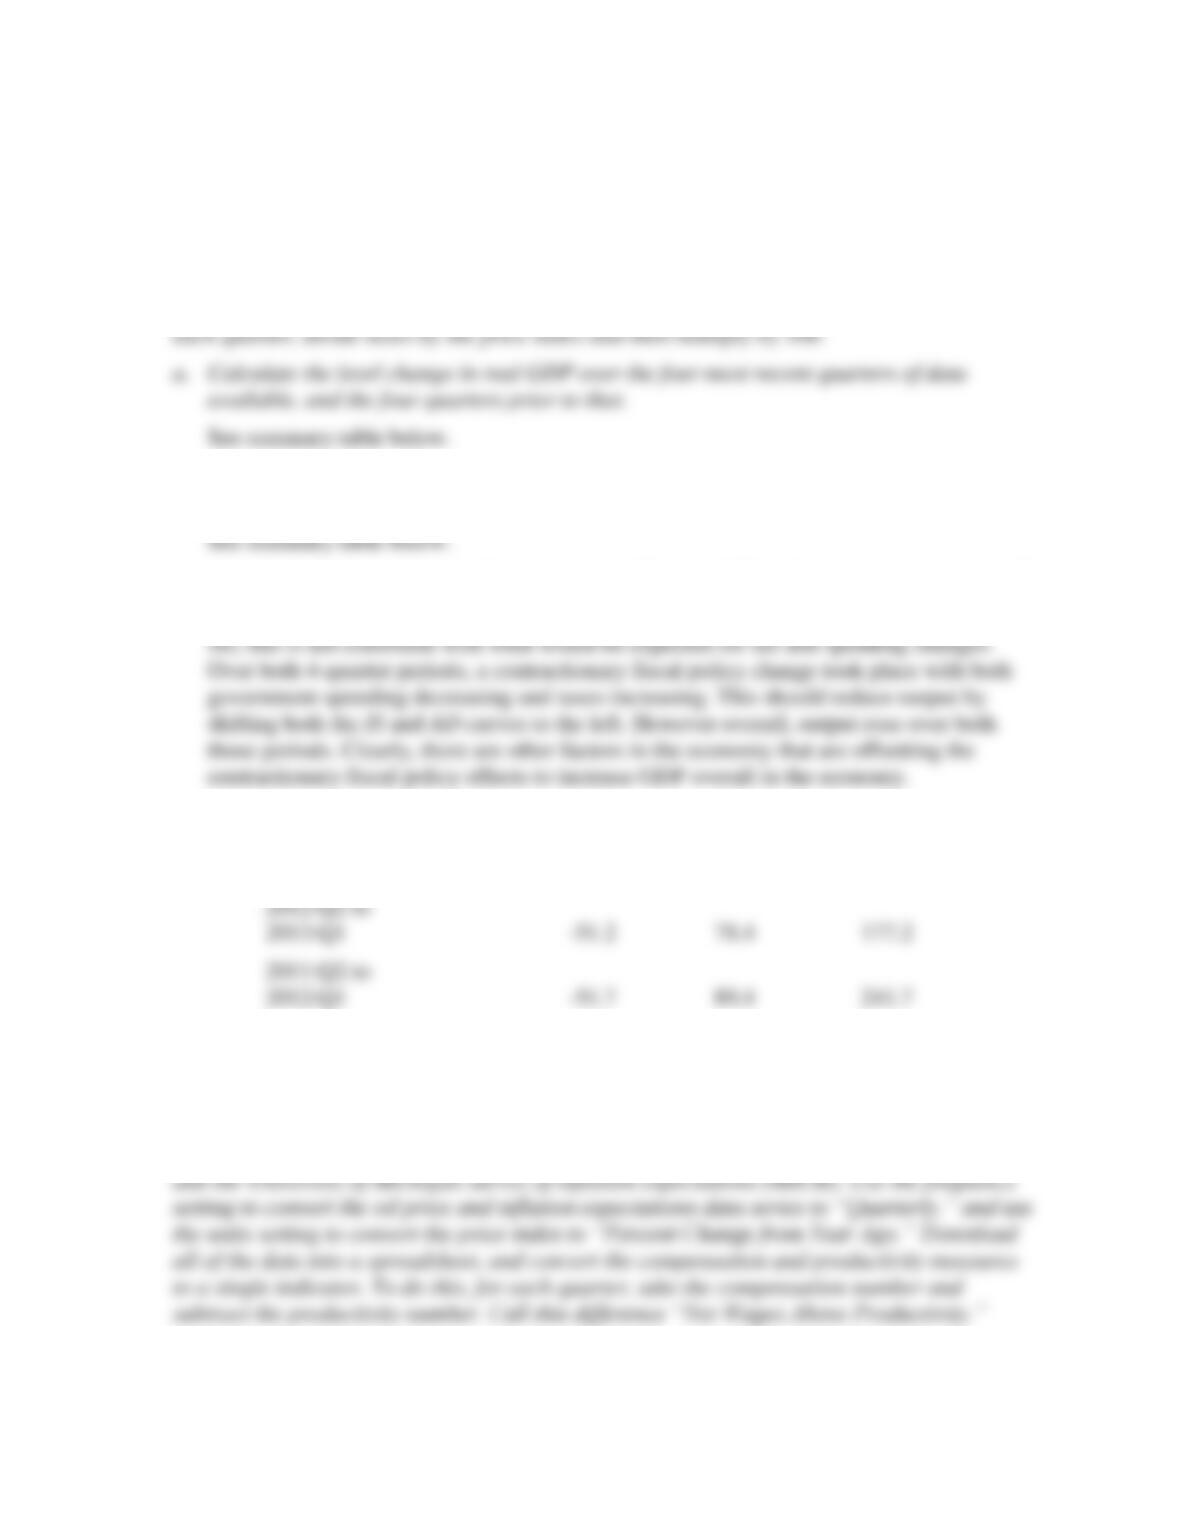
b. Calculate the level change in real government spending and real taxes over the four most
recent quarters of data available, and the four quarters prior to that.
c. Are your results consistent with what you would expect? How do your answers to part (b)
help explain, if at all, your answer to part (a)? Explain using the IS and AD curves.
Government
Spending
Change, $ Bil.
Tax
Change, $
Bil.
Output
Change, $ Bil.
2012:Q2 to
2013:Q1
-51.2
78.4
177.2
2011:Q2 to
2012:Q1
-51.7
89.4
241.7
2. Go to the St. Louis Federal Reserve FRED database, and find data on the personal
consumption expenditure price index (PCECTPI), a measure of the price level; real
compensation per hour (COM-PRNFB); the nonfarm business sector real output per hour
(OPHNFB), a measure of worker productivity; the price of a barrel of oil (MCOILWTICO);
a. Calculate the change in the inflation rate over the four most recent quarters of data
available, and the four quarters prior to that.
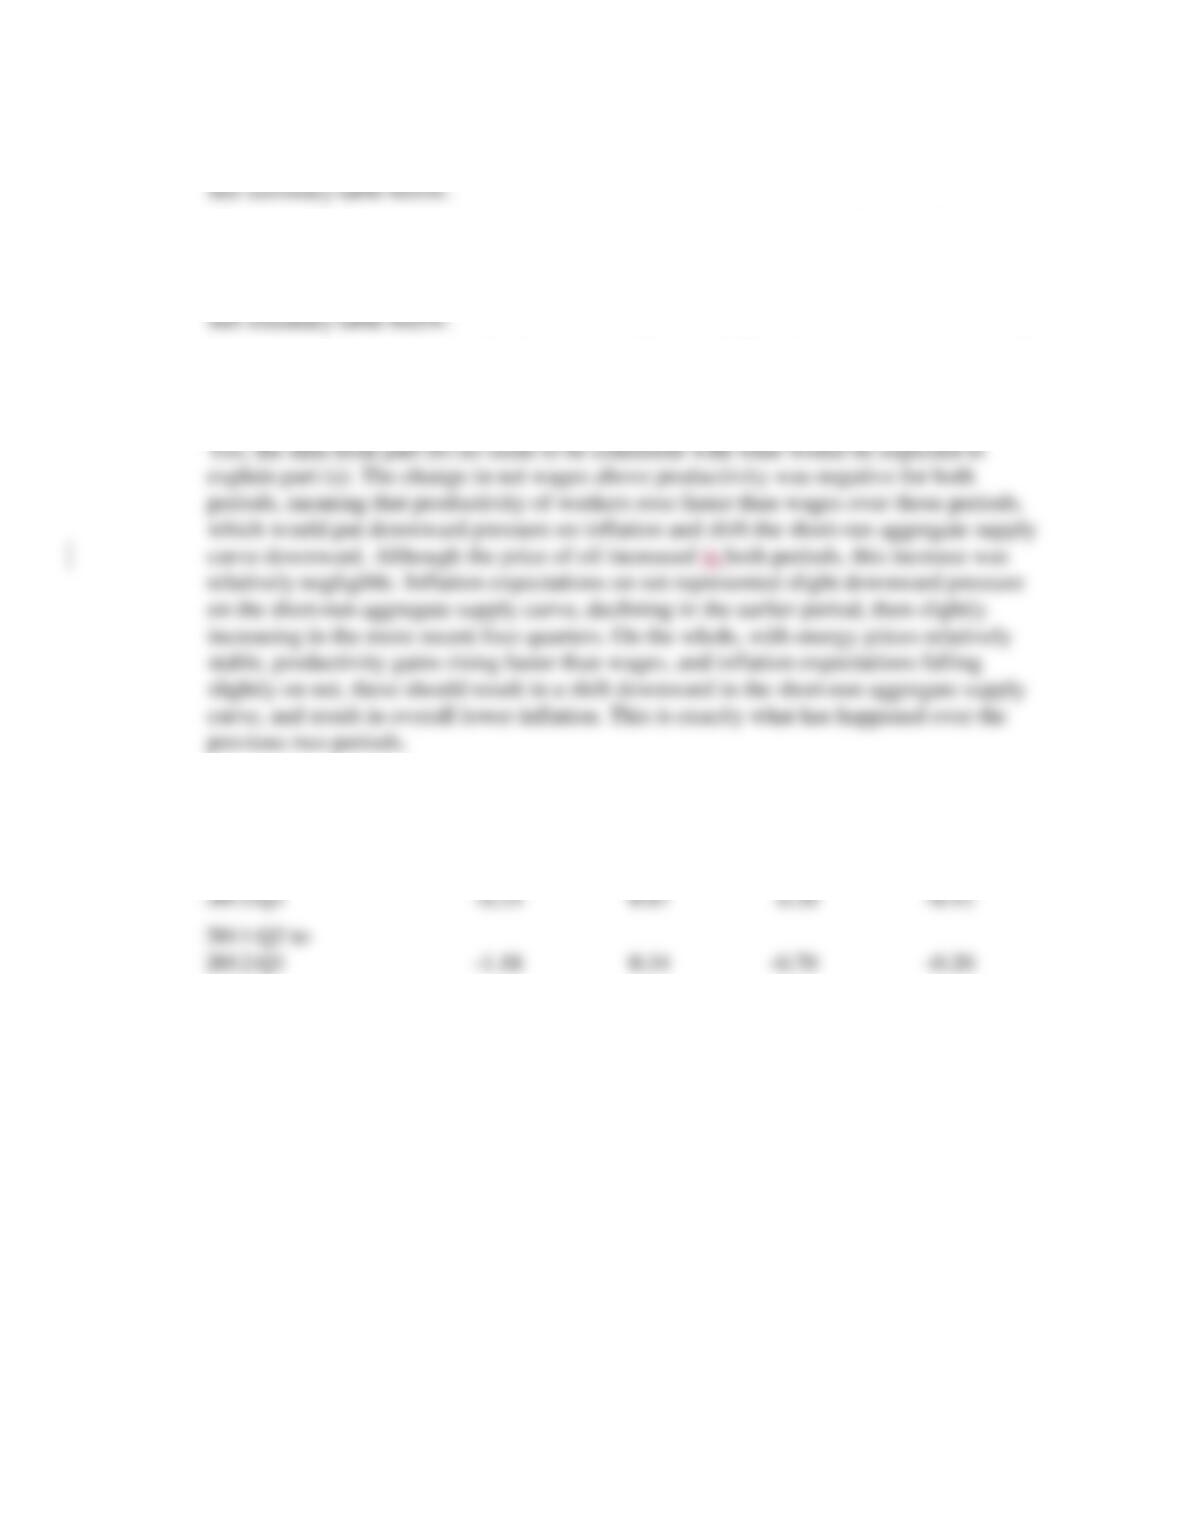
b. Calculate the changes in net wages above productivity, the price of oil, and inflation
expectations over the four most recent quarters of data available, and the four quarters
prior to that.
c. Are your results consistent with what you would expect? How do your answers to part (b)
help explain, if at all, your answer to part (a)? Explain using the short-run aggregate
supply curve.
Change, Net
Wages
Above Prod.
Change, Oil
Price
$/Barrel
Inflation
Expectations,
Change
Inflation Rate,
Change
2012:Q2 to
2013:Q1
-0.24
0.87
0.20
-0.42
2011:Q2 to
2012:Q1
-1.18
0.34
-0.70
-0.20