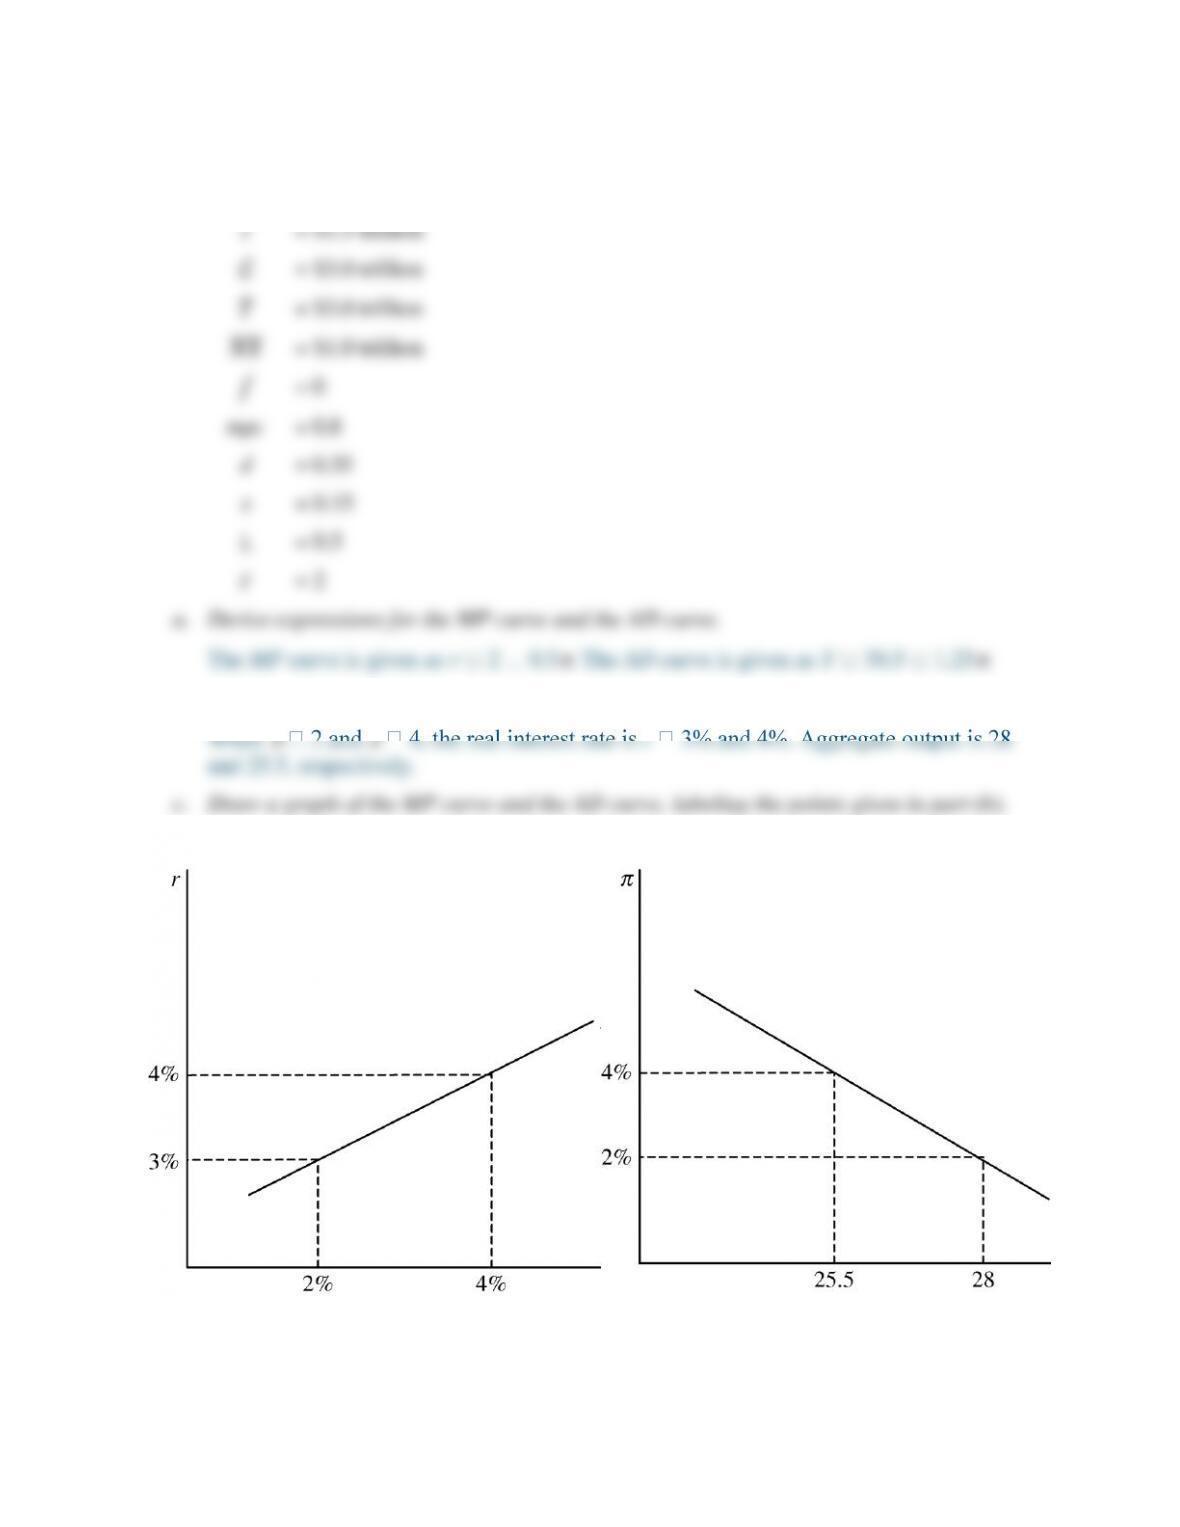
22. Consider an economy described by the following:
𝐶
= $4 trillion
𝐼
= $1.5 trillion
𝐺
= $3.0 trillion
𝑇
= $3.0 trillion
𝑁𝑋
= $1.0 trillion
𝑓
= 0
mpc
= 0.8
d
= 0.35
x
= 0.15
= 0.5
r
= 2
a. Derive expressions for the MP curve and the AD curve.
b. Calculate the real interest rate and aggregate output when
= 2 and
= 4.
Graphs are shown below.
23. Consider an economy described by the following:
𝐶
= $3.25 trillion
𝐼
= $1.3 trillion
𝐺
= $3.5 trillion
𝑇
= $3.0 trillion
𝑁𝑋
= -$1.0 trillion
𝑓
= 1
mpc
= 0.75
d
= 0.3
x
= 0.1
= 1
r
= 1
a. Derive expressions for the MP curve and the AD curve.
consumption, planned investment, and net exports.
c. Suppose the Fed increases
r
to
r
= 2. Calculate the real interest rate, the equilibrium
r
d. Considering that output, consumption, planned investment, and net exports all decreased
in part (c), why might the Fed choose to increase
r
?
r
24. Consider the economy described in Applied Problem 23.
a. Derive expressions for the MP curve and the AD curve.
c. Suppose government spending increases to $4 trillion. What happens to equilibrium
output?
d. If the Fed wants to keep output constant, then what monetary policy change should it
make?
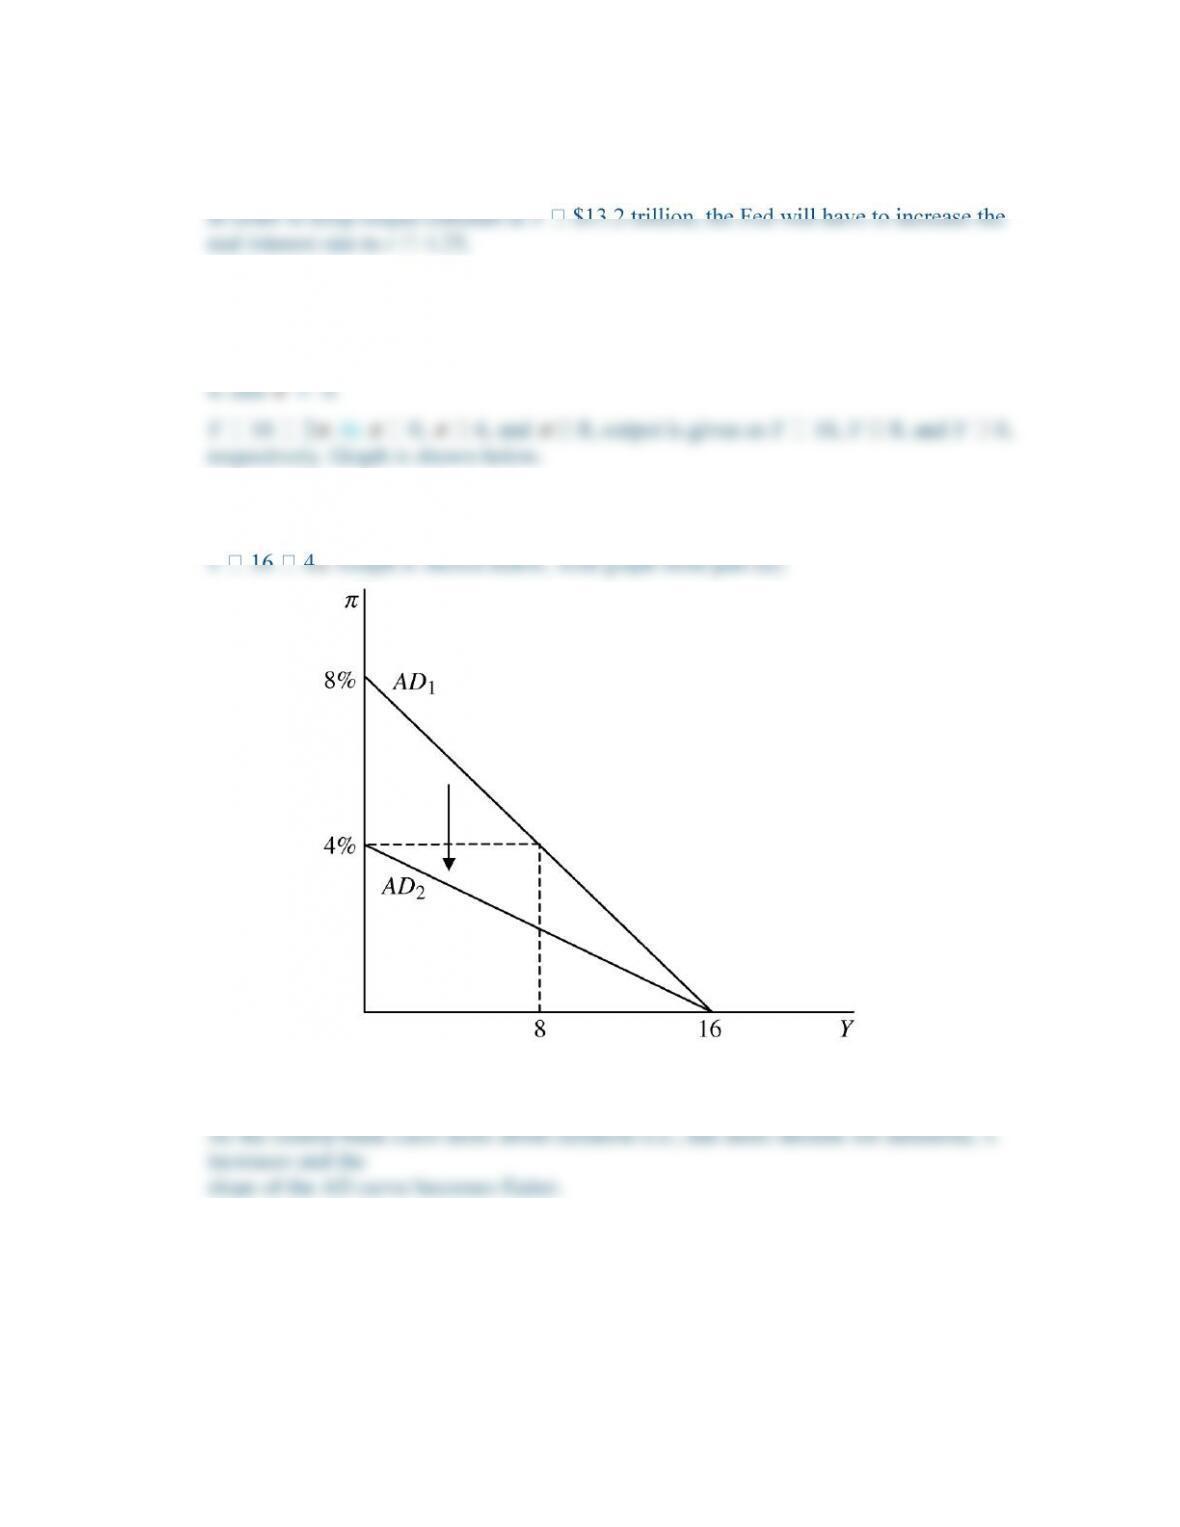
25. Suppose the MP curve is given by r = 2 +
, and the IS curve is given by Y = 20 – 2r.
a. Derive an expression for the AD curve, and draw a graph labeling points at
= 0,
=
b. Suppose that
increases to
= 2. Derive an expression for the new AD curve, and draw
the new AD curve using the graph from part (a).
c. What does your answer to part (b) imply about the relationship between a central bank’s
distaste for inflation and the slope of the AD curve?
ANSWERS TO DATA ANALYSIS PROBLEMS
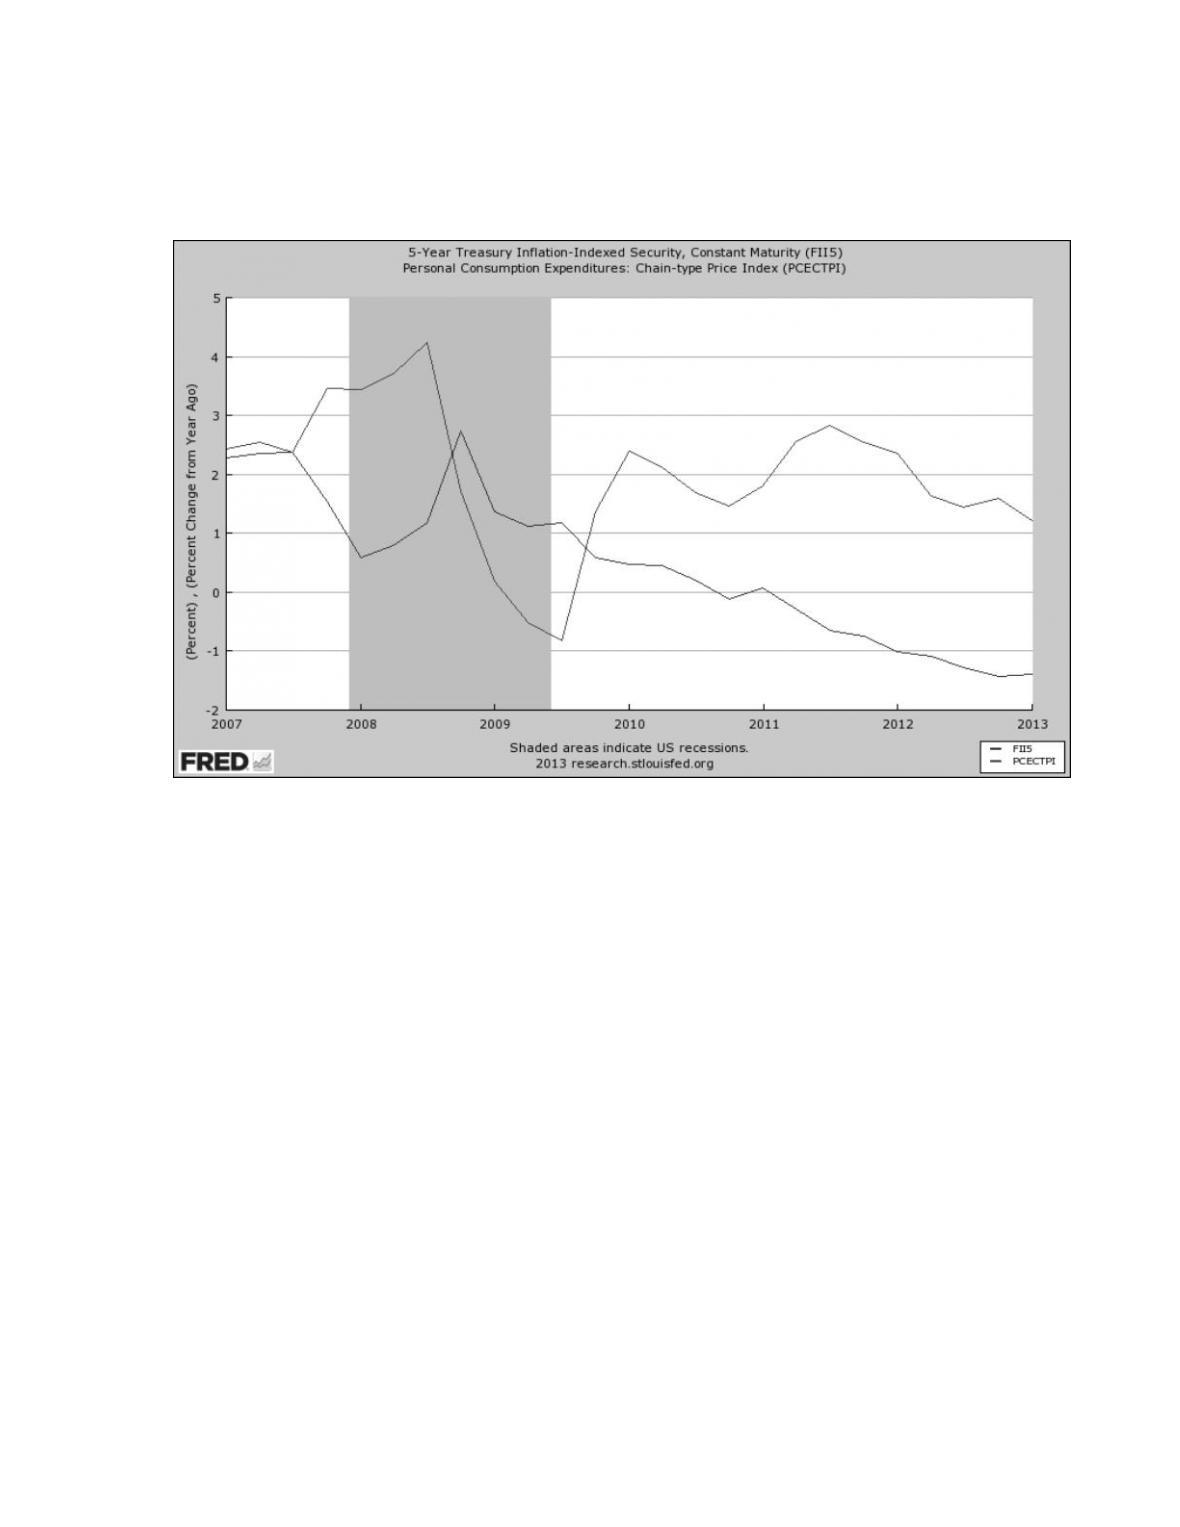
1. A measure of real interest rates can be approximated by the Treasury Inflation-Indexed
Security, or TIIS. Go to the St. Louis Federal Reserve FRED database, and find data on the
five-year TIIS (FII5) and the personal consumption expenditure price index (PCECTPI), a
measure of the price index. Choose “Quarterly” for the frequency setting of the TIIS, and
download both data series. Convert the price index data to annualized inflation rates by
taking the quarter-to-quarter percent change in the price index and multiplying it by 4. Be
sure to multiply by 100 so that your results are percentages.
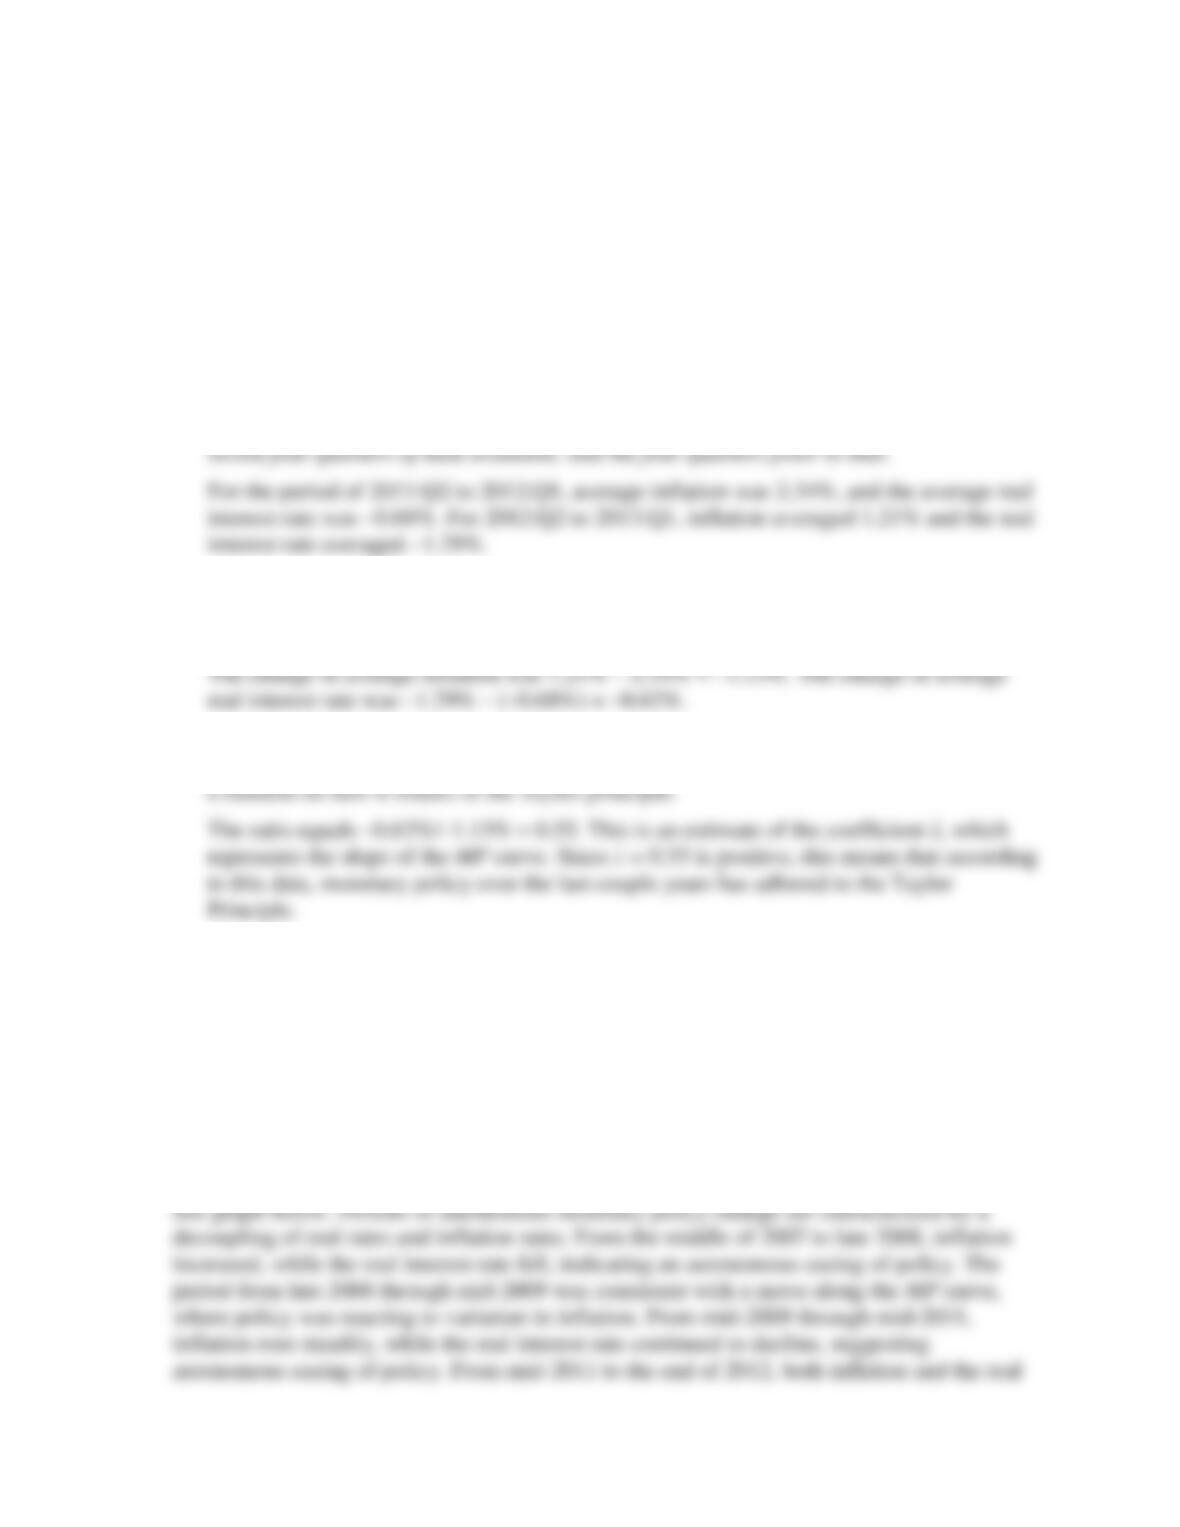
a. Calculate the average inflation rate and the average real interest rate over the most
b. Calculate the change in the average inflation rate between the most recent annual period
and the year prior. Then calculate the change in the average real interest rate over the
same period.
c. Using your answers to part (b), compute the ratio of the change in the average real
interest rate to the change in the average inflation rate. What does this ratio represent?
2. A measure of real interest rates can be approximated by the Treasury Inflation-Indexed
Security, or TIIS. Go to the St. Louis Federal Reserve FRED database, and find data on the
five-year TIIS (FII5) and the personal consumption expenditure price index (PCECTPI), a
measure of the price index. Choose “Quarterly” for the frequency setting for the TIIS, and
choose “Percent Change From Year Ago” for the units setting on (PCECTPI). Plot both
series on the same graph, using data from 2007 through the most current data available. Use
the graph to identify periods of autonomous monetary policy changes. Briefly explain your
reasoning.