20. Suppose that Dell Corporation has 20,000 computers in its warehouses on December 31,
2016, ready to be shipped to merchants (each computer is valued at $500). By December 31,
2017, Dell Corporation has 25,000 computers ready to be shipped, each valued at $450.
a. Calculate Dell’s inventory on December 31, 2016.
b. Calculate Dell’s inventory investment in 2017.
c. What happens to inventory spending during the early stages of an economic recession?
21. If the consumption function is C = 100 + 0.75YD, I = 200, government spending is 200, and
net exports are zero, what will be the equilibrium level of output? What will happen to
aggregate output if government spending rises by 100?
22. If the marginal propensity to consume is 0.75, by how much would government spending
have to rise to increase output by $1,000 billion? By how much would taxes need to decrease
to increase output by $1,000 billion?
23. Assuming both taxes and government spending increase by the same amount, derive an
expression for the effect on equilibrium output.
24. Consider an economy described by the following data:
𝐶
= $3.25 trillion
𝐼
= $1.3 trillion
𝐺
= $3.5 trillion
𝑇
= $3.0 trillion
𝑁𝑋
= – $1.0 trillion
𝑓
= 1
mpc
= 0.75
d
= 0.3
x
= 0.1
a. Derive simplified expressions for the consumption function, the investment function, and
the net export function.
b. Derive an expression for the IS curve.
c. If the real interest rate is r = 2, what is equilibrium output? If r = 5, what is equilibrium
output?
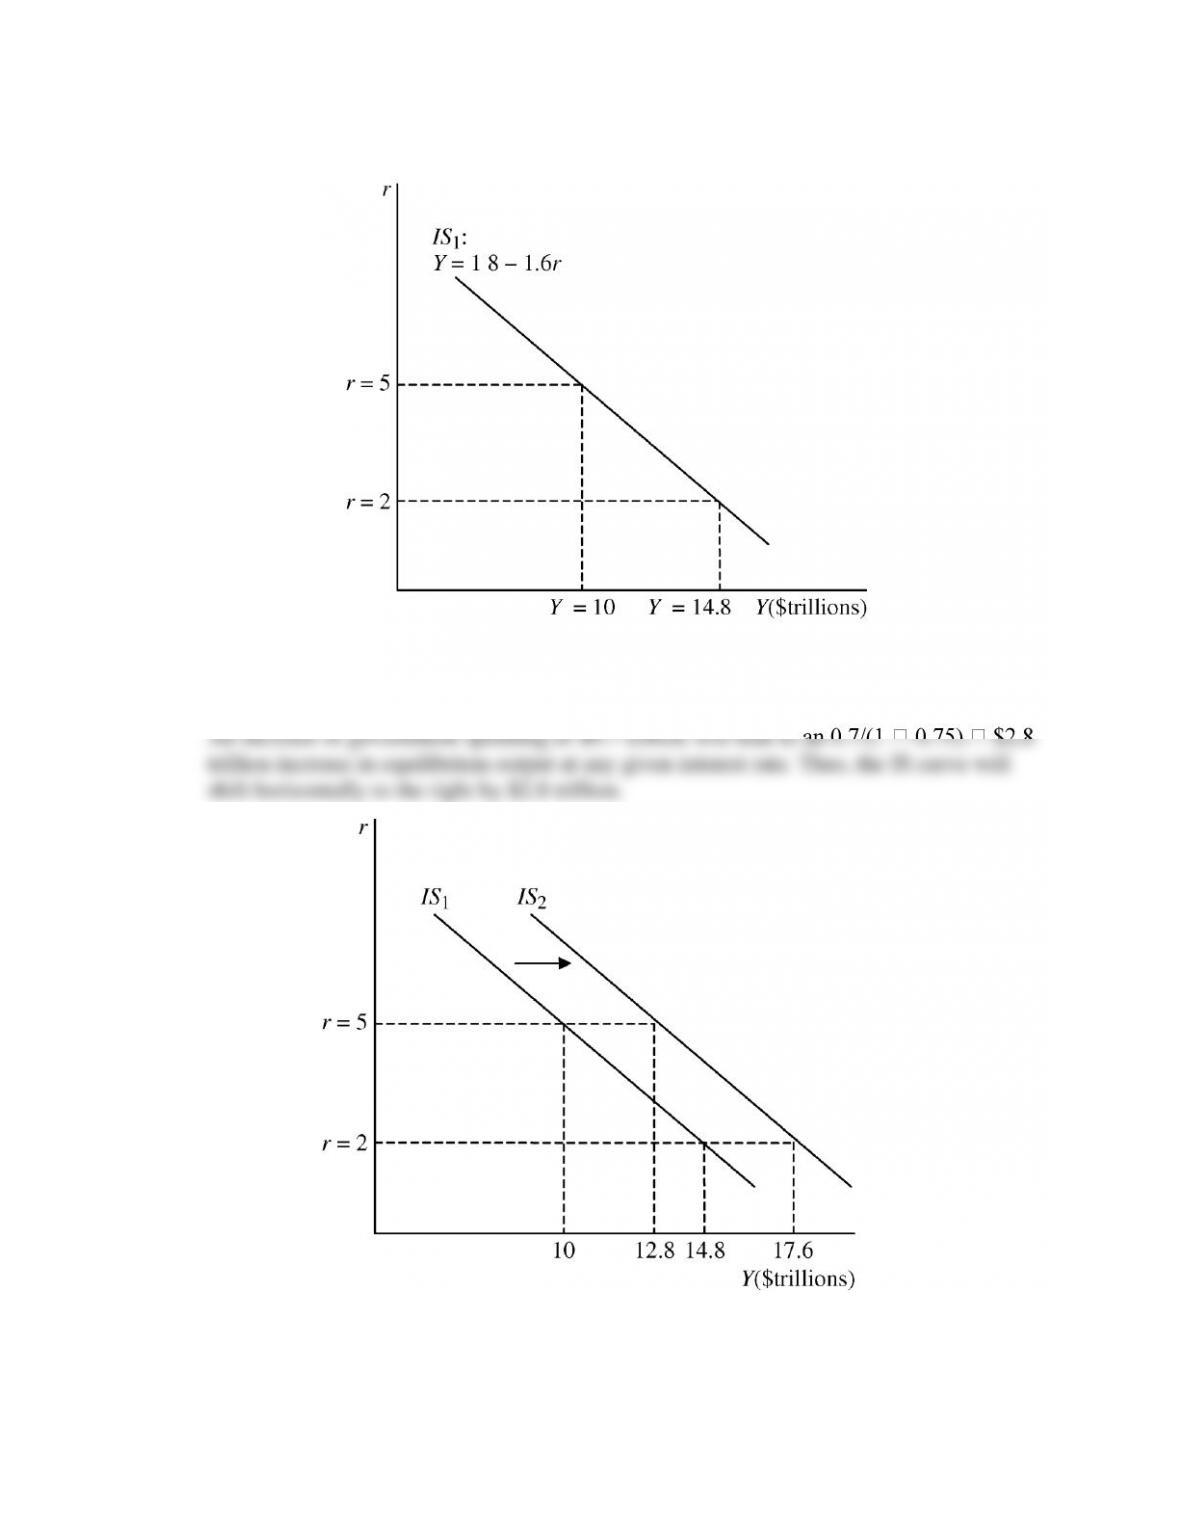
d. Draw a graph of the IS curve showing the answers from part (c) above.
e. If government purchases increase to $4.2 trillion, what will happen to equilibrium output at
r = 2? What will happen to equilibrium output at r = 5? Show the effect of the increase in
government purchases in your graph from part (d).
25. Consider an economy described by the following data:
𝐶
= $3.25 trillion
𝐼
= $1.3 trillion
𝐺
= $3.5 trillion
𝑇
= $3.0 trillion
𝑁𝑋
= – $1.0 trillion
𝑓
= 1
mpc
= 0.75
d
= 0.3
x
= 0.1
a. Derive an expression for the IS curve.
b. Assume that the Federal Reserve controls the interest rate and sets the interest rate at r =
4. What is the equilibrium level of output?
c. Suppose that a financial crisis begins, and 𝑓 increases to 𝑓 = 3. What will happen to
equilibrium output? If the Federal Reserve can set the interest rate, then at what level
should the interest rate be set to keep output from changing?
from r r
d. Suppose the financial crisis causes 𝑓 to increase as indicated in part (c) and also causes
planned autonomous investment to decrease to 𝐼 = $1.1 trillion. Will the change in the
interest rate implemented by the Federal Reserve in part (c) be effective in stabilizing
output? If not, what additional monetary or fiscal policy changes could be implemented
to stabilize output at the original equilibrium output level given in part (b)?
ANSWERS TO DATA ANALYSIS PROBLEMS
1. Go to the St. Louis Federal Reserve FRED database, and find data on Personal Consumption
Expenditures (PCEC), Personal Consumption Expenditures: Durable Goods (PCDG),
Personal Consumption Expenditures: Nondurable Goods (PCND), and Personal
Consumption Expenditures: Services (PCESV).
a. Using the most recent data: What percentage of total household expenditures is devoted
to the consumption of goods (both durable and nondurable goods)?
b. Given these data, which specific component of household expenditures would be most
impacted by a reduction in overall household spending? Explain.
2. Go to the St. Louis Federal Reserve FRED database, and find data on Real Private Domestic
Investment (GPDIC1), a measure of the real interest rate; the 10-year Treasury Inflation-
Indexed Security, TIIS (FII10); and the spread between Baa corporate bonds and the 10-year
U.S. treasury (BAA10YM), a measure of financial frictions. For (FII10) and (BAA10YM),
convert the frequency setting to “quarterly,” and download the data into a spreadsheet. For
each quarter, add the (FII10) and (BAA10YM)series to create ri, the real interest rate for
investments for that quarter. Then calculate the change in both investment and ri as the
change in each variable from the previous quarter.
a. For the eight most recent quarters of data available, calculate the change in investment
from the previous quarter, and then calculate the average change over the eight most
recent quarters.
b. Assume there is a one-quarter lag between movements in ri and changes in investment; in
other words, if ri changes in the current quarter, it will affect investment in the next
quarter. For the eight most recent lagged quarters of data available, calculate the one-
quarter-lagged average change in ri.
c. Take the ratio of your answer from part (a) divided by your answer from part (b). What
does this value represent? Briefly explain.
coefficient on the investment function; that is, for every one percentage point increase in
d. Repeat parts (a) through (c) for the period 2008:Q3 to 2009:Q2. How do financial
frictions help explain the behavior of investment during the financial crisis? How do the
coefficients on investment compare between the current period and the financial crisis
period? Briefly explain.