d. Potential output declines while actual output remains unchanged.
e. The Fed revises its (implicit) inflation target downward.
ANSWERS TO APPLIED PROBLEMS
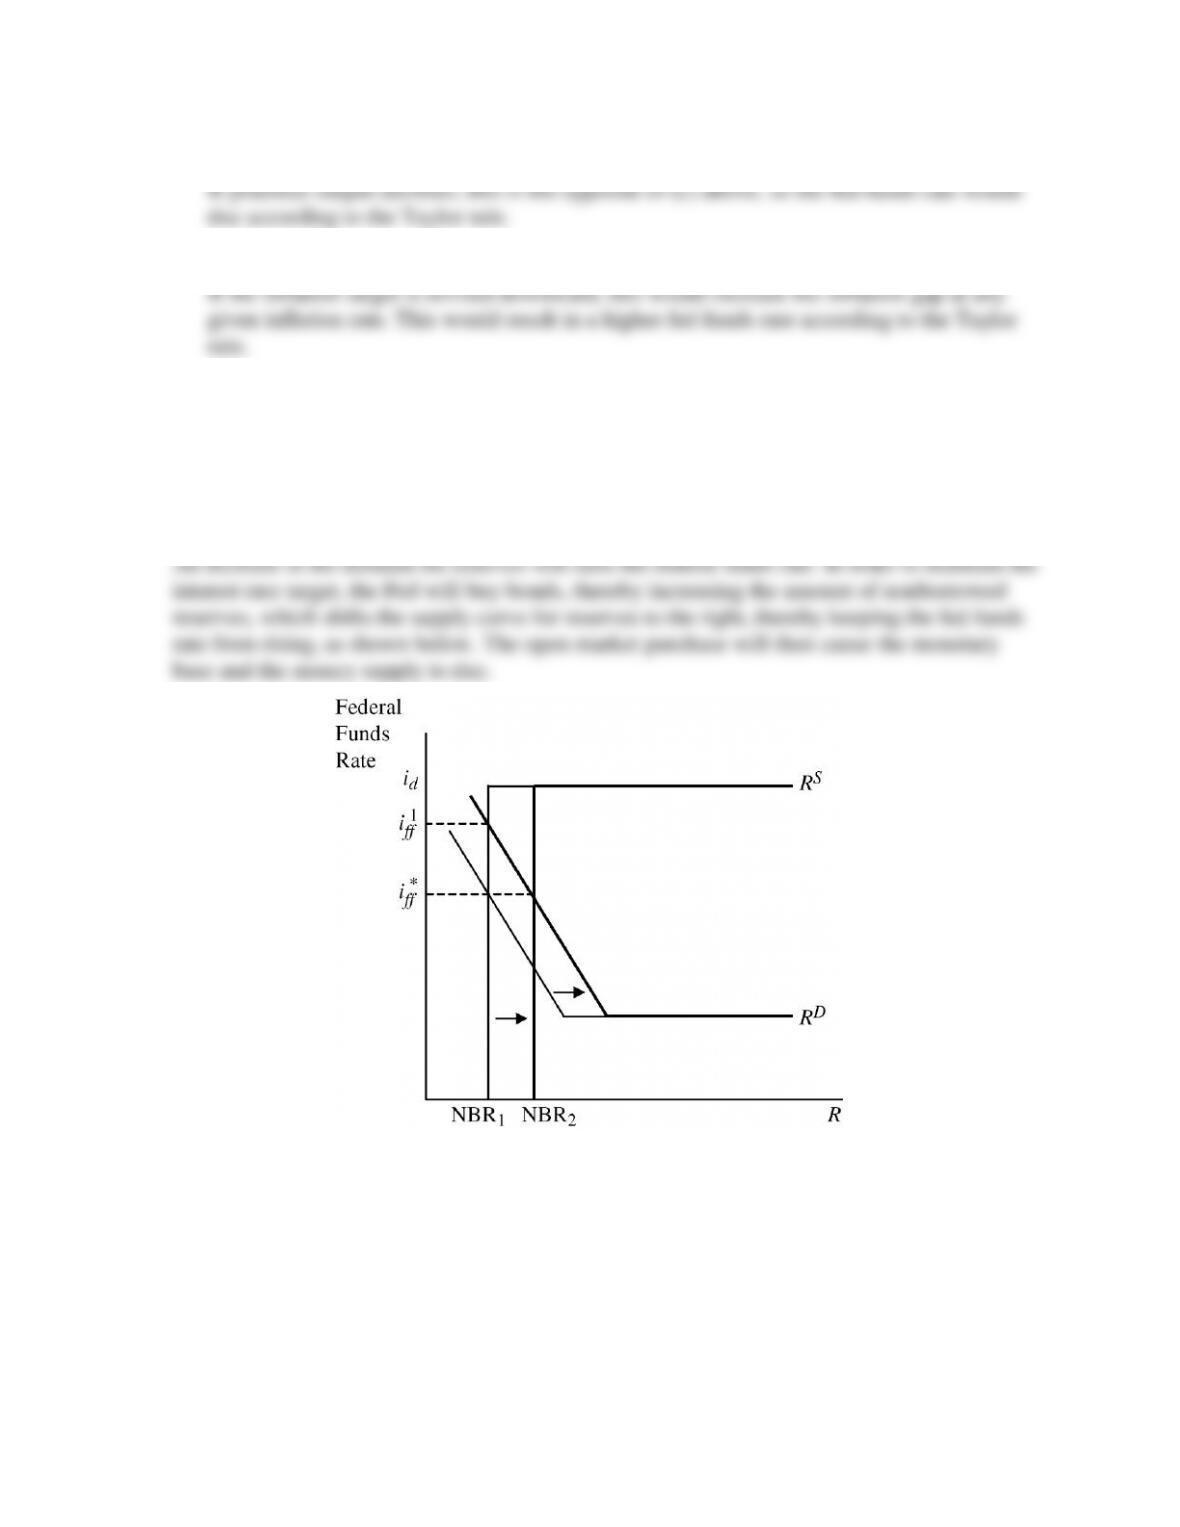
24. If the Fed has an interest-rate target, why will an increase in the demand for reserves lead to a
rise in the money supply? Use a graph of the market for reserves to explain.
25. Since monetary policy changes made through the fed funds rate occur with a lag,
policymakers are usually more concerned with adjusting policy according to changes in the
forecasted or expected inflation rate, rather than the current inflation rate. In light of this,
suppose that monetary policymakers employ the Taylor rule to set the fed funds rate, where
the inflation gap is defined as the difference between expected inflation and the target
inflation rate. Assume that the weights on both the inflation and output gaps are ½ the
equilibrium real fed funds rate is 2%, the inflation rate target is 2%, and the output gap is
1%.
a. If the expected inflation rate is 4%, then at what target should the fed funds rate be set
according to the Taylor rule?
b. Suppose half of Fed economists forecast inflation to be 3%, and half of Fed economists
forecast inflation to be 5%. If the Fed uses the average of these two forecasts as its
measure of expected inflation, then at what target should the fed funds rate be set
according to the Taylor rule?
e
c. Now suppose half of Fed economists forecast inflation to be 0%, and half forecast
inflation to be 8%. If the Fed uses the average of these two forecasts as its measure of
expected inflation, then at what target should the fed funds rate be set according to the
Taylor rule?
e
d. Given your answers to parts (a)–(c) above, do you think it is a good idea for monetary
policymakers to use a strict interpretation of the Taylor rule as a basis for setting policy?
Why or why not?
Probably not. In the situation in part (a), it is assumed that there is very little uncertainty
ANSWERS TO DATA ANALYSIS PROBLEMS
1. The Fed’s maximum employment mandate is generally interpreted as an attempt to achieve
an unemployment rate that is as close as possible to the natural rate and inflation that is
close to its 2% goal for personal consumption expenditure price inflation. Go to the St. Louis
Federal Reserve FRED database, and find data on the personal consumption expenditure
price index (PCECTPI), the unemployment rate (UNRATE), and a measure of the natural
rate of unemployment (NROU). For the price index, adjust the units setting to “Percent
Change From Year Ago” to convert the data to the inflation rate; for the unemployment rate,
change the frequency setting to “Quarterly.” Download the data into a spreadsheet.
Calculate the unemployment gap and inflation gap for each quarter. Then, using the inflation
gap, create an average inflation gap measure by taking the average of the current inflation
gap and the gaps for the previous three quarters. Now apply the following (admittedly
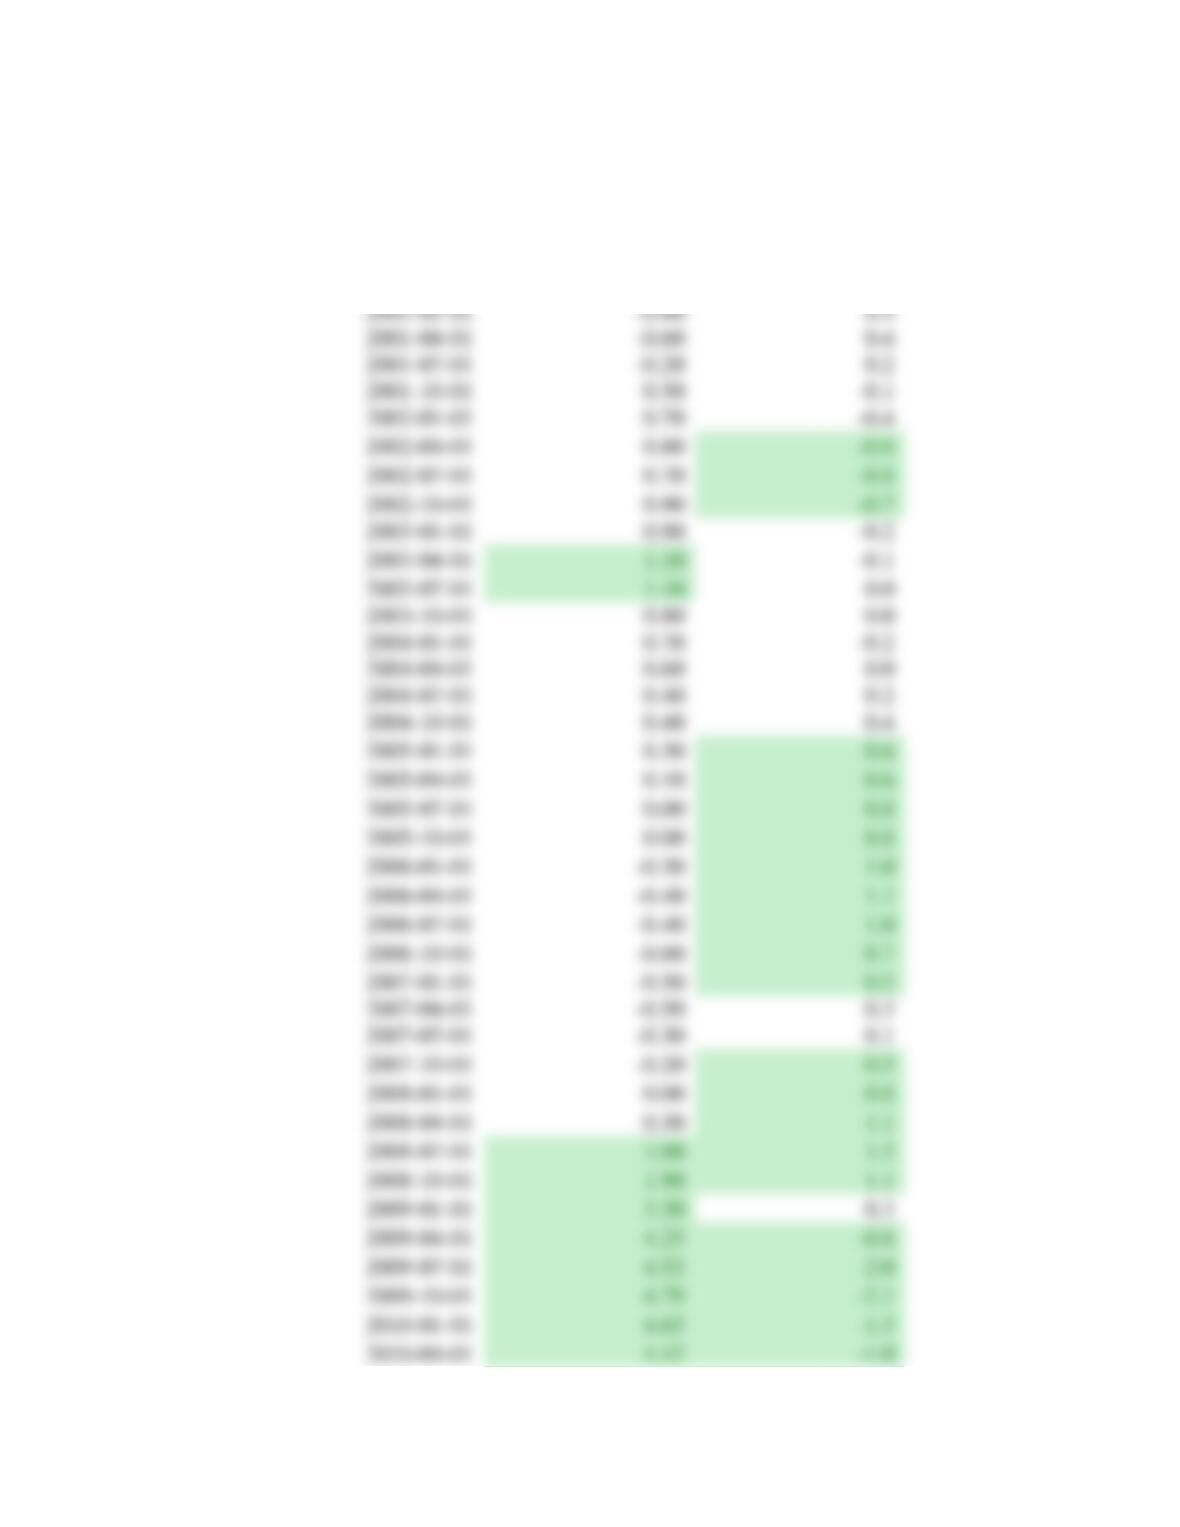
arbitrary and ad hoc) test to the data from 2000:Q1 through the most recent data available:
If the unemployment gap is larger than 1.0 for two or more consecutive quarters, and/ or the
average inflation gap is larger in absolute value than 0.5 for two or more consecutive
quarters, consider the mandate “violated.”
a. Based on this ad hoc test, in which quarters has the Fed “violated” the price stability
portion of its mandate? In which quarters has the Fed “violated” the maximum
employment mandate?
b. Is the Fed currently “in violation” of its mandate?
c. Interpret your results. What do your response to part (a) and the data imply about the
challenge that monetary policymakers face in achieving the Fed’s mandate perfectly at
all times?
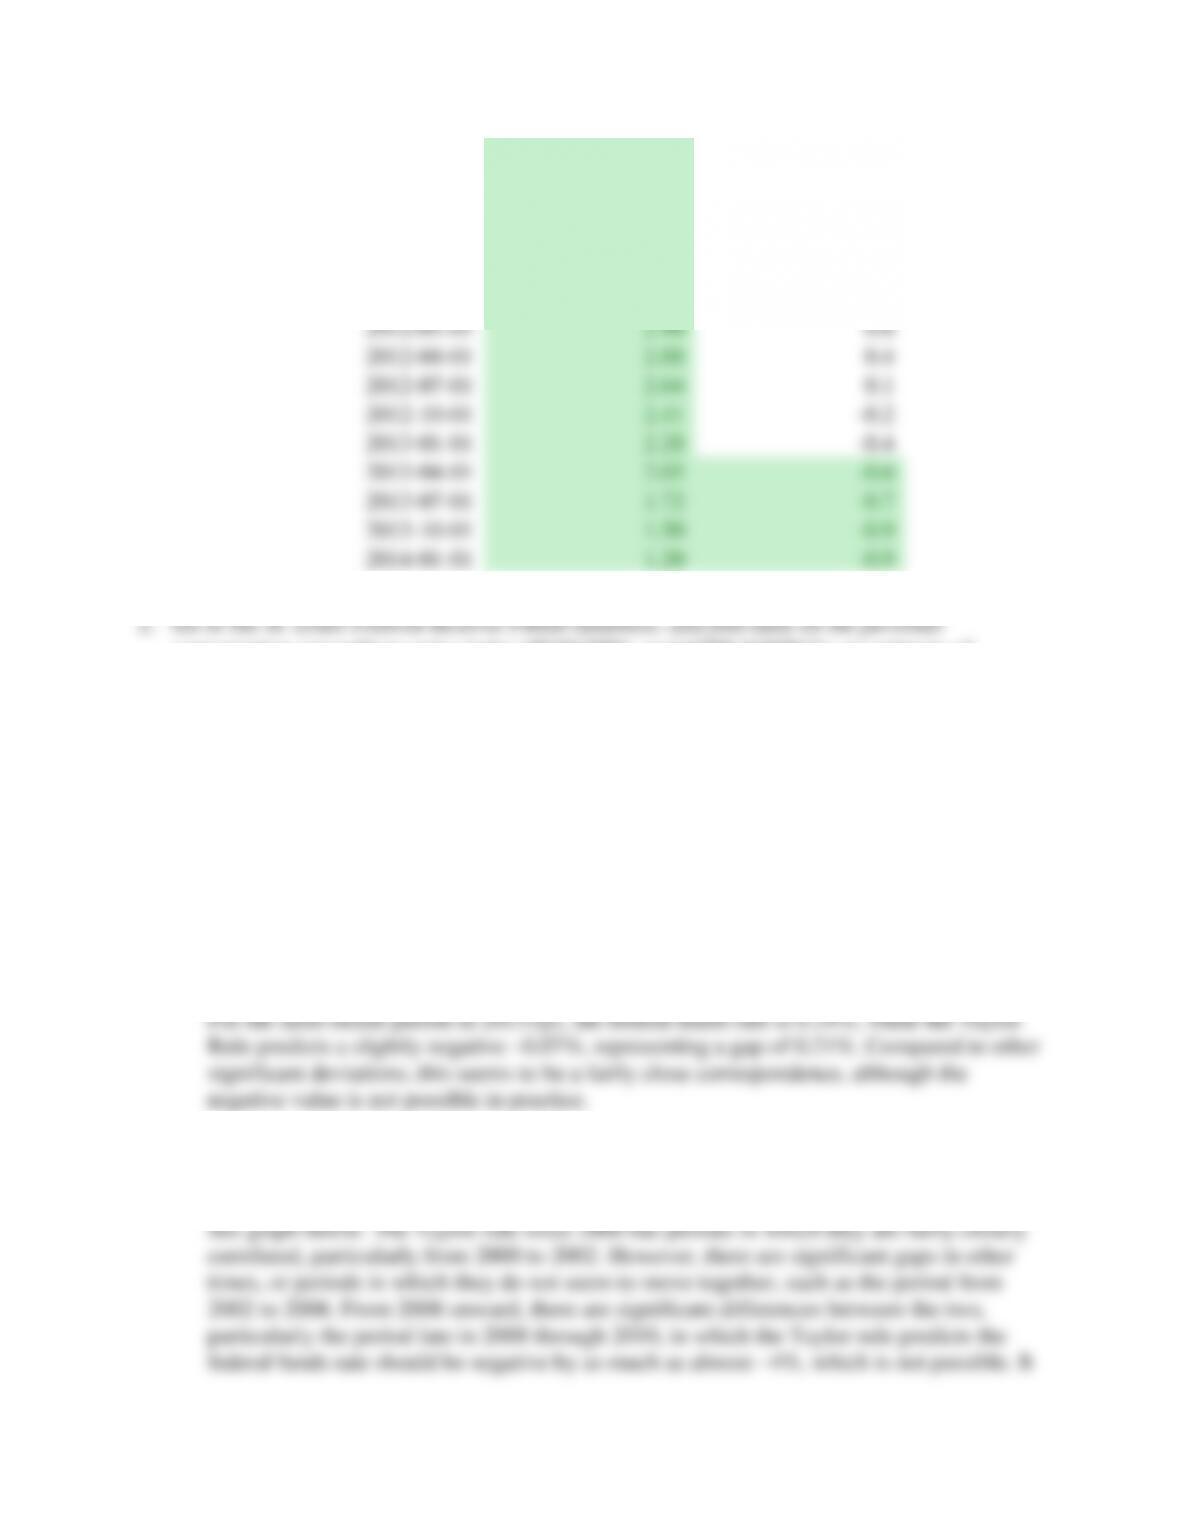
It is clearly very difficult to meet the objectives set forth in the Fed’s mandate, even
somewhat minor in that they do not last for long, or do not significantly deviate from the
noted thresholds too much.
Date
Unemp. Gap
Avg. Four Qtr.
Inflation Gap
2000-01-01
-1.01
-0.2
2000-04-01
-1.11
0.1
2000-07-01
-1.01
0.4
2000-10-01
-1.10
0.5
2001-01-01
-0.80
0.4
2001-04-01
-0.60
0.4
2001-07-01
-0.20
0.2
2001-10-01
0.50
-0.1
2002-01-01
0.70
-0.4
2002-04-01
0.80
-0.8
2002-07-01
0.70
-0.8
2002-10-01
0.90
-0.7
2003-01-01
0.90
-0.2
2003-04-01
1.10
-0.1
2003-07-01
1.10
0.0
2003-10-01
0.80
0.0
2004-01-01
0.70
-0.2
2004-04-01
0.60
0.0
2004-07-01
0.40
0.2
2004-10-01
0.40
0.4
2005-01-01
0.30
0.6
2005-04-01
0.10
0.6
2005-07-01
0.00
0.8
2005-10-01
0.00
0.8
2006-01-01
-0.30
1.0
2006-04-01
-0.40
1.1
2006-07-01
-0.40
1.0
2006-10-01
-0.60
0.7
2007-01-01
-0.50
0.5
2007-04-01
-0.50
0.3
2007-07-01
-0.30
0.1
2007-10-01
-0.20
0.5
2008-01-01
0.00
0.8
2008-04-01
0.30
1.1
2008-07-01
1.00
1.5
2008-10-01
1.90
1.1
2009-01-01
3.30
0.3
2009-04-01
4.25
-0.8
2009-07-01
4.52
-2.0
2009-10-01
4.79
-2.1
2010-01-01
4.65
-1.5
2010-04-01
4.42
-1.0
2010-07-01
4.30
-0.4
2010-10-01
4.38
-0.3
2011-01-01
3.76
-0.4
2011-04-01
3.84
-0.3
2011-07-01
3.73
0.1
2011-10-01
3.32
0.4
2012-01-01
2.90
0.6
2012-04-01
2.88
0.4
2012-07-01
2.64
0.1
2012-10-01
2.41
-0.2
2013-01-01
2.28
-0.4
2013-04-01
2.05
-0.6
2013-07-01
1.72
-0.7
2013-10-01
1.50
-0.9
2014-01-01
1.20
-0.9
consumption expenditure price index (PCECTPI), real GDP (GDPC1), an estimate of
potential GDP (GDPPOT), and the federal funds rate (DFF). For the price index, adjust the
units setting to “Percent Change From Year Ago” to convert the data to the inflation rate;
for the federal funds rate, change the frequency setting to “Quarterly.” Download the data
into a spreadsheet. Assuming the inflation target is 2%, calculate the inflation gap and the
output gap for each quarter, from 2000 until the most recent quarter of data available.
Calculate the output gap as the percentage deviation of output from the potential level of
output.
a. Use the output and inflation gaps to calculate, for each quarter, the fed funds rate
predicted by the Taylor rule. Assume that the weights on inflation stabilization and output
stabilization are both ½ (see the formula in the chapter). Compare the current (quarterly
average) federal funds rate to the federal funds rate prescribed by the Taylor rule. Does
the Taylor rule accurately predict the current rate? Briefly comment.
b. Create a graph that compares the predicted Taylor rule values with the actual quarterly
federal funds rate averages. How well, in general, does the Taylor rule prediction fit the
average federal funds rate? Briefly explain.
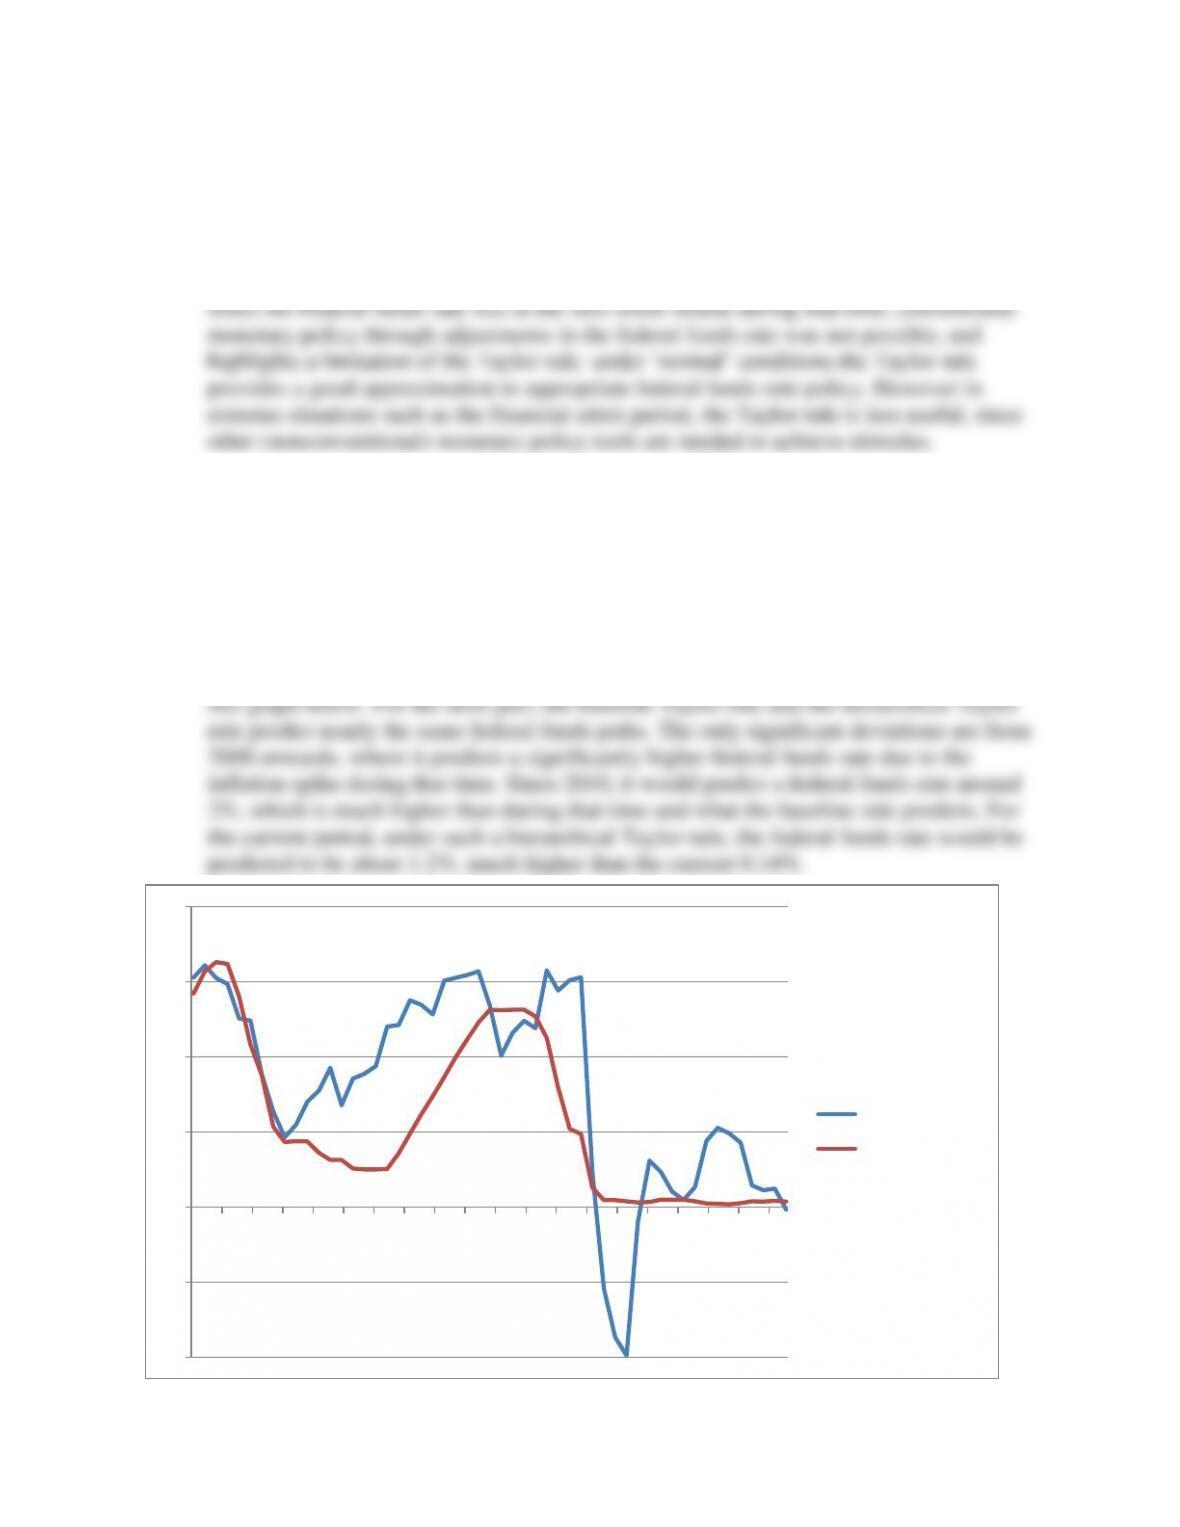
c. Based on the results from the 2008–2009 period, explain the limitations of the Taylor
rule as a formal policy tool. How do these limitations help explain the use of
nonconventional monetary policy during this period?
d. Suppose Congress changes the Fed’s mandate to a hierarchical one in which inflation
stabilization takes priority over output stabilization. In this context, recalculate the
predicted Taylor rule value for each quarter since 2000, assuming that the weight on
inflation stabilization is ¾ and the weight on output stabilization is ¼. Create a graph
showing the Taylor rule prediction calculated in part (a), the prediction using new
“hierarchical” Taylor rule, and the fed funds rate. How, if at all, does changing the
mandate change the predicted policy paths? How would the fed funds rate be affected by
a hierarchical mandate? Briefly explain.
-4
-2
0
2
4
6
8
2000-01-01
2000-09-01
2001-05-01
2002-01-01
2002-09-01
2003-05-01
2004-01-01
2004-09-01
2005-05-01
2006-01-01
2006-09-01
2007-05-01
2008-01-01
2008-09-01
2009-05-01
2010-01-01
2010-09-01
2011-05-01
2012-01-01
2012-09-01
Taylor Rule
Fed Funds Rate