22. Using the supply and demand analysis of the market for reserves, indicate what happens to
the federal funds rate, borrowed reserves, and nonborrowed reserves, holding everything
else constant, under the following situations.
a. The economy is surprisingly strong, leading to an increase in the amount of checkable
deposits.
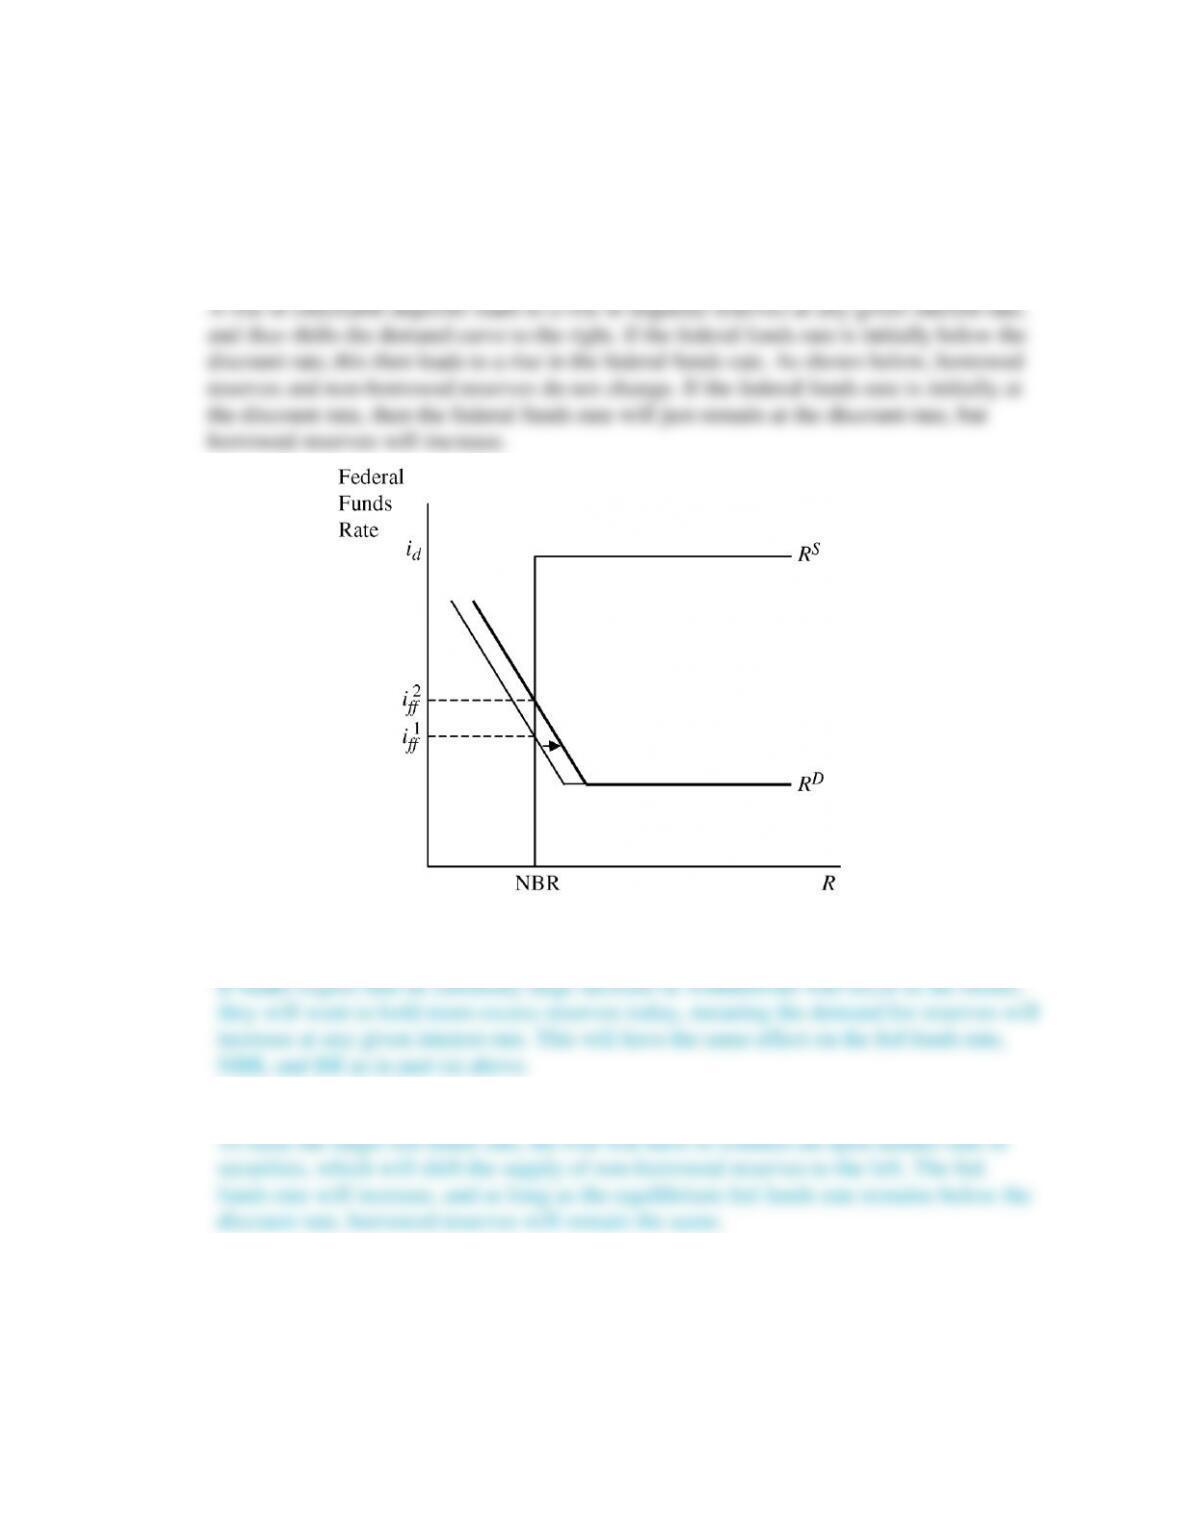
b. Banks expect an unusually large increase in withdrawals from checking deposit accounts
in the future.
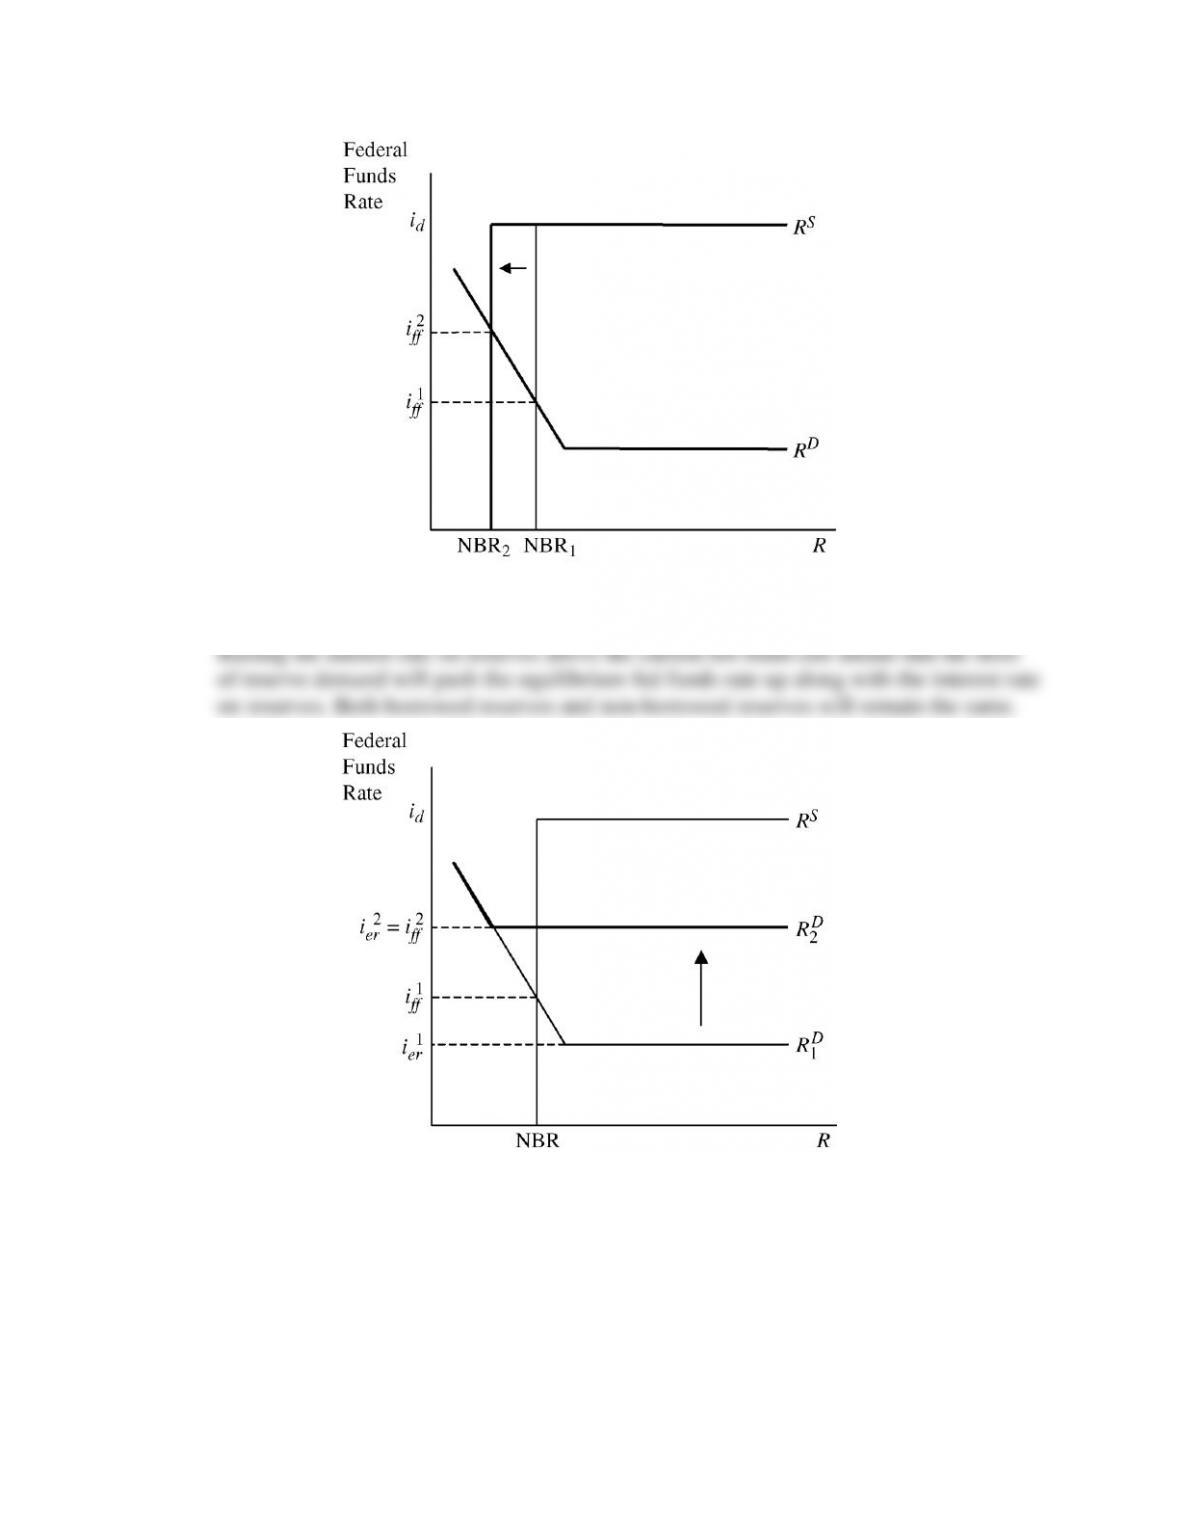
c. The Fed raises the target federal funds rate.
d. The Fed raises the interest rate on reserves above the current equilibrium federal funds
rate.
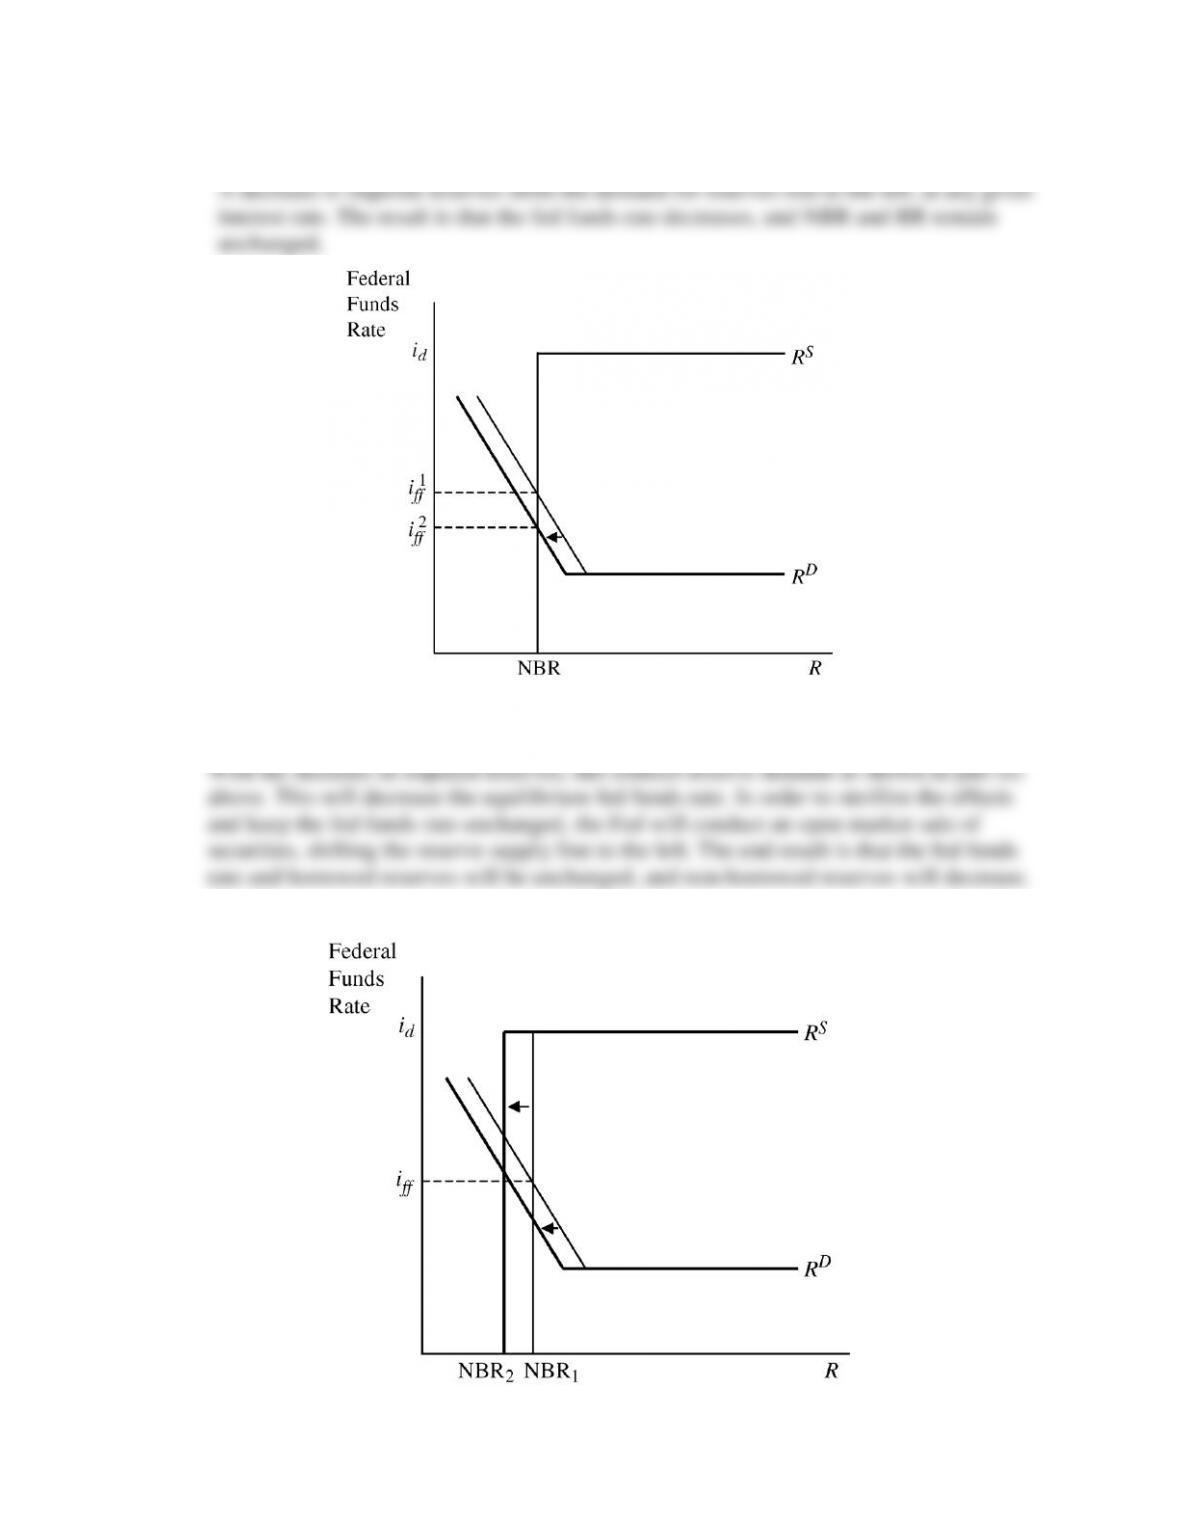
e. The Fed reduces reserve requirements.
f. The Fed reduces reserve requirements and then offsets this action by conducting an open
market sale of securities.
ANSWERS TO APPLIED PROBLEMS
1. Go to the St. Louis Federal Reserve FRED database, and find data on nonborrowed reserves
(NONBORRES) and the federal funds rate (FEDFUNDS).
a. Calculate the percent change in nonborrowed reserves and the percentage point change
in the federal funds rate for the most recent month of data available and for the same
month a year earlier.
b. Is your answer to part (a) consistent with what you expect from the market for reserves?
Why or why not?
2. In December 2008, the Fed switched from a point federal funds target to a range target (and
it’s possible that it will switch back to a point target in the future). Go to the St. Louis
Federal Reserve FRED database, and find data on the federal funds targets/ ranges
(DFEDTAR, DFEDTARU, DFEDTARL) and the effective federal funds rate (DFF).
Download into a spreadsheet the data from the beginning of 2006 through the most current
data available.
a. What is the current federal funds target/range, and how does it compare to the effective
federal funds rate?
b. When was the last time the Fed missed its target or was outside the target range? By how
much did it miss?
c. For each daily observation, calculate the “miss” by taking the absolute value of the
difference between the effective federal funds rate and the target (use the abs(.) function).
For the periods in which the rate was a range, calculate the absolute value of the “miss”
as the amount by which the effective federal funds rate was above or below the range.
What was the average daily miss between the beginning of 2006 and the end of 2007?
What was the average daily miss between the beginning of 2008 and December 15,
2008? What is the average daily miss for the period from December 16, 2008, to the most
current date available? Since 2006, what was the largest single daily miss? Comment on
the Fed’s ability to control the federal funds rate during these three periods.
From the beginning of 2006 to the end of 2007, the average daily miss was 0.05, or 5
maintaining the federal funds rate close to target, but for somewhat different reasons. In
the 2006-2007 period, reserve demand was relatively stable, so it was relatively easier to
conduct defensive open market operations to keep the effective federal funds rate close to
target. In the most recent period, because a range is specified, it is somewhat easier to
sometimes by large amounts. Due to the effects of the global financial crisis and
uncertainty in financial markets, large unpredictable swings in reserve demand meant
greater fluctuations in the effective federal funds rate, and due to the unpredictable nature
of these events, made it harder for the Fed to conduct defensive open market operations