
Chapter 12
ANSWERS TO QUESTIONS
1. How does the concept of asymmetric information help to define a financial crisis?
2. How can the bursting of an asset-price bubble in the stock market help trigger a financial
crisis?
selection increases. The bursting of an asset-price bubble therefore makes borrowers less
credit-worthy and causes a contraction in lending and spending. The asset price bust can also
3. How does an unanticipated decline in the price level cause a drop in lending?
4. How can a decline in real estate prices cause deleveraging and a decline in lending?
5. How does a deterioration in balance sheets of financial institutions and the simultaneous
failures of these institutions cause a decline in economic activity?
6. How does a general increase in uncertainty as a result of the failure of a major financial
7. What is a credit spread? Why do credit spreads rise significantly during a financial crisis?
8. What causes bank panics to occur?

9. Why do bank panics worsen asymmetric information problems in credit markets?
10. How can financial innovation lead to financial crises?
11. What role does weak financial regulation and supervision play in causing financial crises?
12. Describe two similarities and two differences between the United States’ experiences during
the Great Depression and the financial crisis of 2007–2009.
13. What do you think prevented the financial crisis of 2007–2009 from becoming a depression?
14. What technological innovations led to the development of the subprime mortgage market?
15. Why is the originate-to-distribute business model subject to the principal–agent problem?
16. “Financial engineering always leads to a more efficient financial system.” Is this statement
true, false, or uncertain?
actually destroy information, thereby making asymmetric information worse in the financial
17. How did a decline in housing prices help trigger the subprime financial crisis that began in
2007?

18. What role did the shadow banking system play in the 2007–2009 financial crisis?
The shadow banking system is composed of hedge funds, investment banks, and other
19. Why would haircuts on collateral increase sharply during a financial crisis? How would this
lead to fire sales on assets?
20. How did the global financial crisis promote a sovereign debt crisis in Europe?
The contraction in economic activity reduced tax revenues at the same time that government
21. Why is it a good idea for macroprudential policies to require countercyclical capital
requirements?

22. How does the process of financial innovation impact the effectiveness of macroprudential
regulation?
23. What are the three approaches to limiting the too-big-to-fail problem? Briefly describe the
24. Why were consumer protection provisions included in the Dodd-Frank bill, a bill designed to
strengthen the financial system?
25. Why is it important for the U.S. government to have resolution authority?
Prior to 2009, the U.S. government had no legal authority to seize the largest failing financial
ANSWERS TO DATA ANALYSIS PROBLEMS
1. Go to the St. Louis Federal Reserve FRED database, and find data on house prices
(SPCS20RSA), stock prices (SP500), a measure of the net wealth of households
(TNWBSHNO), and personal consumption expenditures (PCEC). For all four measures, be
sure to convert the frequency setting to “Quarterly.” Download the data into a spreadsheet,
and make sure the data align correctly with the appropriate dates. For all four series, for
each quarter, calculate the annualized growth rate from quarter to quarter. To do this, take
the current-period data minus the previous-quarter data, and then divide by the previous
quarter data. Multiply by 100 to change each result to a percent, and multiply by 4 to
annualize the data.
a. For the four series, calculate the average growth rates over the most recent four quarters
of data available. Comment on the relationships among house prices, stock prices, net
wealth of households, and consumption as they relate to your results.
b. Repeat part (a) for the four quarters of 2005, and again for the period from 2008:Q3 to
2009:Q2. Comment on the relationships among house prices, stock prices, net wealth of
households, and consumption as they relate to your results, before and during the crisis.
bubble?
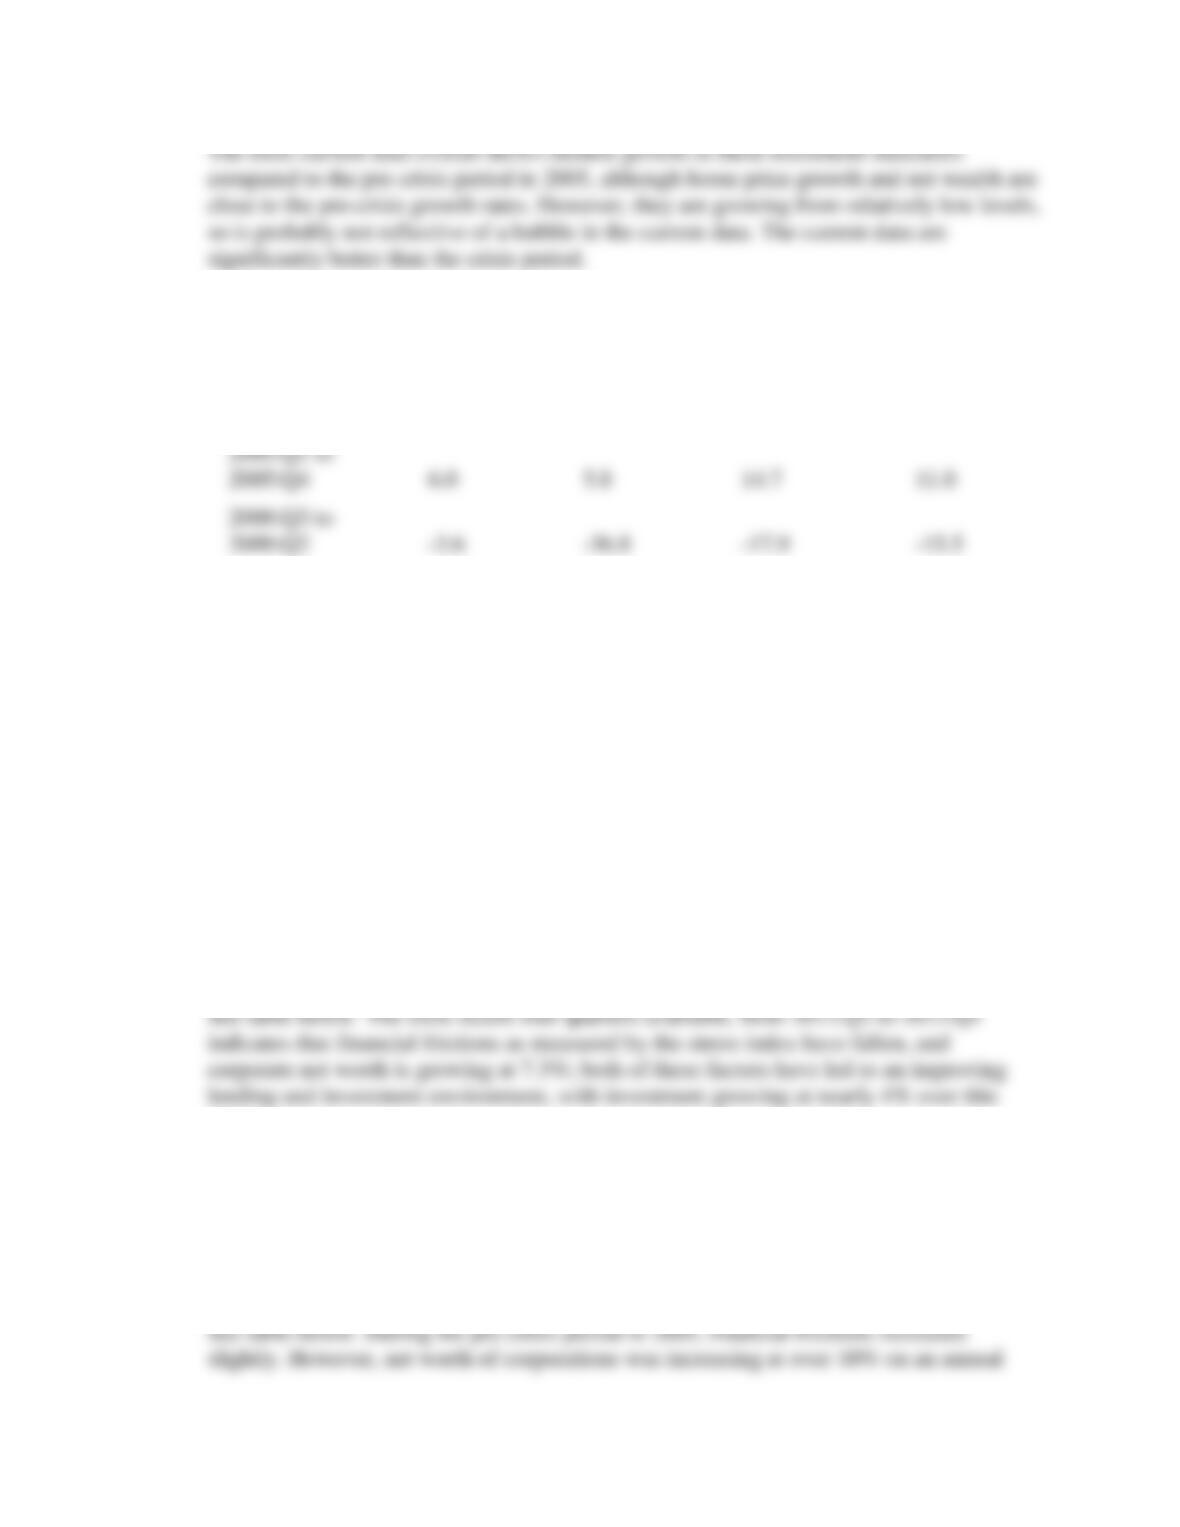
Consumption
Growth Rate
S&P 500
Stock Price
Growth
Case-Shiller
Home Price
Growth
Household
Net Wealth
Growth
2012:Q2 to
2013:Q1
3.1
11.9
9.2
9.3
2005:Q1 to
2005:Q4
6.0
5.8
14.7
11.0
2008:Q3 to
2009:Q2
-3.6
-36.8
-17.9
-15.5
2. Go to the St. Louis Federal Reserve FRED database, and find data on corporate net worth of
nonfinancial businesses (TNWMVBSNNCB), private domestic investment (GPDIC1), and a
measure of financial frictions, the St. Louis Fed financial stress index (STLFSI). For all three
measures, be sure to convert the frequency setting to “Quarterly.” Download the data into a
spreadsheet, and make sure the data align correctly with the appropriate dates. For
corporate net worth and private domestic investment, calculate the annualized growth rates
from quarter to quarter. To do this, take the current-period data minus the previous-quarter
data, then divide by the previous quarter data. Multiply by 100 to change the results to
percentage form, and then multiply by 4 to annualize the data.
a. Calculate the average growth rates over the most recent four quarters of data available
for the corporate net worth and private domestic investment variables. Calculate the
difference between the value of the stress index during the most recent quarter and the
value of the stress index one year earlier. Comment on the relationships among financial
stress, net wealth of corporate businesses, and private domestic investment.
time.
b. Repeat part (a) for the four quarters of 2005 and for the period from 2008:Q3 to
2009:Q2. Comment on the relationships among financial stress, net wealth of corporate
businesses, and private domestic investment before and during the crisis as they relate to
your results. Assuming the financial stress measure is indicative of heightened
asymmetric information problems, comment on how the crisis-period data relate to the
typical dynamics of a financial crisis.
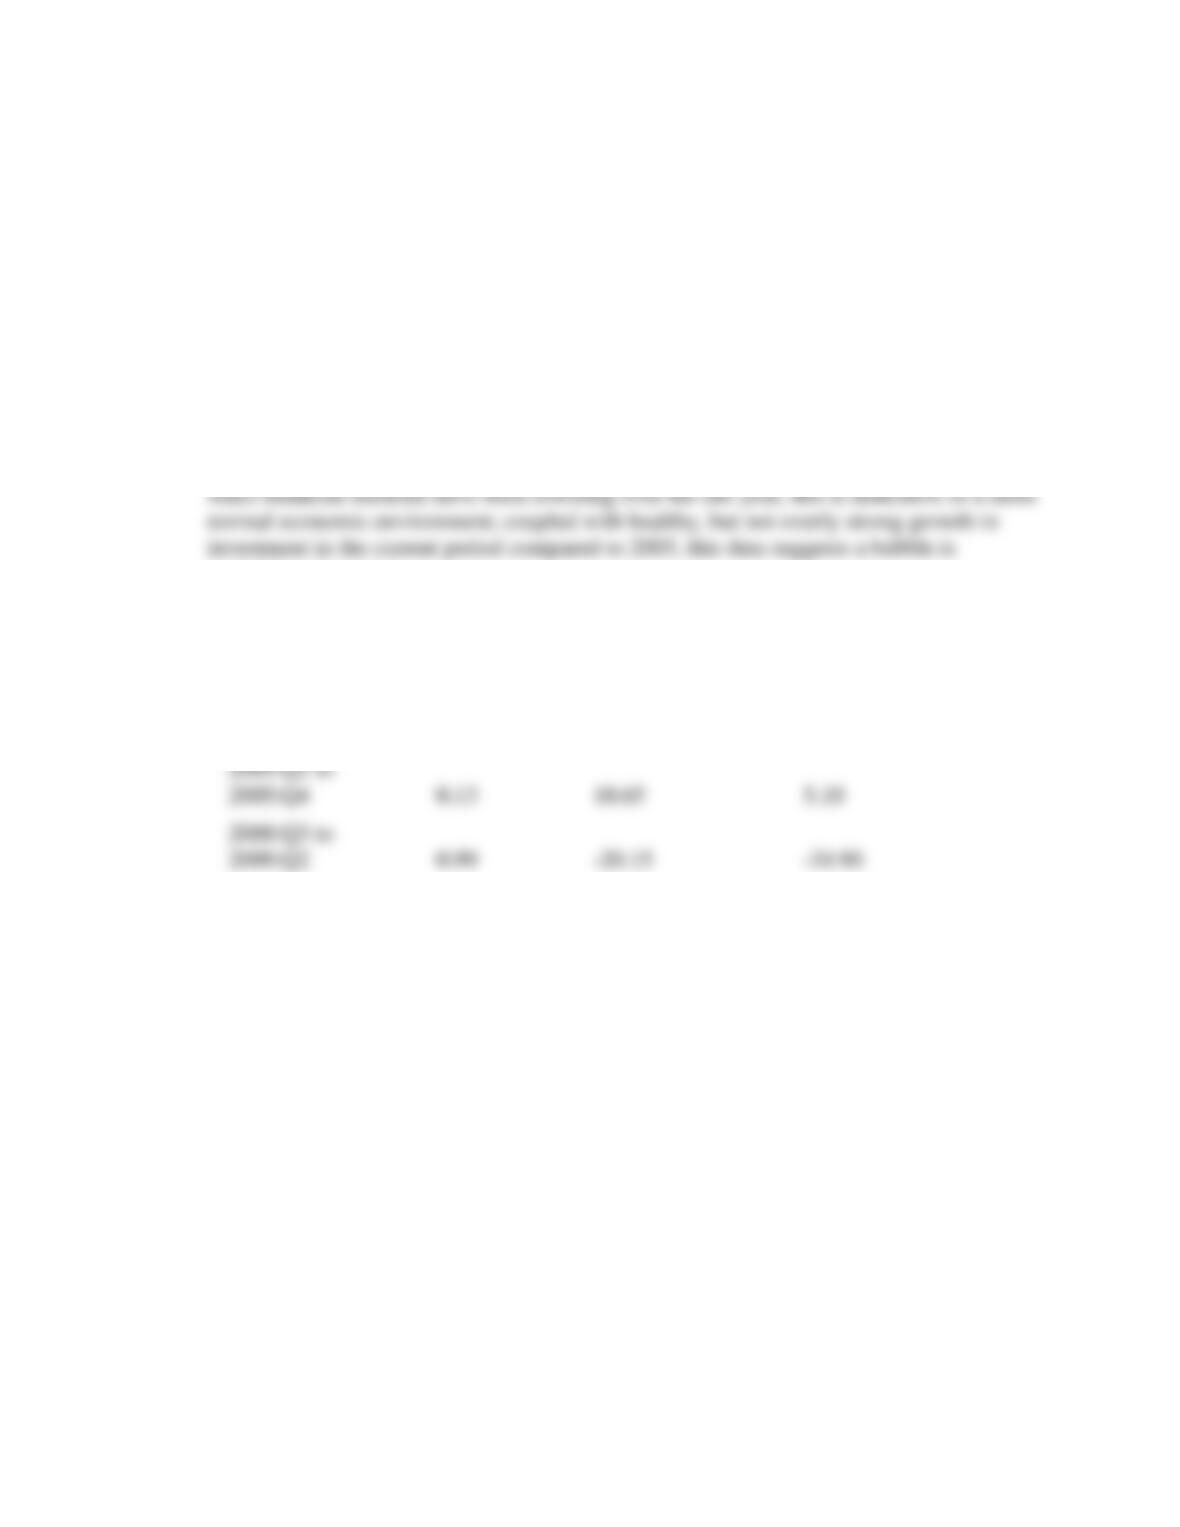
c. How do the current investment data compare to the data for the period prior to the
financial crisis, and during the crisis? Do you think the current data are indicative of a
bubble?
probably not present.
Change,
Stress Index
Corporate Net
Worth Growth
Rate
Investment
Growth Rate
2012:Q2 to
2013:Q1
-0.69
7.32
3.90
2005:Q1 to
2005:Q4
0.13
10.65
5.10
2008:Q3 to
2009:Q2
0.99
-20.15
-34.90