PART THREE
Answers
to End-of-Chapter
Questions and Problems
Chapter 1
ANSWERS TO QUESTIONS
1. What is the typical relationship among interest rates on three-month Treasury bills, long-
term Treasury bonds, and Baa corporate bonds?
2. What effect might a fall in stock prices have on business investment?
3. What effect might a rise in stock prices have on consumers’ decisions to spend?
4. Why are financial markets important to the health of the economy?
5. What was the main cause of the recession that began in 2007?
6. What is the basic activity of banks?
7. What are the other important financial intermediaries in the economy, besides banks?
8. Can you think of any financial innovation in the past ten years that has affected you
personally? Has it made you better off or worse off? Why?
9. Has the inflation rate in the United States increased or decreased in the past few years?
What about interest rates?
10. If history repeats itself and we see a decline in the rate of money growth, what might you
expect to happen to
a. real output?
b. the inflation rate?
c. interest rates?
11. When interest rates decrease, how might businesses and consumers change their economic
behavior?
12. Is everybody worse off when interest rates rise?
13. Why do managers of financial institutions care so much about the activities of the Federal
Reserve System?
14. How does the current size of the U.S. budget deficit compare to the historical budget deficit
or surplus for the time period since 1950?
15. How would a fall in the value of the pound sterling affect British consumers?
16. How would an increase in the value of the pound sterling affect American businesses?
17. How can changes in foreign exchange rates affect the profitability of financial institutions?
18. According to Figure 8, in which years would you have chosen to visit the Grand Canyon in
Arizona rather than the Tower of London?
19. When the dollar is worth more in relation to currencies of other countries, are you more
likely to buy American-made or foreign-made jeans? Are U.S. companies that manufacture
20. Much of the U.S. government debt is held by foreign investors as treasury bonds and bills.
How do fluctuations in the dollar exchange rate affect the value of that debt held by
foreigners?
ANSWERS TO APPLIED PROBLEMS
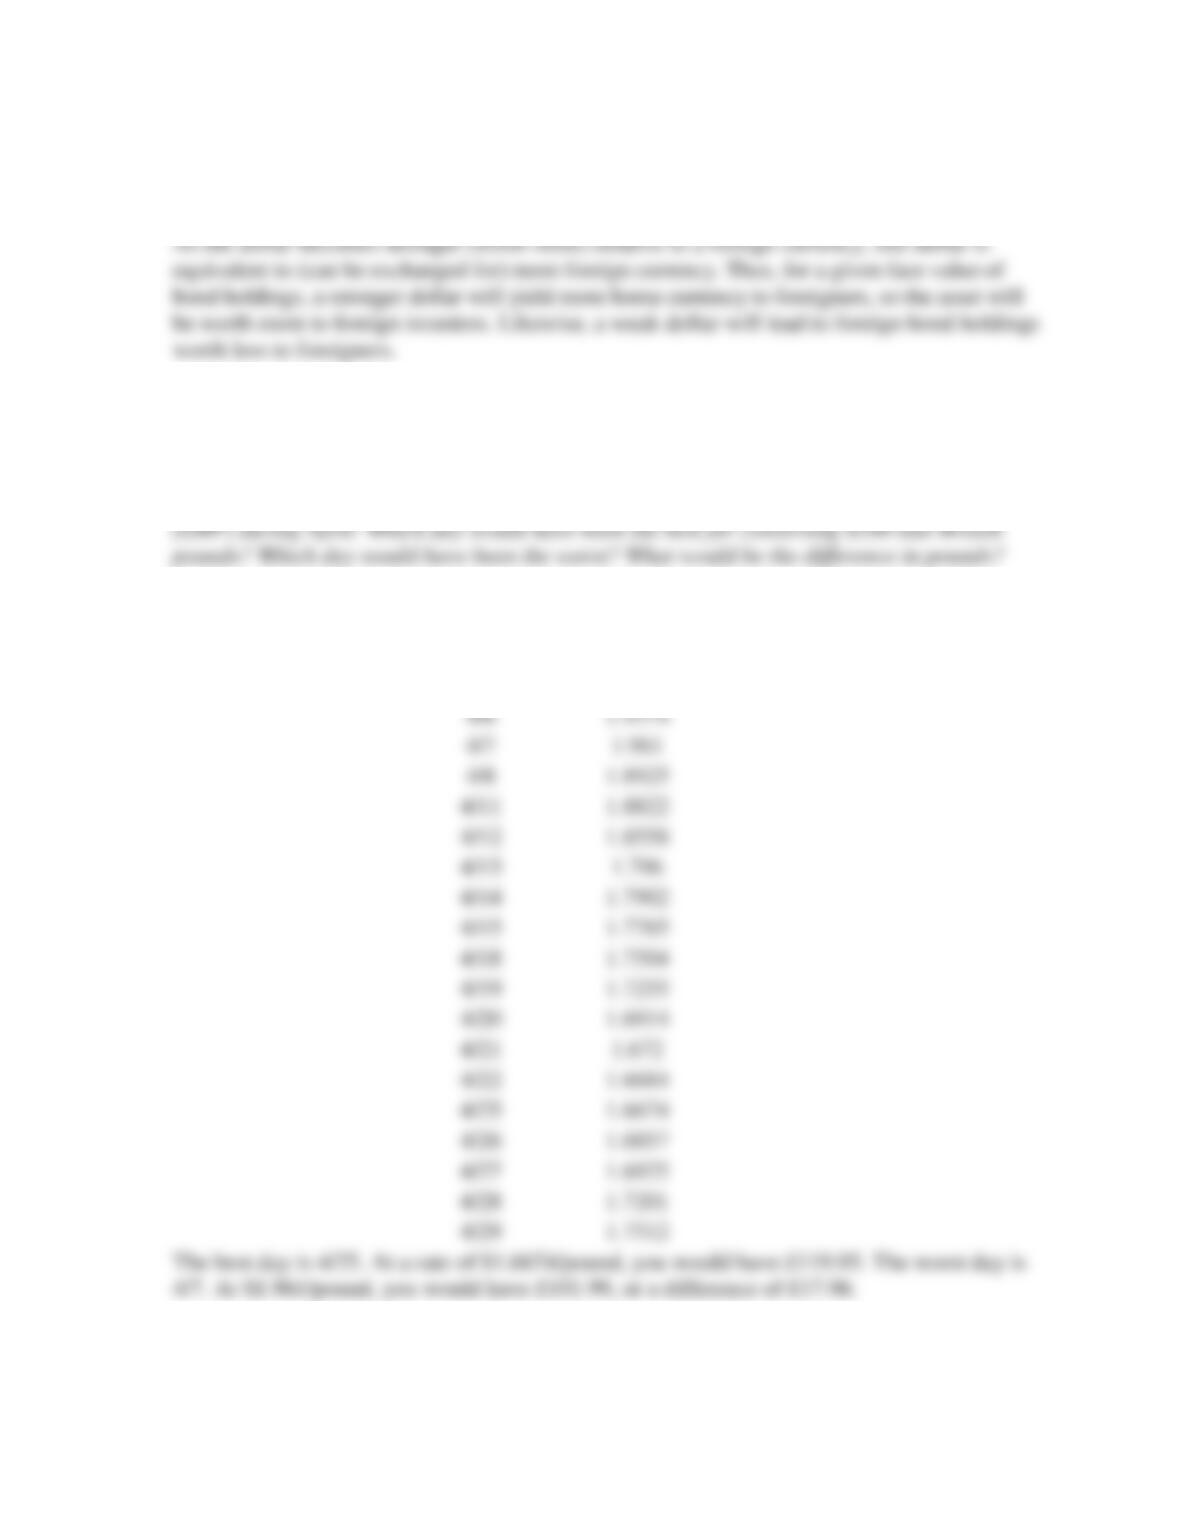
21. The following table lists foreign exchange rates between U.S. dollars and British pounds
Date
U.S Dollars per
GBP
4/1
1.9564
4/4
1.9293
4/5
1.914
4/6
1.9374
4/7
1.961
4/8
1.8925
4/11
1.8822
4/12
1.8558
4/13
1.796
4/14
1.7902
4/15
1.7785
4/18
1.7504
4/19
1.7255
4/20
1.6914
4/21
1.672
4/22
1.6684
4/25
1.6674
4/26
1.6857
4/27
1.6925
4/28
1.7201
4/29
1.7512
The best day is 4/25. At a rate of $1.6674/pound, you would have £119.95. The worst day is
4/7. At $1.961/pound, you would have £101.99, or a difference of £17.96.
ANSWERS TO DATA ANALYSIS PROBLEMS
1. Go to the St. Louis Federal Reserve FRED database and find data on the three-month
treasury bill rate (TB3MS), the three-month AA nonfinancial commercial paper rate
(CPN3M), the 30-year treasury bond rate (GS30), the 30-year conventional mortgage rate
(MORTG), and the NBER recession indicators (USREC).
a. In general, how do these interest rates behave during recessions and during
expansionary periods?
b. In general, how do the three-month rates compare to the 30-year rates? How do the
treasury rates compare to the respective commercial paper and mortgage rates?
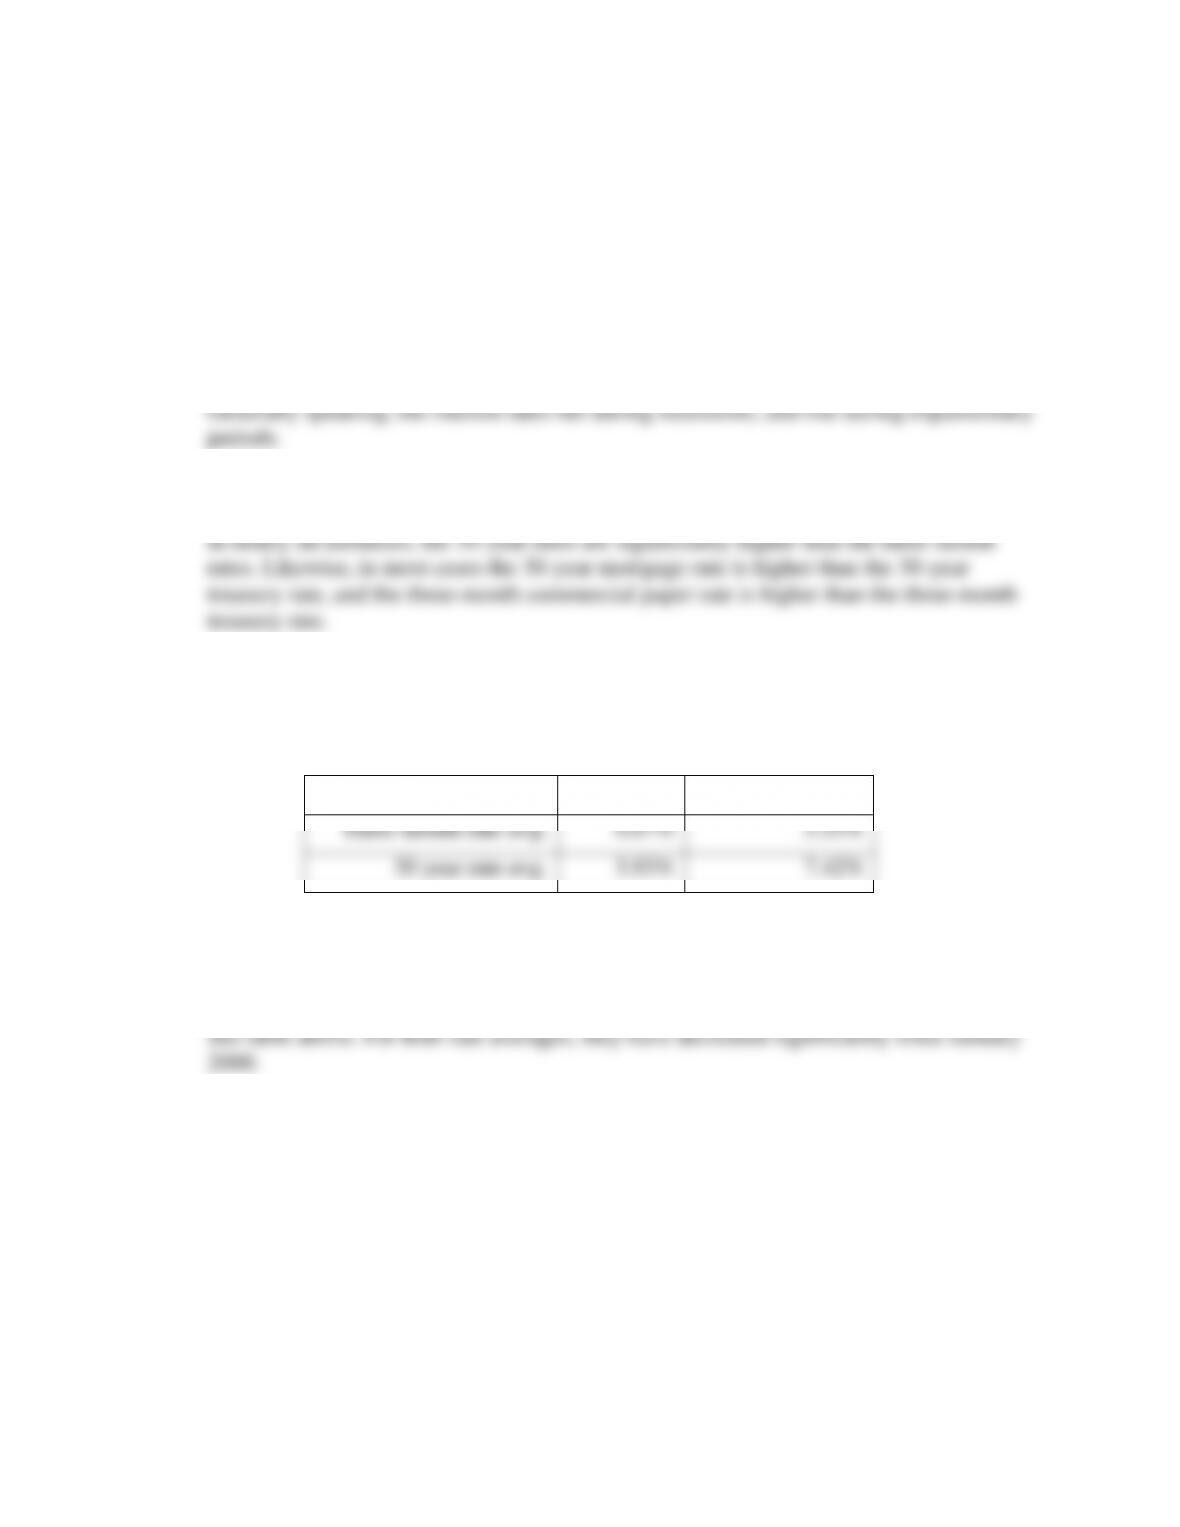
c. For the most recent available month of data, take the average of each of the three-month
rates and compare it to the average of the three-month rates from January 2000. How do
the averages compare?
April 2014
January 2000
Three-month rate avg.
0.07%
5.53%
30 year rate avg.
3.93%
7.42%
d. For the most recent available month of data, take the average of each of the 30-year
rates and compare it to the average of the 30-year rates from January 2000. How do the
averages compare?
2. Go to the St. Louis Federal Reserve FRED database and find data on the M1 money supply
(M1SL) and the 10-year treasury bond rate (GS10). Add the two series into a single graph by
using the “Add Data Series” feature. Transform the M1 money supply variable into the M1
a. In general, how have the growth rate of the M1 money supply and the 10-year treasury
bond rate behaved during recessions and during expansionary periods since the year
2000?
Generally, the 10-year treasury rate fell during the recessionary periods of 2001 and
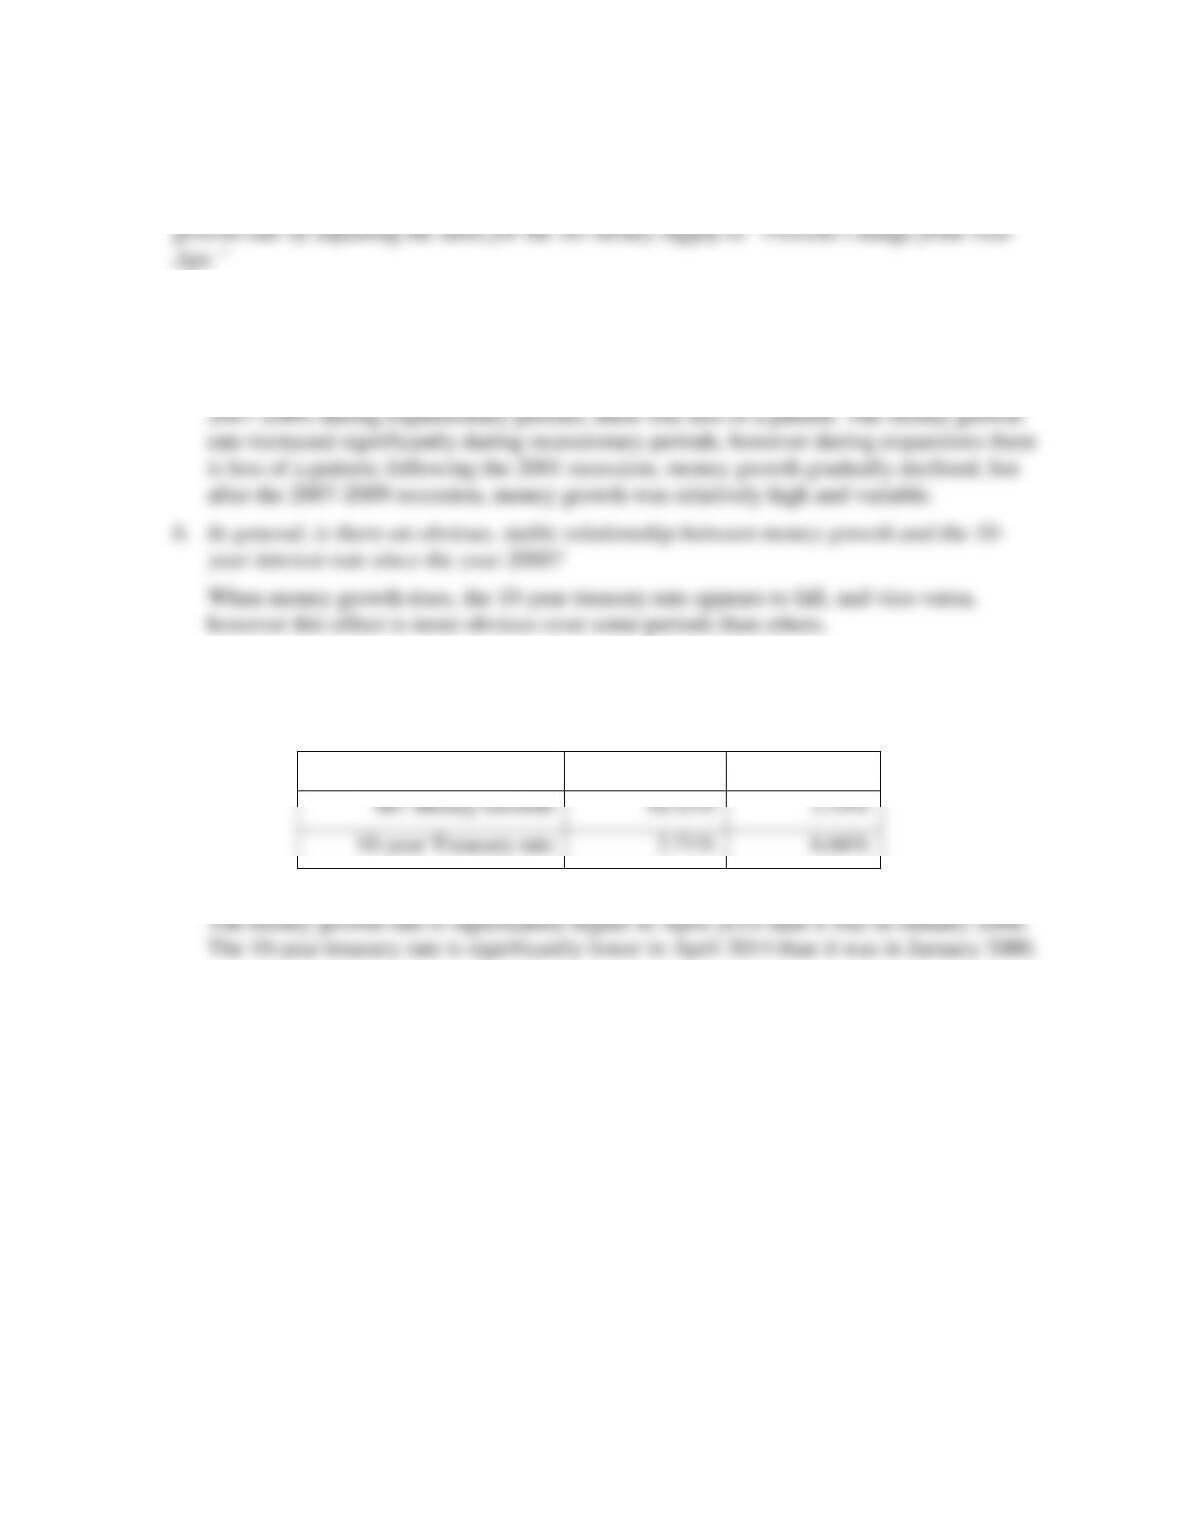
c. Compare the money growth rate and the 10-year interest rate for the most recent month
available to the rates for January 2000. How do the rates compare?
April 2014
January 2000
M1 Money Growth
10.33%
2.19%
10-year Treasury rate
2.71%
6.66%