
Chapter 3. The Goods Market
I. MOTIVATING QUESTION
How is output determined in the short run?
Output is determined by equilibrium in the goods market, i.e., by the condition that supply (production of
goods) equals demand. This condition always determines output, but in the short run, we assume that
production adjusts automatically to output without changes in price. Thus, in the short run, output is
effectively determined by demand. Moreover, in this chapter, investment is exogenous (and therefore
independent of the interest rate), so there is no need to consider simultaneous equilibrium in the goods
and financial markets.
II. WHY THE ANSWER MATTERS
The determination of output is the fundamental issue of macroeconomics. This chapter introduces the
topic through the Keynesian cross model, which considers the goods market in isolation. The Keynesian
cross provides basic intuition about the building and solving of models, the determination of output, and
the role of fiscal policy. The short-run, qualitative results generally survive in more complicated models.
Chapter 4 examines the financial markets in isolation, and Chapter 5 combines the goods and financial
markets to construct the demand side of the economy.
III. KEY TOOLS, CONCEPTS, AND ASSUMPTIONS
1. Tools and Concepts
i. The chapter introduces functional notation.
ii. The chapter introduces modeling terminology: exogenous and endogenous variables, behavioral
equations, identities, and equilibrium conditions.
iii. The chapter describes the Keynesian cross model (although it does not use this expression), and
associated terms, such as the (marginal) propensity to consume, disposable income, and autonomous
spending.
iv. The chapter introduces fiscal policy.
2. Assumptions
i. The text assumes that the economy produces a single good. This assumption is maintained
throughout most of the formal work in the book.
©2017 Pearson Education, Inc. Publishing as Prentice Hall
3-14
ii. After introducing the national income identity, the text assumes a closed economy. This assumption
is maintained until Chapter 17.
iii. For short-run analysis, the text assumes that production adjusts automatically to output without
changes in price. This assumption implies that the price level is fixed. Instructors may wish to clarify
this assumption before the price level is introduced in the discussion of the money market and the LM
curve in Chapters 4 and 5. The assumption that the price level is fixed is maintained until Chapter 7.
iv. Within the short-run context, the critical assumption of this chapter is that investment does not
respond to the interest rate. This isolates the goods market from the financial market. This assumption
will be relaxed in Chapter 5.
v. The chapter, in fact, goes further, and assumes that investment is exogenous. It does not depend on
output, nor is there inventory investment, either planned or unplanned. Chapter 5 introduces the
dependence of investment on output. This chapter discusses in words the dynamic implications of
allowing unplanned inventory adjustment, although it does not stress this point.
IV. SUMMARY OF THE MATERIAL
1. The Composition of GDP
On the expenditure side, GDP can be decomposed into consumption (C), government spending (G), fixed
investment (I), net exports (X-IM), and inventory investment.
2. The Demand for Goods
Assume there is only one good, and use the decomposition of GDP to think about demand for that good.
Assume the economy is closed, so that net exports are zero, and ignore inventory investment, which is
typically a small part of GDP. Then, demand (Z) can be written as
Z = C + I + G.
Write consumption as a linear function of disposable income (YD)
C = C(YD) (3.1)
(+)
The function C = C(YD) is called the consumption function. The positive sign below it indicates that
consumption increases as disposable income increases. However, there is some level of consumption that
would occur even if disposable income were zero. This consumption is called autonomous consumption
and is represented by c0. The parameter c1, which represents the increase in consumption for every extra
unit of disposable income, is called the (marginal) propensity to consume. Assume that households do not
consume every dollar of additional income, but save some, so that 0< c1<1.
Given this new information we can expand the consumption function to the following linear function;
C = c0+c1(YD) (3.2)
©2017 Pearson Education, Inc. Publishing as Prentice Hall
3-15
When we add the government sector and taxation to the model we see that consumers pay taxes (T) on
income (Y). This addition expands the linear expression of the model to;
C = c0+c1(Y – T ) (3.3)
The two remaining components of consumption are government spending (G) and business investment (I)
which in the next section we will hold constant.
3. The Determination of Equilibrium Output
Output is determined by equilibrium in the goods market. The equilibrium condition is that production
equals demand. Assume for now that production simply increases or decreases with demand without any
change in price. Thus, in the short run, output is fully determined by demand. Then, we can write the
equilibrium condition, Y=Z, as
Y = c0 + c1(Y – T) + +G. (3.5)
The variable Y appears on both sides of this equation. On the LHS, Y represents production. On the
RHS, Y represents national income. Chapter 2 explained why these two quantities are equal. The aim of
this model is to determine the value of Y, an endogenous variable. To solve the model, it is necessary to
write Y as a function of the exogenous variables, i.e., those determined outside the model. In other words,
Y= [1/(1-c1)][c0 + +G -c1T]. (3.8)
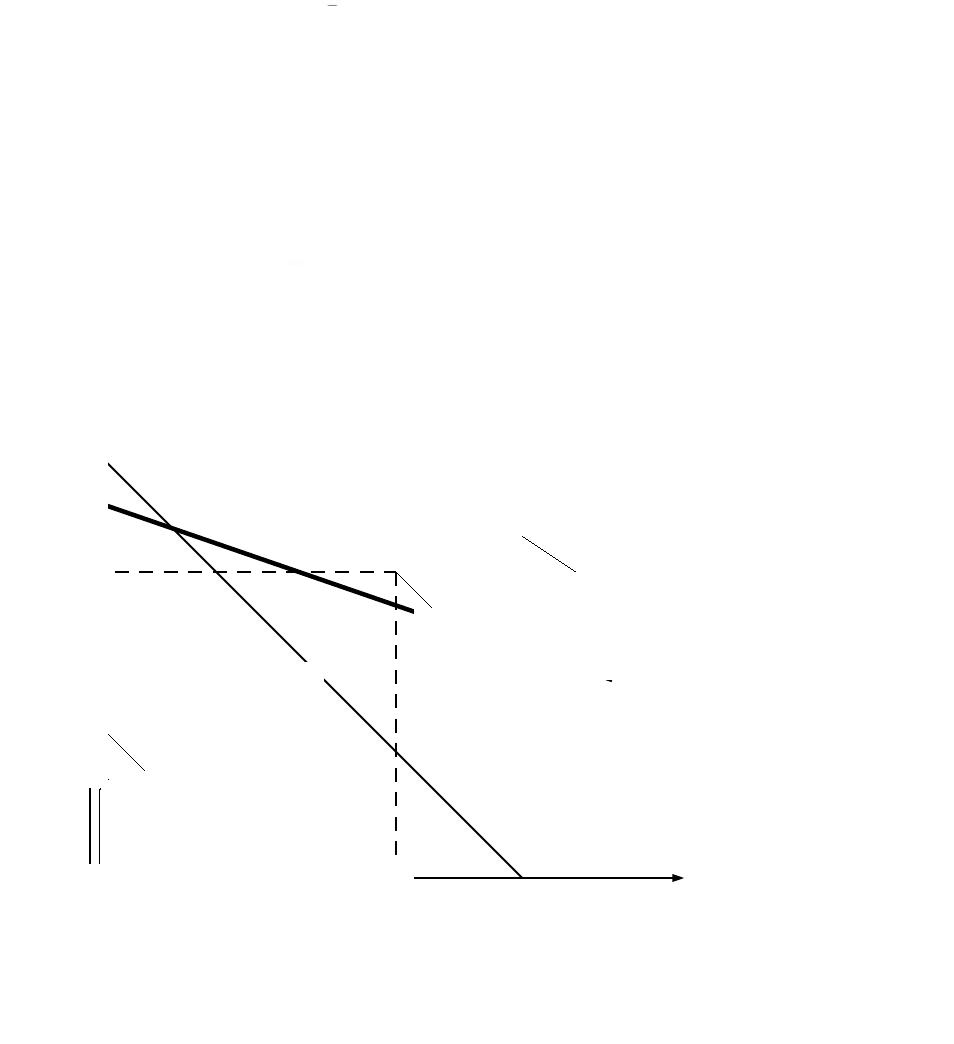
Equation (3.8) shows the algebraic solution and Figure 3-2 the graphical solution. In the graph,
equilibrium occurs where demand (the ZZ curve) crosses the 45 line (i.e., the line along which Y=Z).
Figure 3-2: Equilibrium in the Goods Market
©2017 Pearson Education, Inc. Publishing as Prentice Hall
Demand (Z), Production (Y)
Autonomous
Spending
Equilibrium Point
Slope = c1
ZZ
Demand
Y = Z
45
3-16

Equilibrium income is the product of two factors: autonomous spending (the second term in brackets in
equation (3.8)) and a “multiplier” (the first term in brackets). Assume that autonomous spending is
positive,1 which (given that c1<1) will be true unless the budget surplus, T-G, is very large. The
multiplier, which depends on the value of the propensity to consume, arises because consumption is
affected by income. Suppose there is an increase in autonomous consumption—say, because of an
increase in consumer confidence. The initial increase in consumption because of the rise in c0 leads to an
increase in income. The increase in income leads to a further increase in consumption, which leads to a
further increase in income, and so on. Thus, the effect of the initial increase in consumer confidence is
“multiplied.” The multiplier captures this effect. More formally, the multiplier can be described as the
limit of a geometric series of fractional increases in consumption. A focus box on page 59 discusses the
impact of the early stages of the financial crisis and consumer concerns over their future disposable
income.
4. Investment Equals Saving: An Alternative Way of Thinking About Goods
Market Equilibrium
Private saving is defined as disposable income minus consumption, or
S=Y-T-C.
Using this definition, the equilibrium output condition (Y=C+I+G) can be expressed as
I=S+(T-G). (3.10)
In a closed economy, investment equals private (consumer) saving (S) plus government saving (T-G).
The quantity T-G is called the budget surplus. The quantity G-T is called the budget deficit.
5. Is the Government Really Omnipotent? A Warning
The equilibrium output condition (3.8) seems to imply that the government, by choosing G and T, has
absolute control over the level of output. The text stresses that this chapter provides only a first pass at
the analysis of fiscal policy. Later chapters will make clear the many limitations on the ability of the
government to control output through spending and taxation.
V. PEDAGOGY
1. Points of Clarification
i. The Definition of Goods. The chapter assumes that the economy produces only one item and calls
this item a good. However, the model is not meant to be limited to physical goods as opposed to services.
“Goods” is generally used to refer to both physical goods and services.
1
©2017 Pearson Education, Inc. Publishing as Prentice Hall
Income, Y
3-17
ii. The Definitions of G and T. Government spending includes the purchase of newly produced
goods and services, not total government outlays. In particular, transfers—such as Social Security
payments, veterans’ benefits, and interest on the government debt—are excluded. Note also that
government spending includes spending by all levels of government (federal, state, and local) and that
some government spending pays for capital goods. The variable T is defined as taxes minus transfers and
includes taxes minus transfers at all levels of government.
iii. Exports and Imports in GDP. Imports are subtracted from GDP on the expenditure side because
the domestic spending categories C, I, and G include spending on foreign goods and services. To isolate
spending on domestically produced goods and services, imports must be subtracted. Likewise, exports
are added because they represent foreign spending on domestically produced goods and services.
2. Alternative Sequencing
©2017 Pearson Education, Inc. Publishing as Prentice Hall
3-18
For simplicity, investment is taken as exogenous. Chapter 5 describes the effects of output and the
interest rate on investment in the course of developing the IS-LM model. An alternative would be to
introduce the dependence of investment on the interest rate in this chapter, and then assume a fixed
interest rate. Since assuming a fixed interest rate is essentially equivalent to assuming exogenous
investment, this approach removes an (arguably) unnecessary step in the development of the IS-LM
framework. It also allows for early experiments with the effects of changes in the interest rate on output
as precursors to the derivation of the IS curve. On the other hand, introducing the interest rate at this
stage complicates the simple Keynesian cross story.
3. Enlivening the Lecture
The chapter does not cover explicitly fiscal policy experiments. Explaining these in lecture reinforces
concepts and provides an opportunity to link the model to current policy debates. For example, with
respect to fiscal stimulus packages, instructors could entertain the notion that the propensity to consume
might vary with income (or more accurately, wealth) and discuss how different distributions of tax
benefits might have different quantitative effects on consumption. The focus box on page 63 introduces
the “Paradox of Saving” which is also an interesting way to stimulate class discussion.
VI. EXTENSIONS
1. Macroeconomic Models
Some instructors may wish to supplement the discussion of model building in the text by distinguishing a
model’s structural form from its reduced form and by explaining the requirement that the number of
equations equal the number of exogenous variables. A model’s structural form sets out the model’s
postulates about behavior, definitions, and equilibrium conditions. A model’s reduced form expresses the
endogenous variables in terms of the exogenous ones. The number of equations must equal the number of
unknowns if the model is to provide a complete (not underdetermined) and coherent (not overdetermined)
explanation of the phenomenon of interest.
2. Inventory Investment
As noted above in Part III, apart from a few words in the text, the formal model of this chapter abstracts
from inventory investment. This simplifies the presentation and allows the identification of aggregate
demand with final sales. As an alternative, instructors could introduce and distinguish planned and
unplanned inventory investment and characterize goods-market equilibrium by the condition that
unplanned inventory investment equals zero. In this approach, aggregate demand does not, in general,
equal final sales.
3. Fiscal Policy
The discussion in the text omits several familiar fiscal policy issues, including the balanced budget
multiplier and the role of income taxes as automatic stabilizers. These issues are examined in problems at
the end of the chapter (see the solutions for a discussion). However, instructors may wish to consider
these issues in class
©2017 Pearson Education, Inc. Publishing as Prentice Hall
3-19