CHAPTER 10
Quick Check
1. a. True.
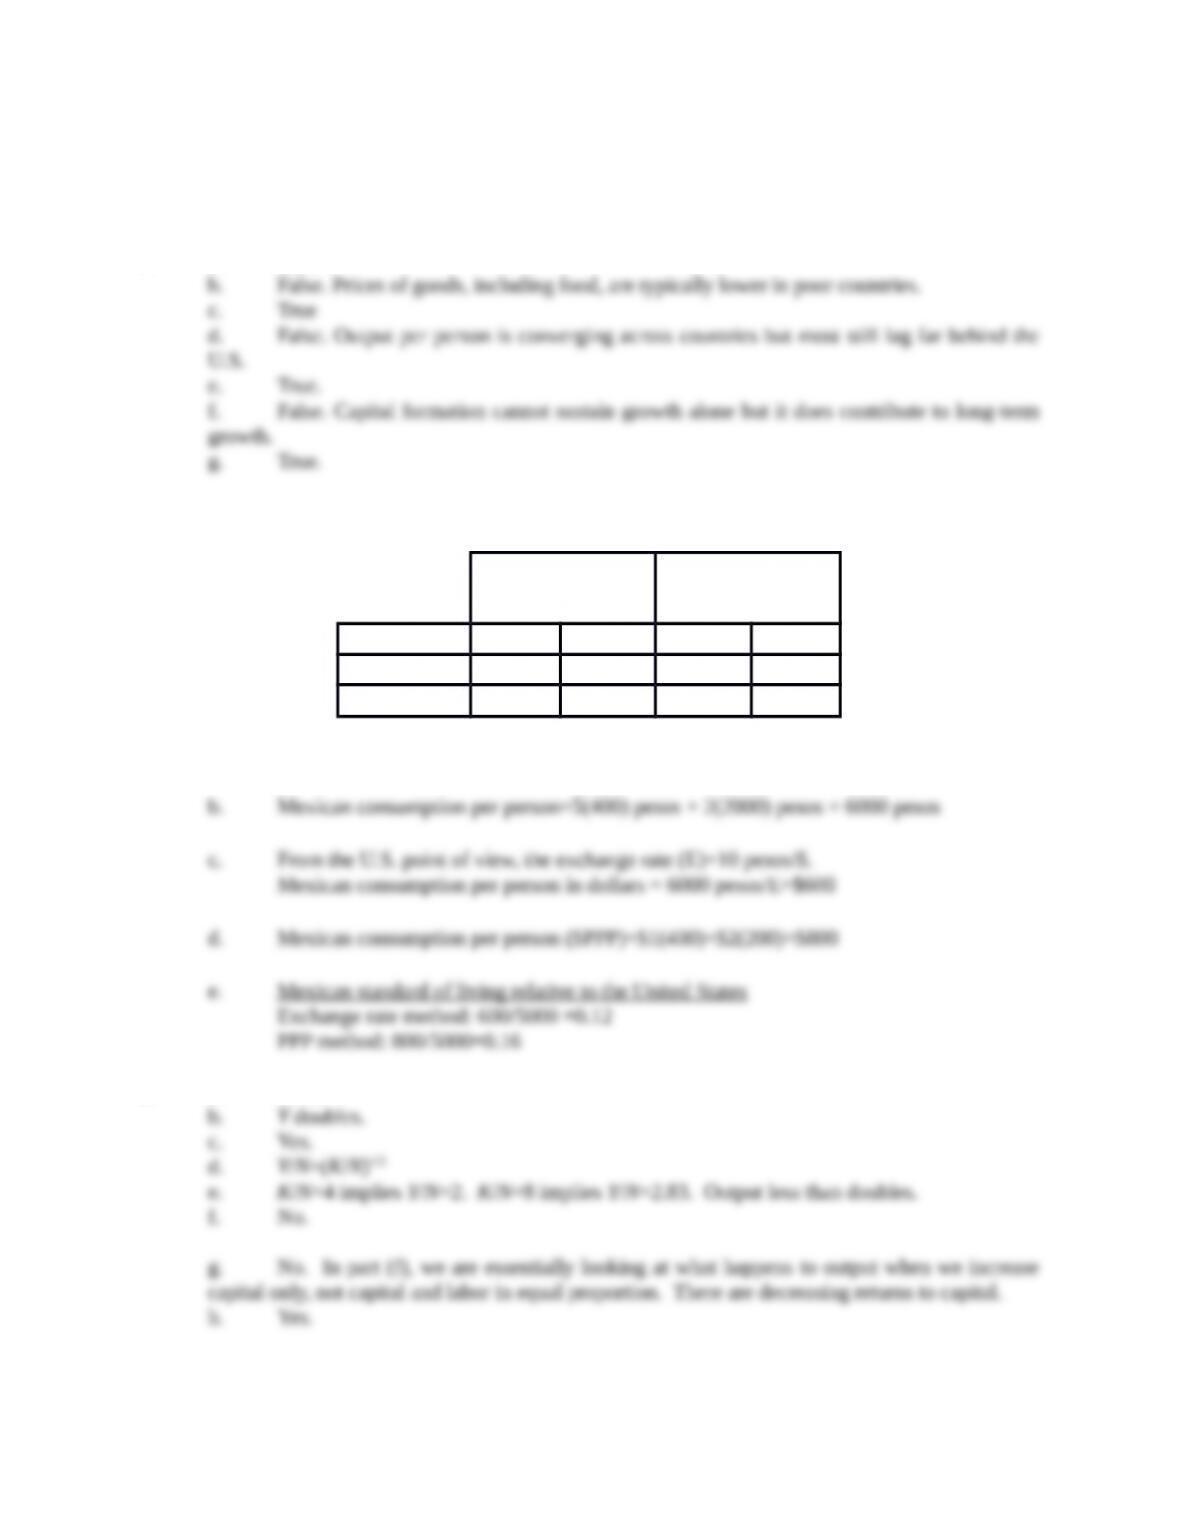
2. The table should read as follows.
Food
Transportation
Services
Price Quantity Price Quantity
Mexico 5 pesos 400 20 pesos 200
United States $1 1,000 $2 2,000
a. U.S. consumption per person = $1(1000) + $2(2,000)=$5000
3. a. Y=63
Dig Deeper
©2017 Pearson Education, Inc.
114
4. a. Y/Y = .5 (K/K)
d. No. Since capital is growing faster than output, the saving rate will have to increase to
5. Even though the United States was making the most important technical advances, the other
Explore Further
6. a. Japan tended to converge to the United States in the 1960-1990 period but not in the
b. Had Japan and the United States maintained their growth rates from the earlier period,
c. In fact, output growth per person slowed considerably in both countries but much more in
7. a. There was substantial convergence for the France, Belgium, and Italy. The ratio of per
b. These four African countries have not converged. In fact, the ratio of per capita real GDP
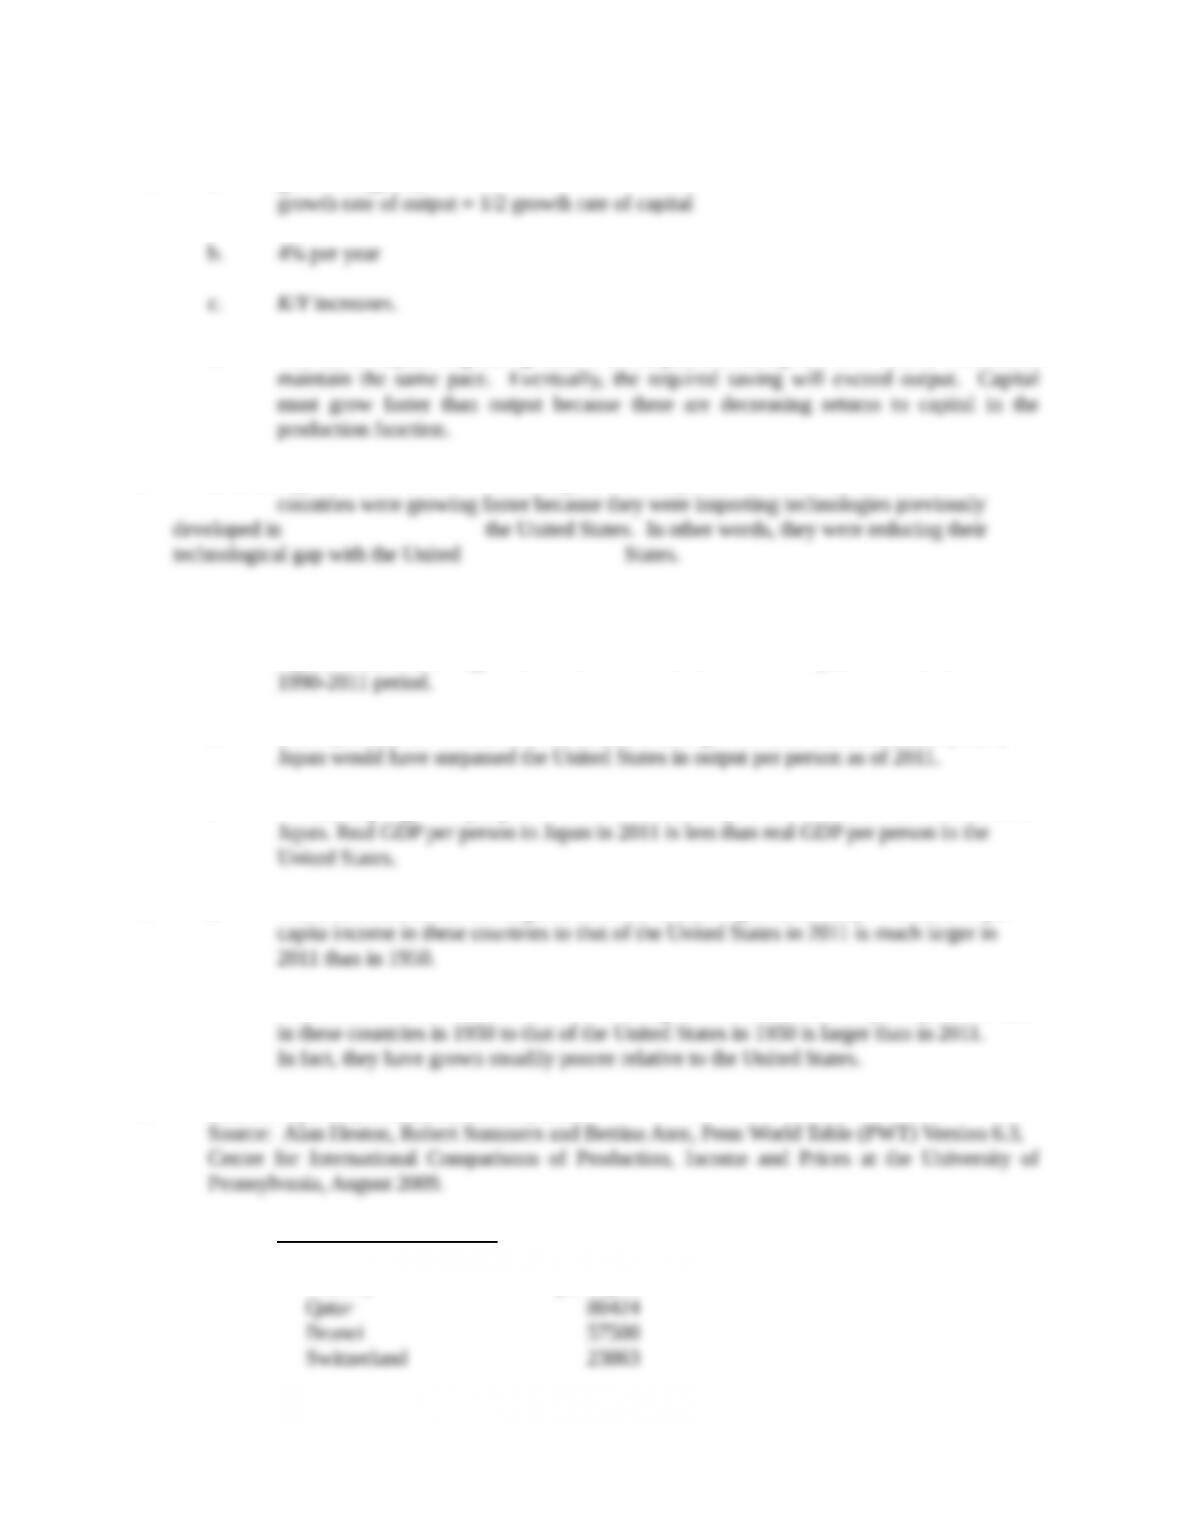
8. Real GDP per Capita ($2005), PPP adjusted
a. Richest 10 countries 1970
Country
Real GDP
per capita
©2017 Pearson Education, Inc.
115
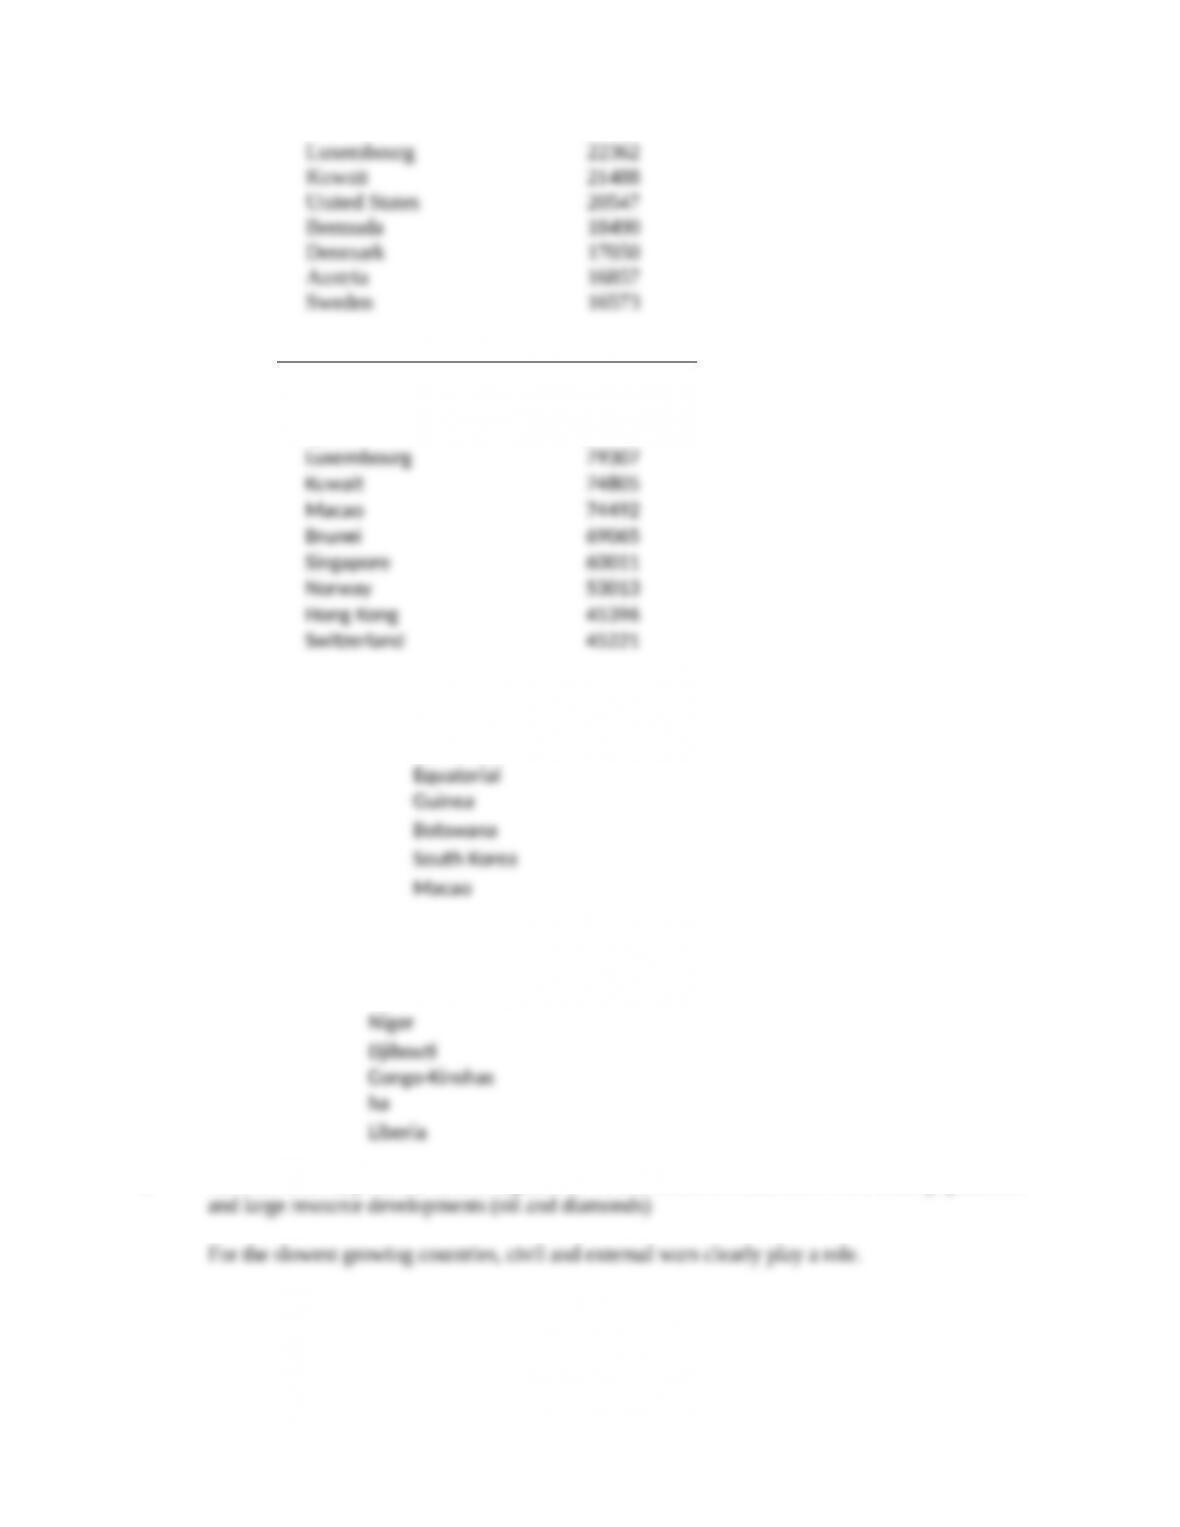
b. 10 Richest Countries (in the data sample) in 2011
Per capita
real GDP
Qatar 134040
c-d. The five fastest growing countries are
Ethiopia
The five slowest growing countries are
e. Answers will vary. In the case of Equatorial Guinea and Botswana there were small populations
©2017 Pearson Education, Inc.
116
Zimbabwe