P8-20. Interpreting beta
LG 5; Basic
Effect of change in market return on asset with beta of 1.20:
P8-21. Betas
LG 5; Basic
a. and b.
Asset Beta
Increase in
Market Return
Expected Impact
on Asset Return
Decrease in
Market Return
Impact on
Asset Return
d. Asset C would be the appropriate choice because it is a defensive asset, moving in opposition to the
P8-22. Personal finance: Betas and risk rankings
LG 5; Intermediate
a.
Stock Beta
b. and c.
Asset Beta
Increase in
Market Return
Expected Impact
on Asset Return
Decrease in
Market Return
Impact on
Asset Return
d. In a declining market, an investor would choose the defensive stock, Stock C. While the market
e. In a rising market, an investor would choose Stock B, the aggressive stock. As the market rises one
© 2015 Pearson Education, Inc.
2 Gitman/Zutter Principles of Managerial Finance, Brief, Seventh Edition
P8-23. Personal finance: Portfolio betas: bp
1
n
j j
j
w b
=
´
å
LG 5; Intermediate
a.
Portfolio A Portfolio B
A
B
b. Portfolio A is slightly less risky than the market (average risk), while Portfolio B is more risky than
P8-24. Capital asset pricing model (CAPM): rj RF [bj(rm RF)]
LG 6; Basic
Case rjRF [bj(rm RF)]
P8-25. Personal finance: Beta coefficients and the capital asset pricing model
LG 5, 6; Intermediate
To solve this problem you must take the CAPM and solve for beta. The resulting model is
Beta F
m F
r R
r R
–
=–
a.
10% 5% 5%
Beta 0.4545
16% 5% 11%
–
= = =
–
b.
15% 5% 10%
Beta 0.9091
16% 5% 11%
–
= = =
–
c.
18% 5% 13%
Beta 1.1818
16% 5% 11%
–
= = =
–
d.
20% 5% 15%
Beta 1.3636
16% 5% 11%
–
= = =
–
e. If Katherine is willing to take a maximum of average risk then she will be able to have an expected
© 2015 Pearson Education, Inc.
Chapter 8: Risk and Return 3
P8-26. Manipulating CAPM: rj RF [bj(rm RF)]
LG 6; Intermediate
P8-27. Personal finance: Portfolio return and beta
LG 1, 3, 5, 6: Challenge
a. bp (0.20)(0.80) (0.35)(0.95) (0.30)(1.50) (0.15)(1.25)
b. rA
($20,000 $20,000) $1,600 $1,600 8%
$20,000 $20,000
– +
= = =
rB
($36,000 $35,000) $1,400 $2,400 6.86%
$35,000 $35,000
– +
= = =
rC
($34,500 $30,000) 0 $4,500 15%
$30,000 $30,000
– +
= = =
rD
($16,500 $15,000) $375 $1,875 12.5%
$15,000 $15,000
– +
= = =
c. rP
($107,000 $100,000) $3,375 $10,375 10.375%
$100,000 $100,000
– +
= = =
e. Of the four investments, only C (15% vs. 13%) and D (12.5% vs. 11.5%) had actual returns that
exceeded the CAPM expected return (15% vs. 13%). The underperformance could be due to any
© 2015 Pearson Education, Inc.
4 Gitman/Zutter Principles of Managerial Finance, Brief, Seventh Edition
P8-28. Security market line, SML
LG 6; Intermediate
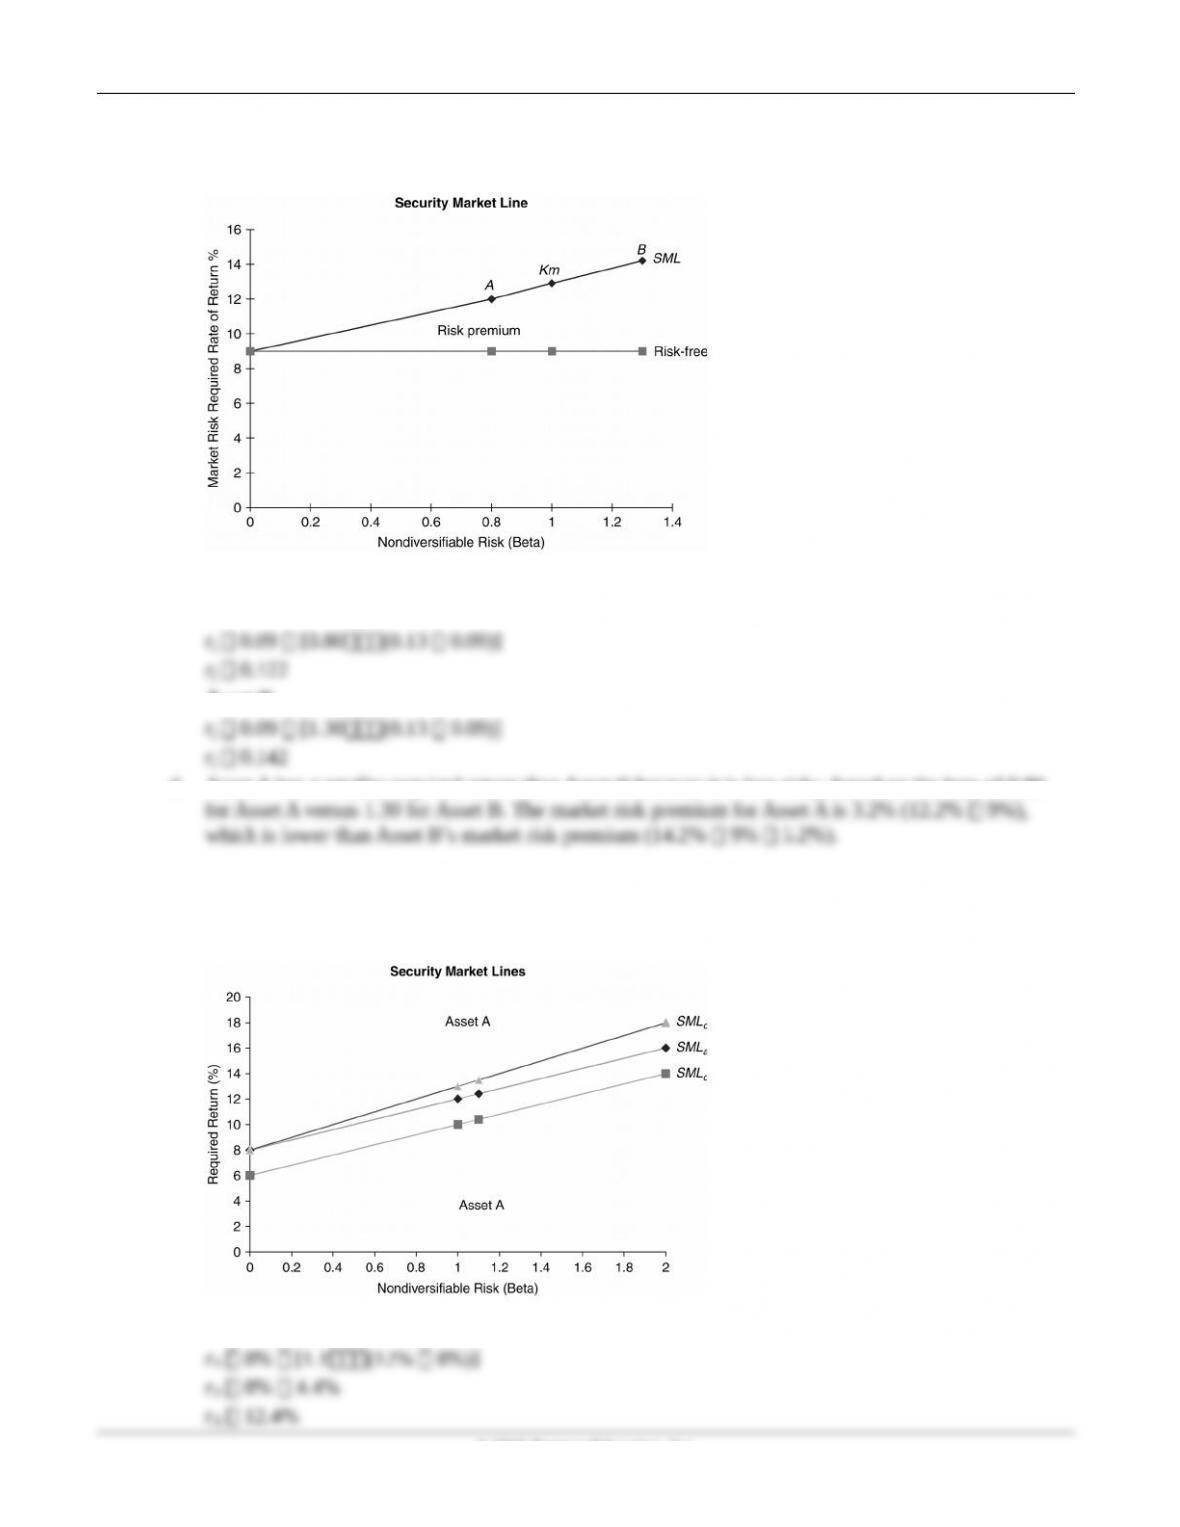
a, b, and d.
c. rj RF [bj(rm RF)]
Asset A
Asset B
d. Asset A has a smaller required return than Asset B because it is less risky, based on the beta of 0.80
P8-29. Shifts in the security market line
LG 6; Challenge
a, b, c, d.
b. rj RF [bj(rm RF)]
© 2015 Pearson Education, Inc.
Chapter 8: Risk and Return 5
c. rA 6% [1.1(10% 6%)]
d. rA 8% [1.1(13% 8%)]
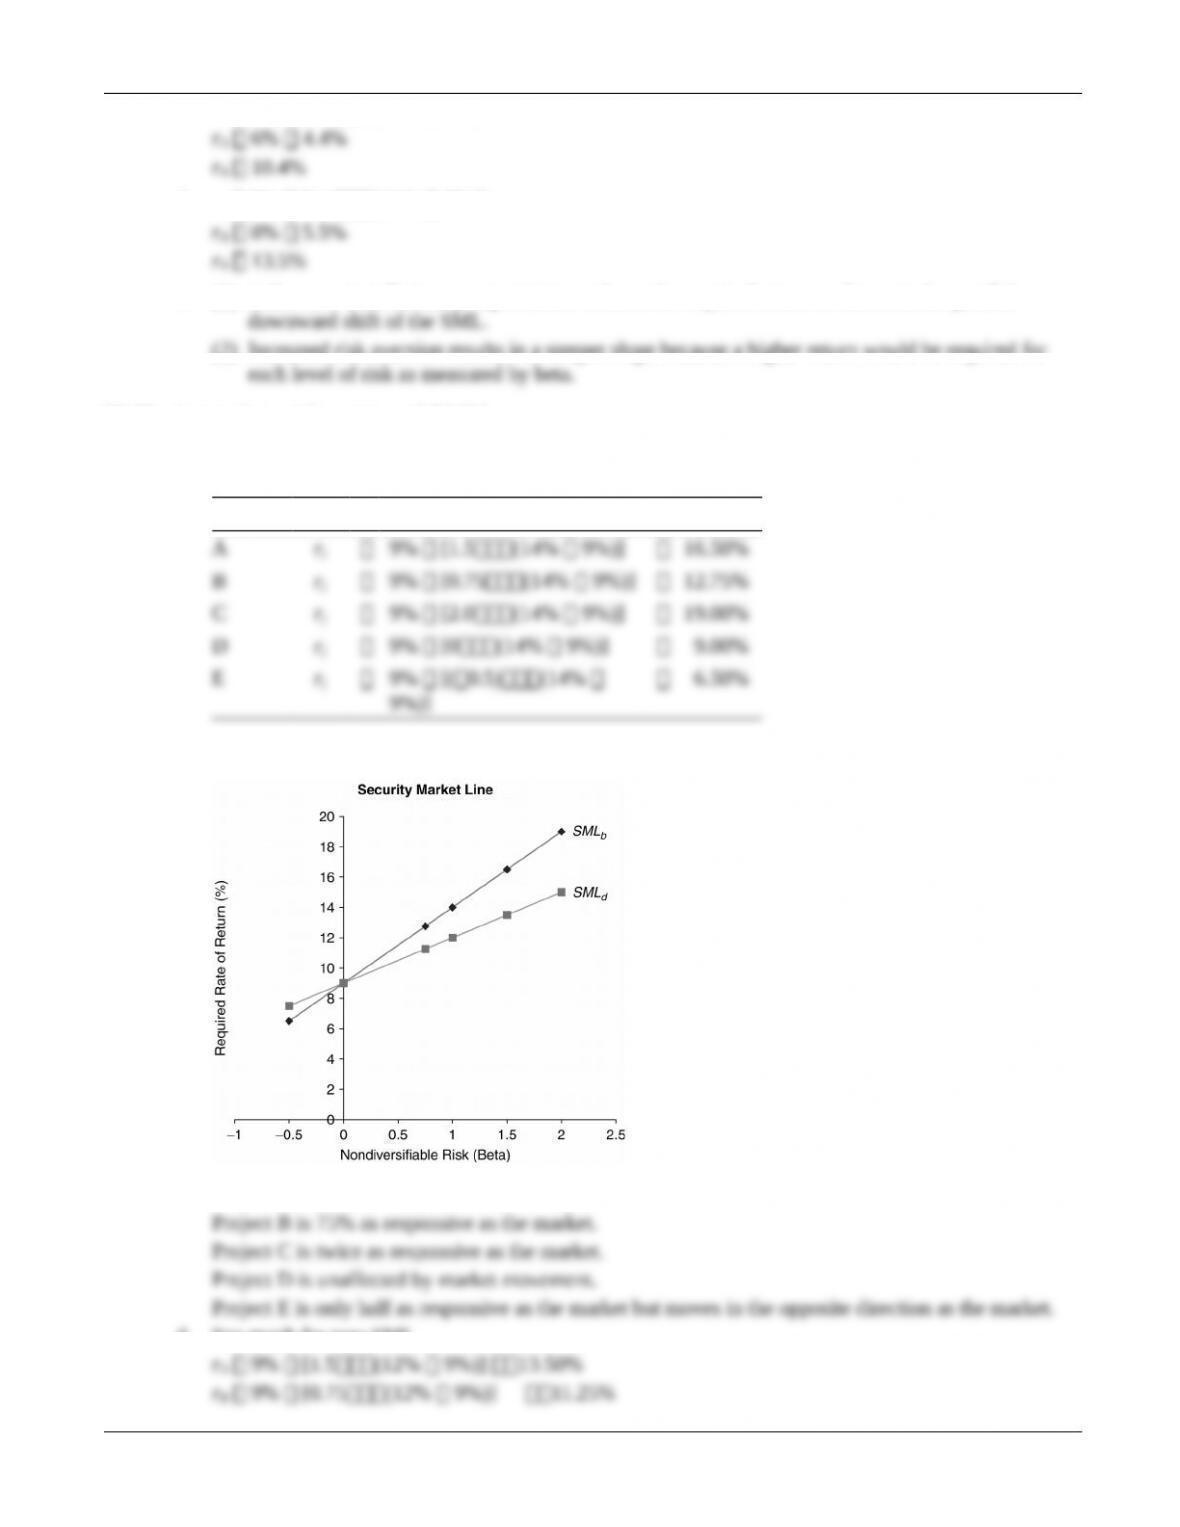
e. (1) A decrease in inflationary expectations reduces the required return as shown in the parallel
(2) Increased risk aversion results in a steeper slope because a higher return would be required for
P8-30. Integrative—risk, return, and CAPM
LG 6; Challenge
a.
Project rjRF [bj(rm RF)]
9%)]
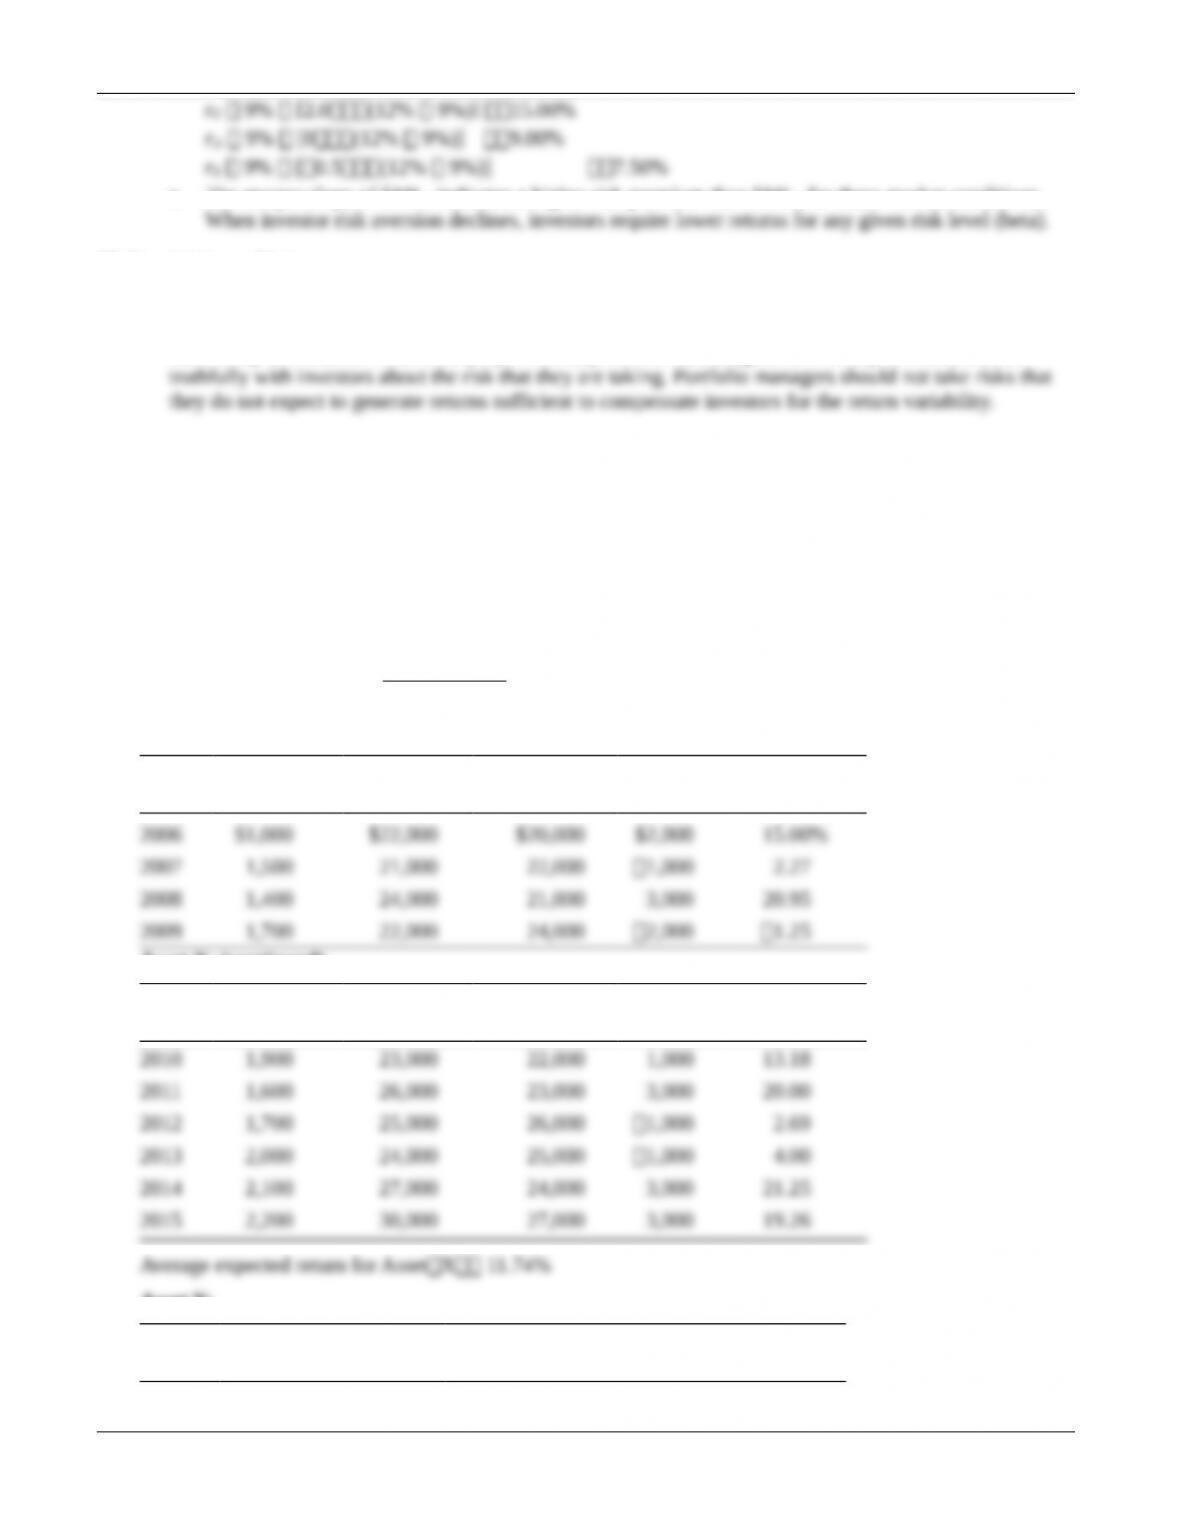
b. and d.
c. Project A is 150% as responsive as the market.
d. See graph for new SML.
© 2015 Pearson Education, Inc.
6 Gitman/Zutter Principles of Managerial Finance, Brief, Seventh Edition
e. The steeper slope of SMLb indicates a higher risk premium than SMLd for these market conditions.
P8-31. Ethics problem
LG 1; Intermediate
Investors expect managers to take risks with their money, so it is clearly not unethical for managers to
make risky investments with other people’s money. However, managers have a duty to communicate
Case
Case studies are available on www.myfinancelab.com.
Analyzing Risk and Return on Chargers Products’ Investments
This case requires students to review and apply the concept of the risk-return tradeoff by analyzing two possible
asset investments using standard deviation, coefficient of variation, and CAPM.
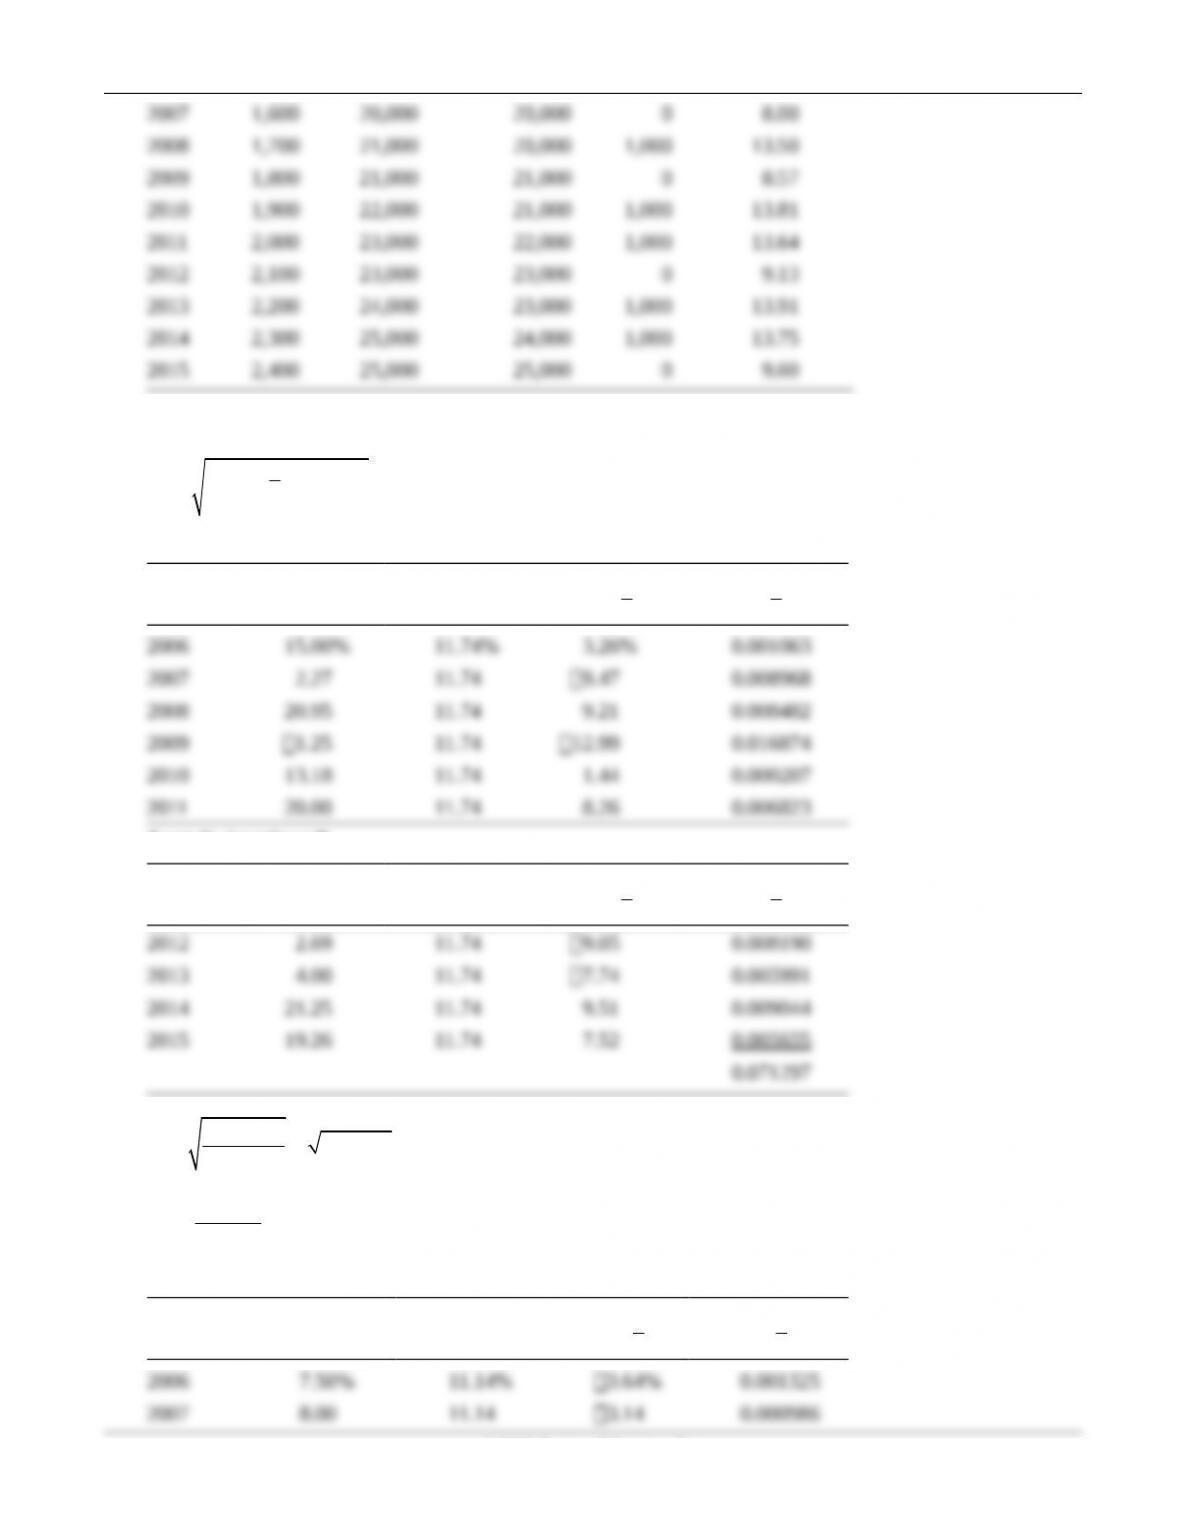
a. Expected rate of return:
1
1
( )
t t t
t
t
P P C
rP
–
–
– +
=
Asset X:
Year
Cash
Flow (Ct)
Ending
Value (Pt)
Beginning
Value (Pt – 1)
Gain/
Loss
Annual Rate
of Return
Asset X: (continued)
Year
Cash
Flow (Ct)
Ending
Value (Pt)
Beginning
Value (Pt – 1)
Gain/
Loss
Annual Rate
of Return
Asset Y:
Year
Cash
Flow (Ct)
Ending
Value (Pt)
Beginning
Value (Pt – 1)
Gain/
Loss
Annual Rate
of Return
2006 $1,500 $20,000 $20,000 $ 0 7.50%
© 2015 Pearson Education, Inc.
Chapter 8: Risk and Return 7
Average expected return for Asset Y 11.14%
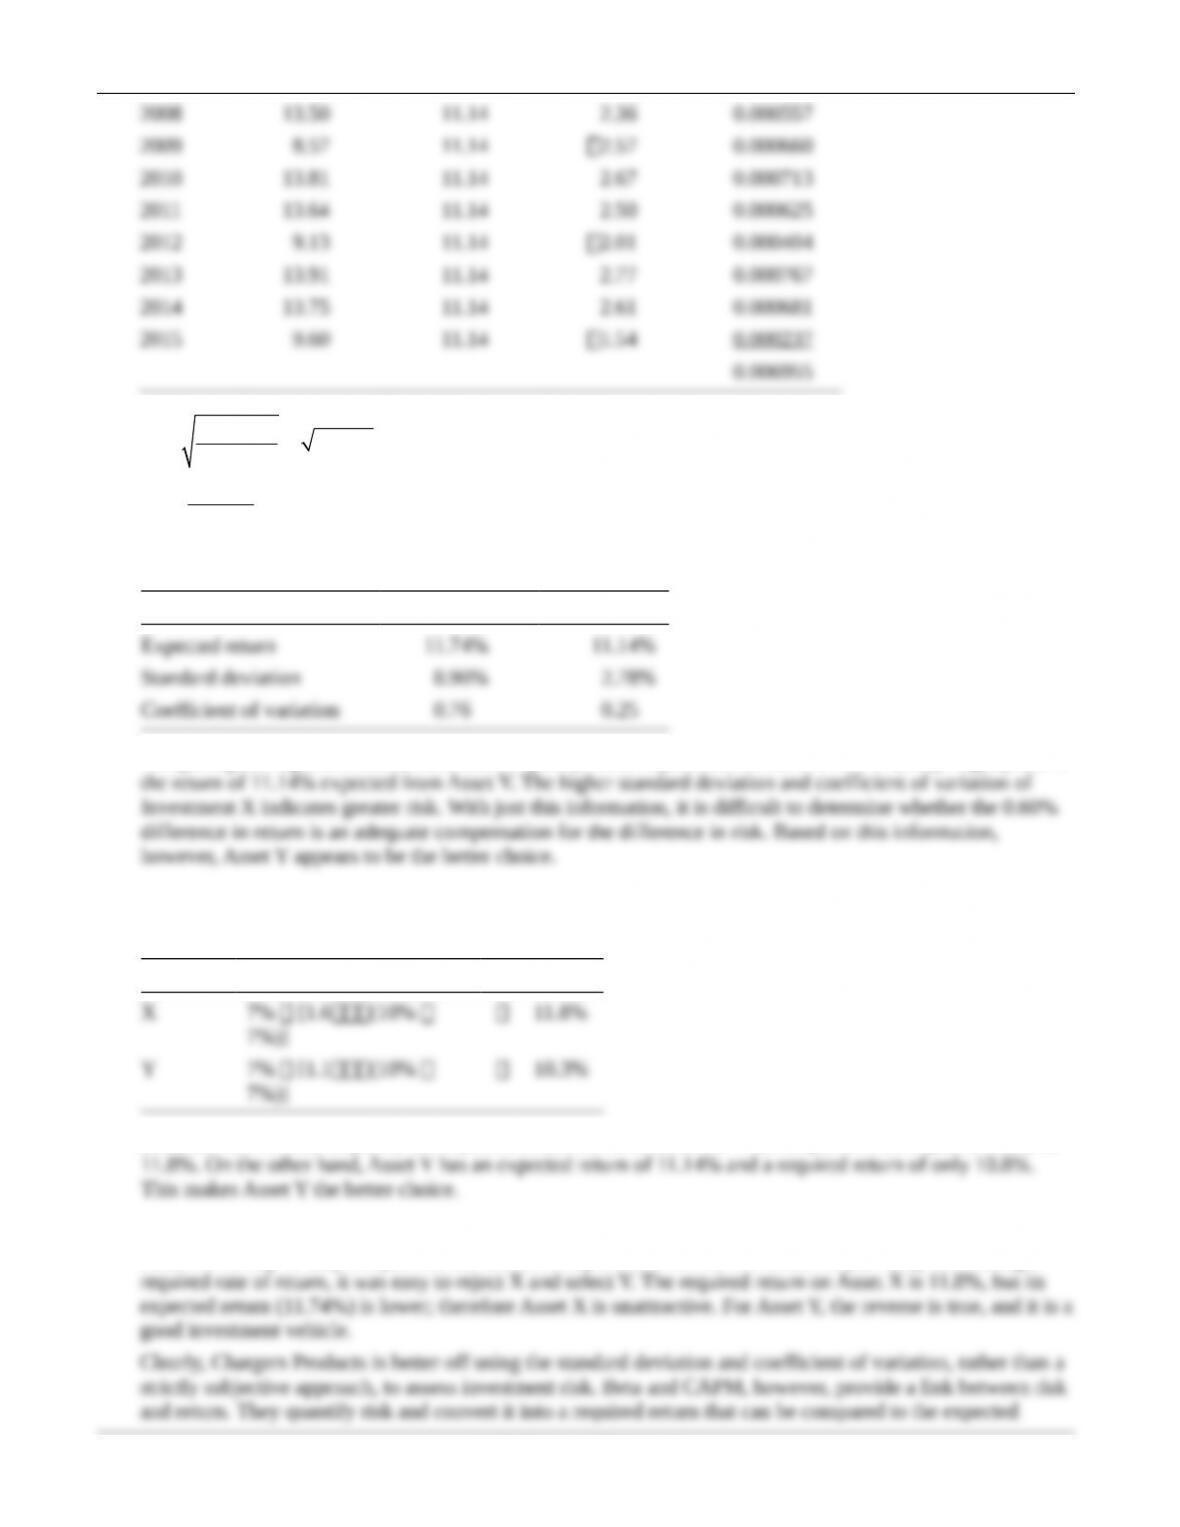
b. r
2
1
( ) ( 1)
n
i
i
r r n
=
– ¸ –
å
Asset X:
Year
Return
ri
Average
Return, r
( )–
i
r r
( )–
i
r r
2
Asset X: (continued)
Year
Return
ri
Average
Return, r
( )–
i
r r
( )–
i
r r
2
8 Gitman/Zutter Principles of Managerial Finance, Brief, Seventh Edition
Chapter 8: Risk and Return 9
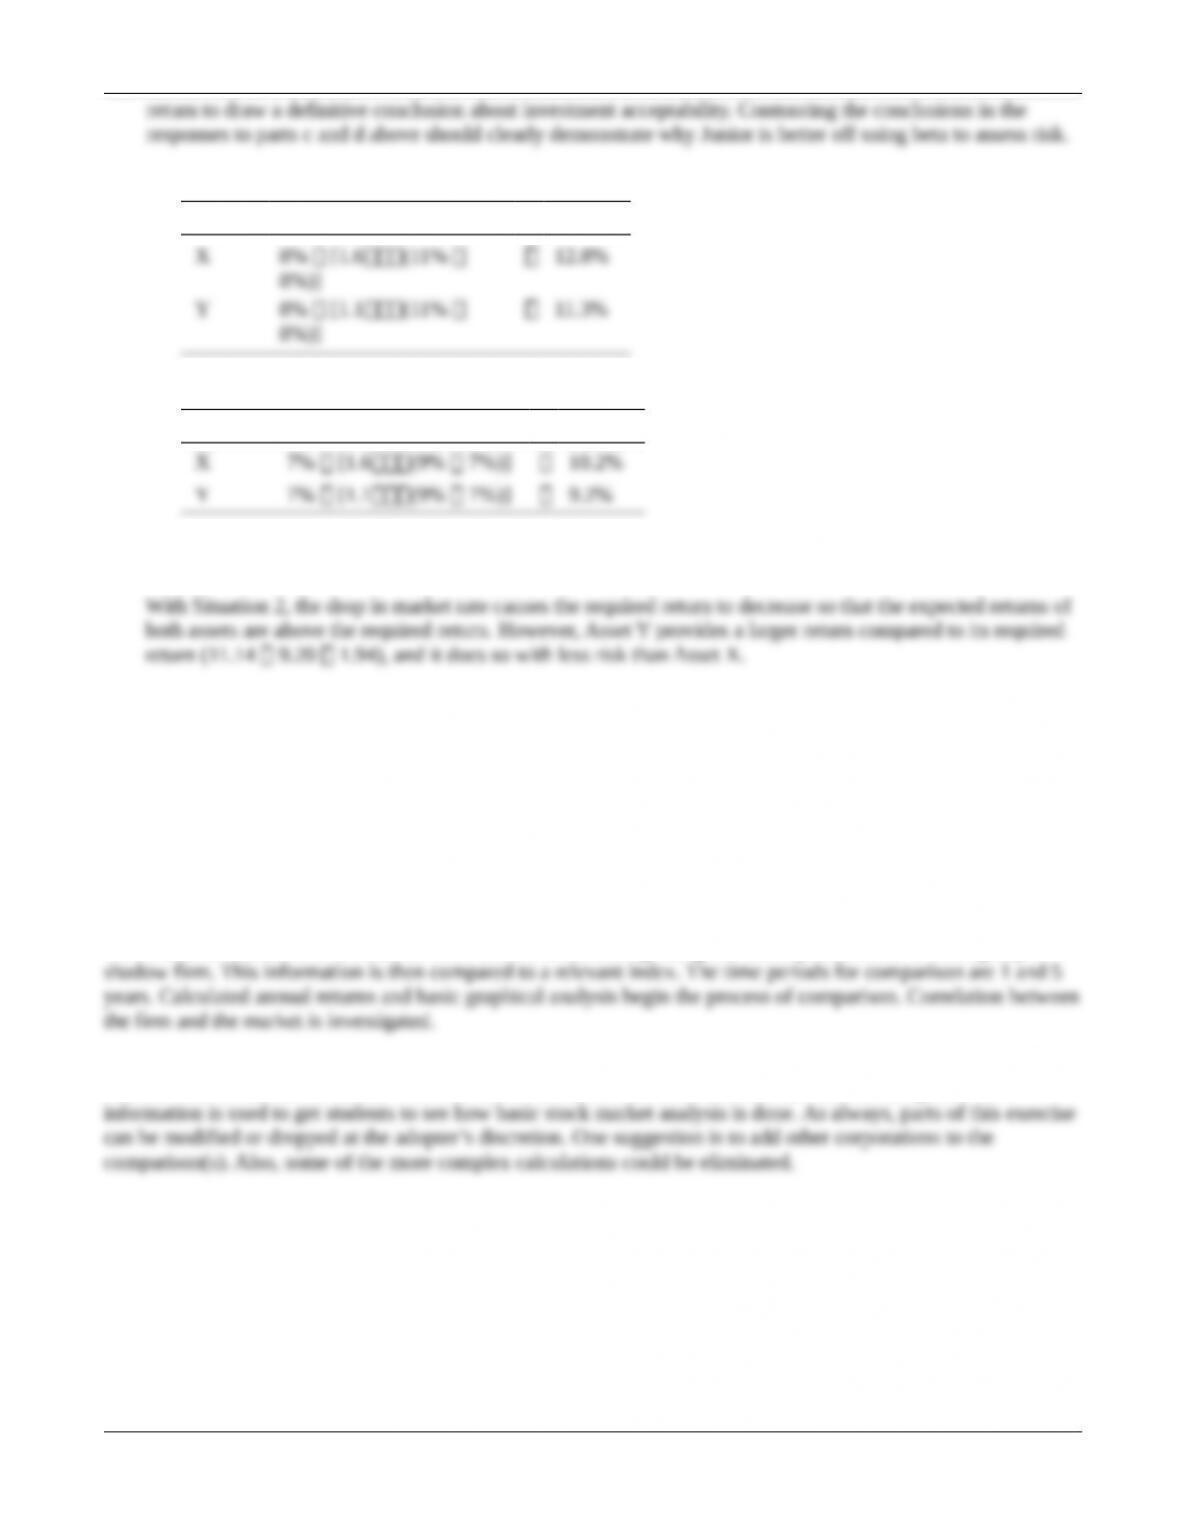
f. 1. Increase in risk-free rate to 8% and market return to 11%:
Asset RF [bj(rm RF)] rj
8%)]
2. Decrease in market return to 9%:
Asset RF [bj(rm RF)] rj
In Situation 1, the required return rises for both assets, and neither has an expected return above the firm’s
required return.
Spreadsheet Exercise
The answer to Chapter 8’s stock portfolio analysis spreadsheet problem is located on the Instructor’s Resource
Center at www.pearsonhighered.com/irc under the Instructor’s Manual.
Group Exercise
Group exercises are available in www.myfinancelab.com.
This exercise uses current information from several websites regarding the recent performance of each group’s
Accurate and timely information is the first message of this assignment. Students are encouraged to look at several
sites and also to search for others. The information content of the different sites can then be compared. This
© 2015 Pearson Education, Inc.