P8-10. Assessing return and risk
LG 2; Challenge
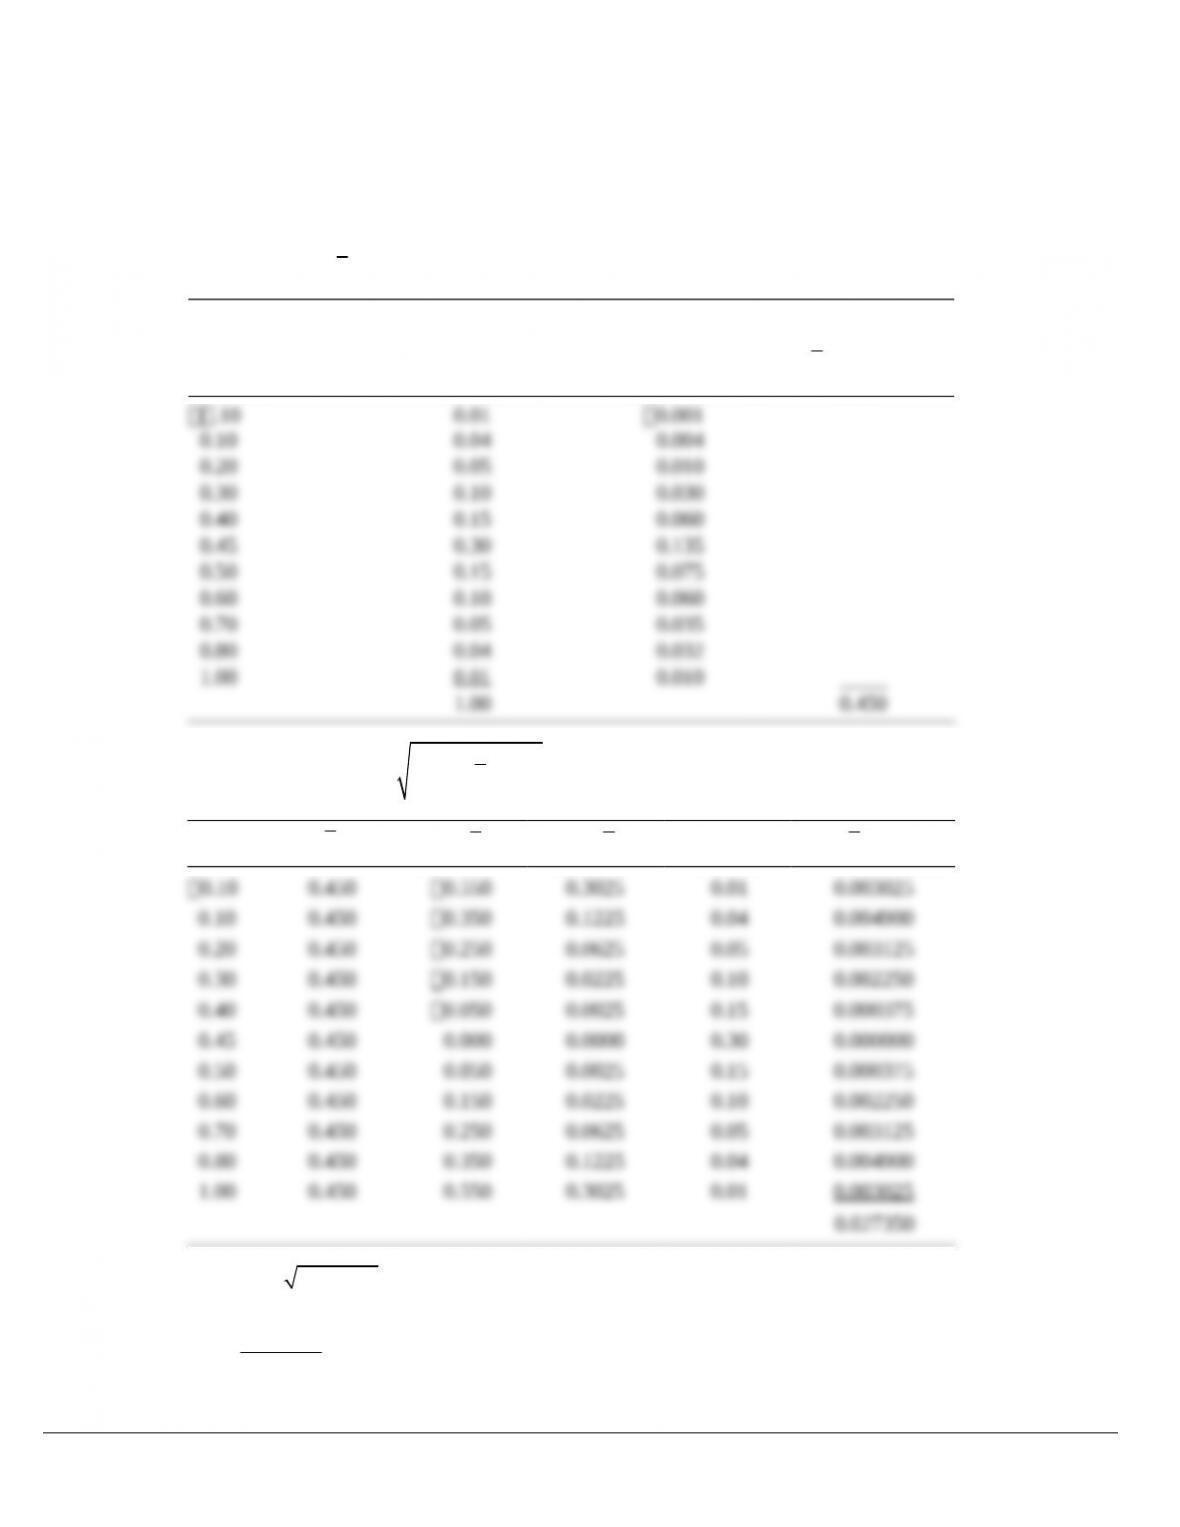
a. Project 257
(1) Range: 1.00 (.10) 1.10
(2) Expected return:
=1
n
i ri
i
r r P= ´
å
Rate of Return
ri
Probability
Pr i
Weighted Value
ri Pr i
Expected Return
å
1=
= ´
n
i ri
i
r r P
(3) Standard deviation:
2
1
( )
n
i ri
i
r r Ps
=
= – ´
å
ri
r
–
i
r r
( )–
i
r r
2Pr i
( )–
i
r r
2Pr i
2 Gitman/Zutter Principles of Managerial Finance, Brief, Seventh Edition
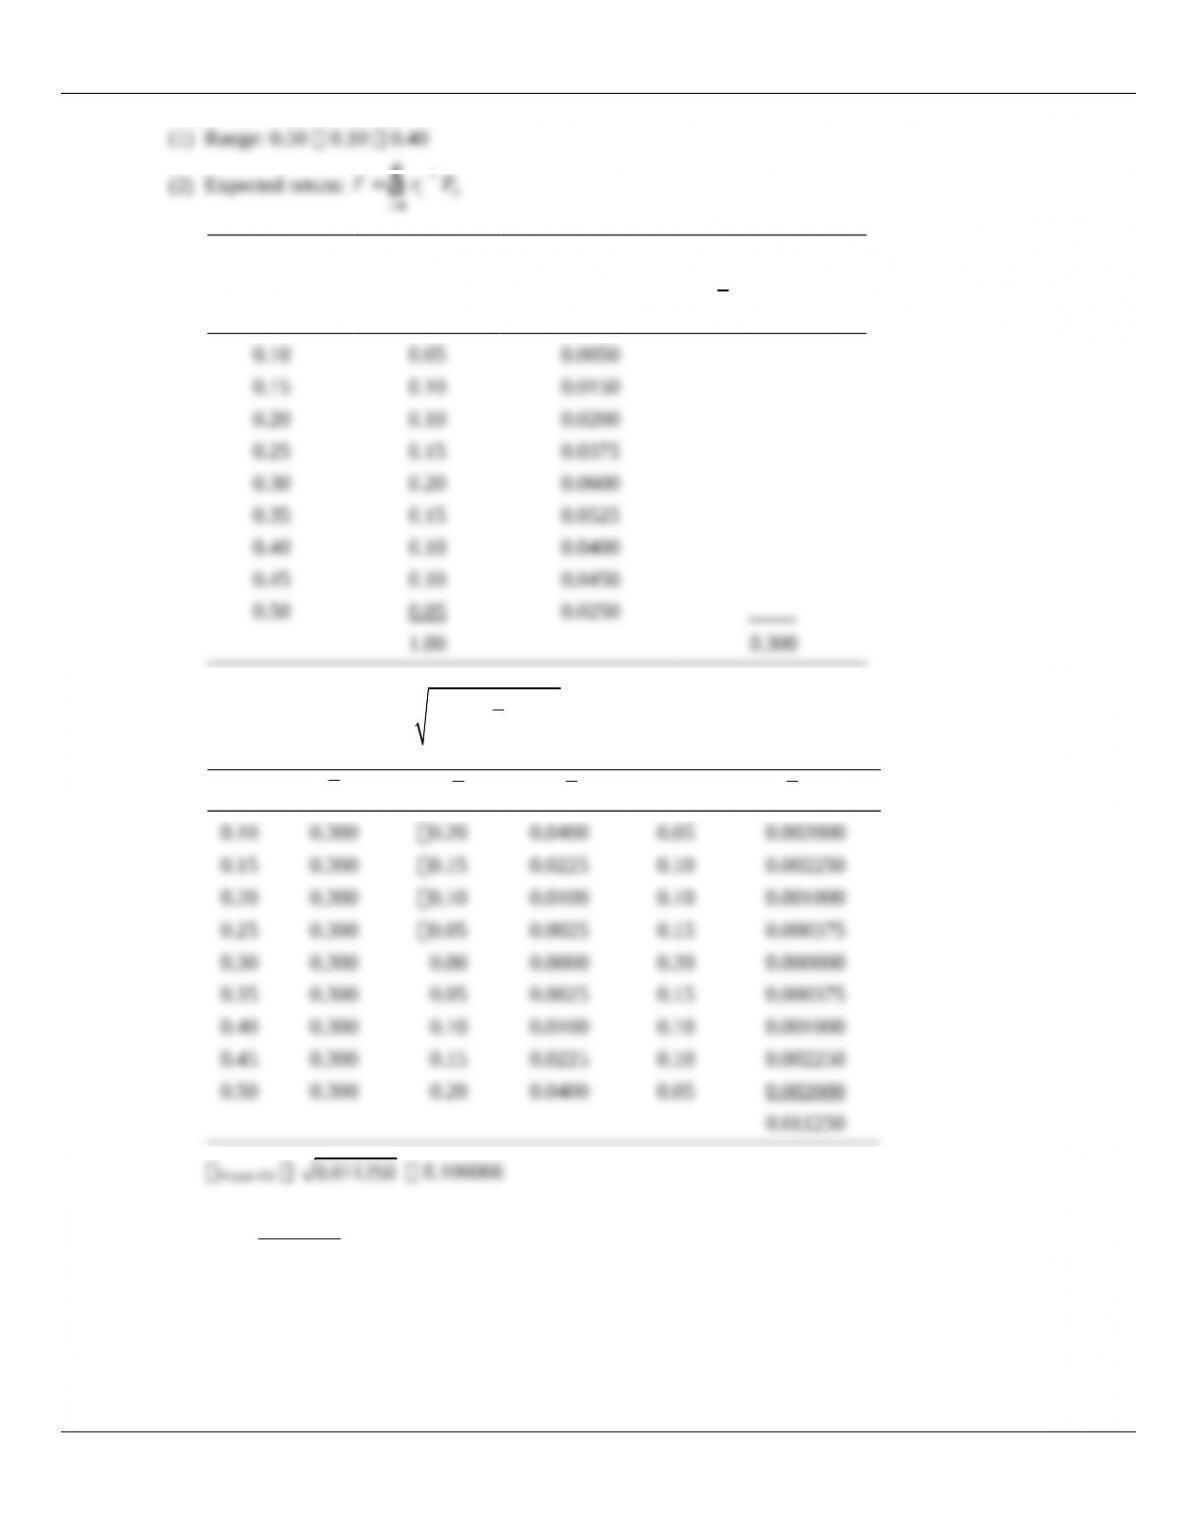
Project 432
1
i
=
Rate of Return
ri
Probability
Pr i
Weighted Value
riPri
Expected Return
å
=1
= ´
n
i ri
i
r r P
(3) Standard deviation:
2
1
( )
n
i ri
i
r r Ps
=
= – ´
å
ri
r
–
i
r r
2
( )
i
r r–
Pri
P
2
( )
i ri
r r– ´
Project 432
0.011250
0.106066
(4)
0.106066 0.3536
0.300
CV = =
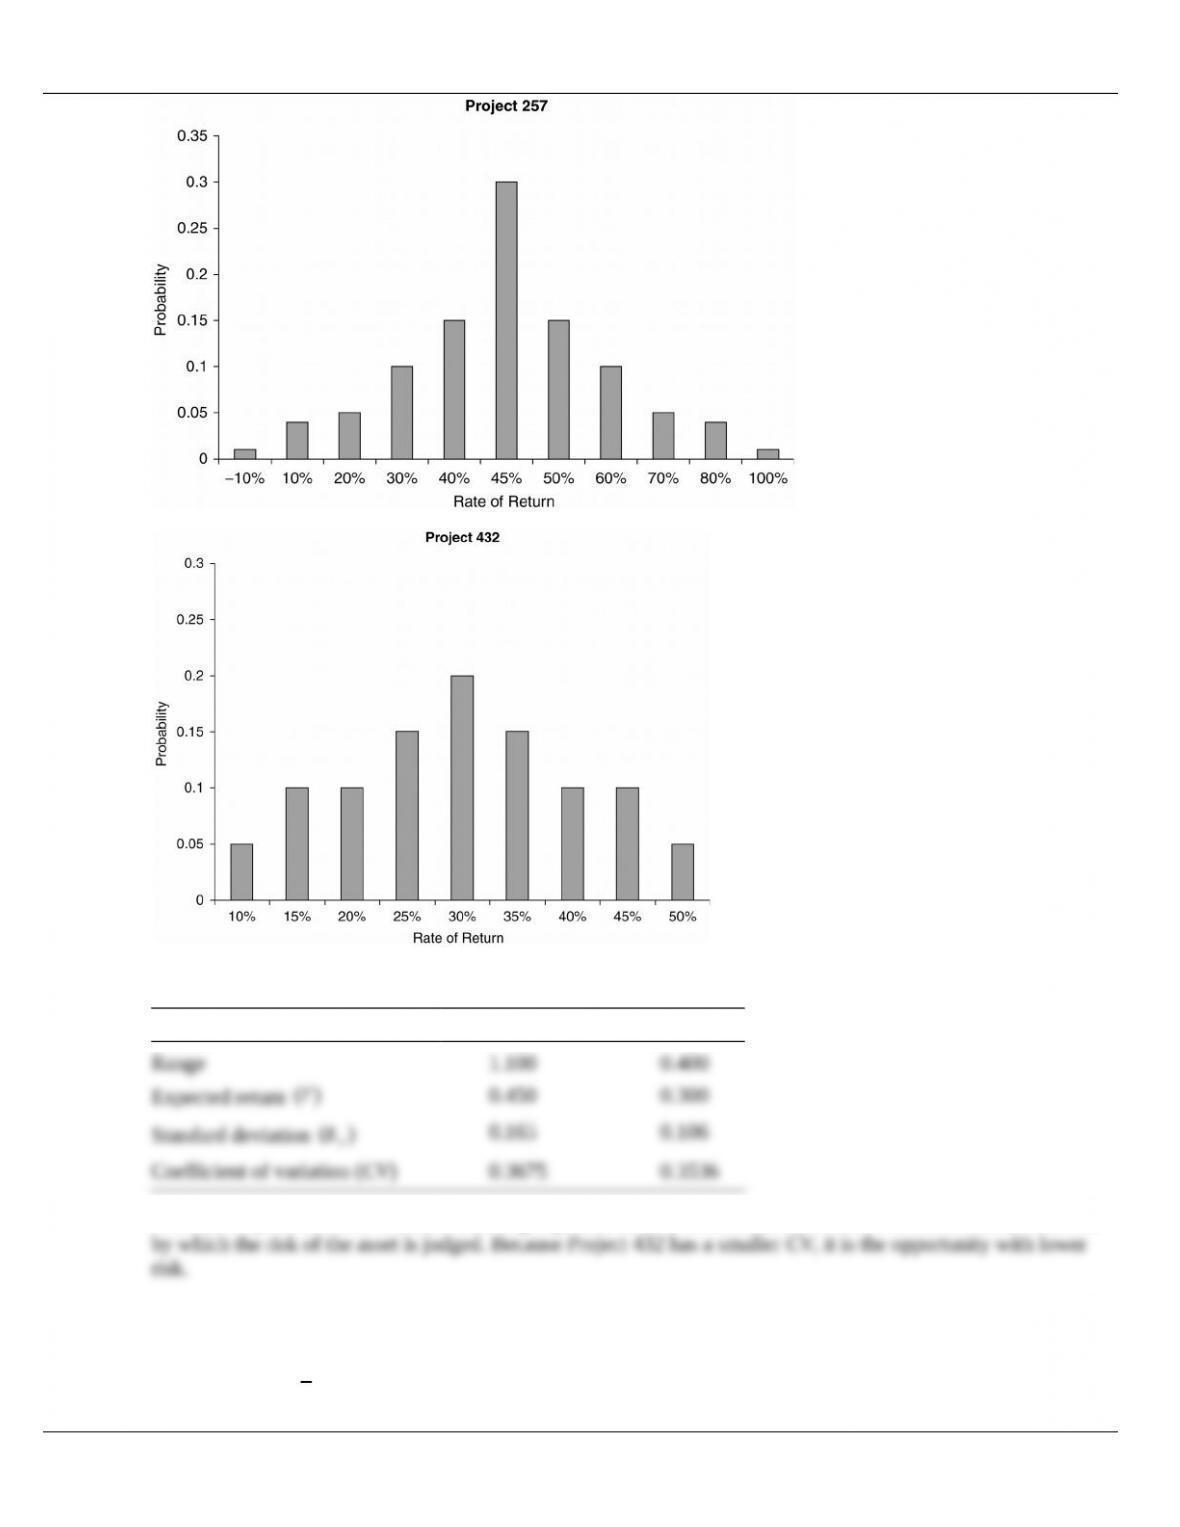
b. Bar Charts
© 2015 Pearson Education, Inc.
Chapter 3: Financial Statements and Ratio Analysis 3
c. Summary statistics
Project 257 Project 432
Because Projects 257 and 432 have differing expected values, the coefficient of variation should be the criterion
P8-11. Integrative—expected return, standard deviation, and coefficient of variation
LG 2; Challenge
a. Expected return:
1
n
i ri
i
r r P
=
= ´
å
© 2015 Pearson Education, Inc.
Continued
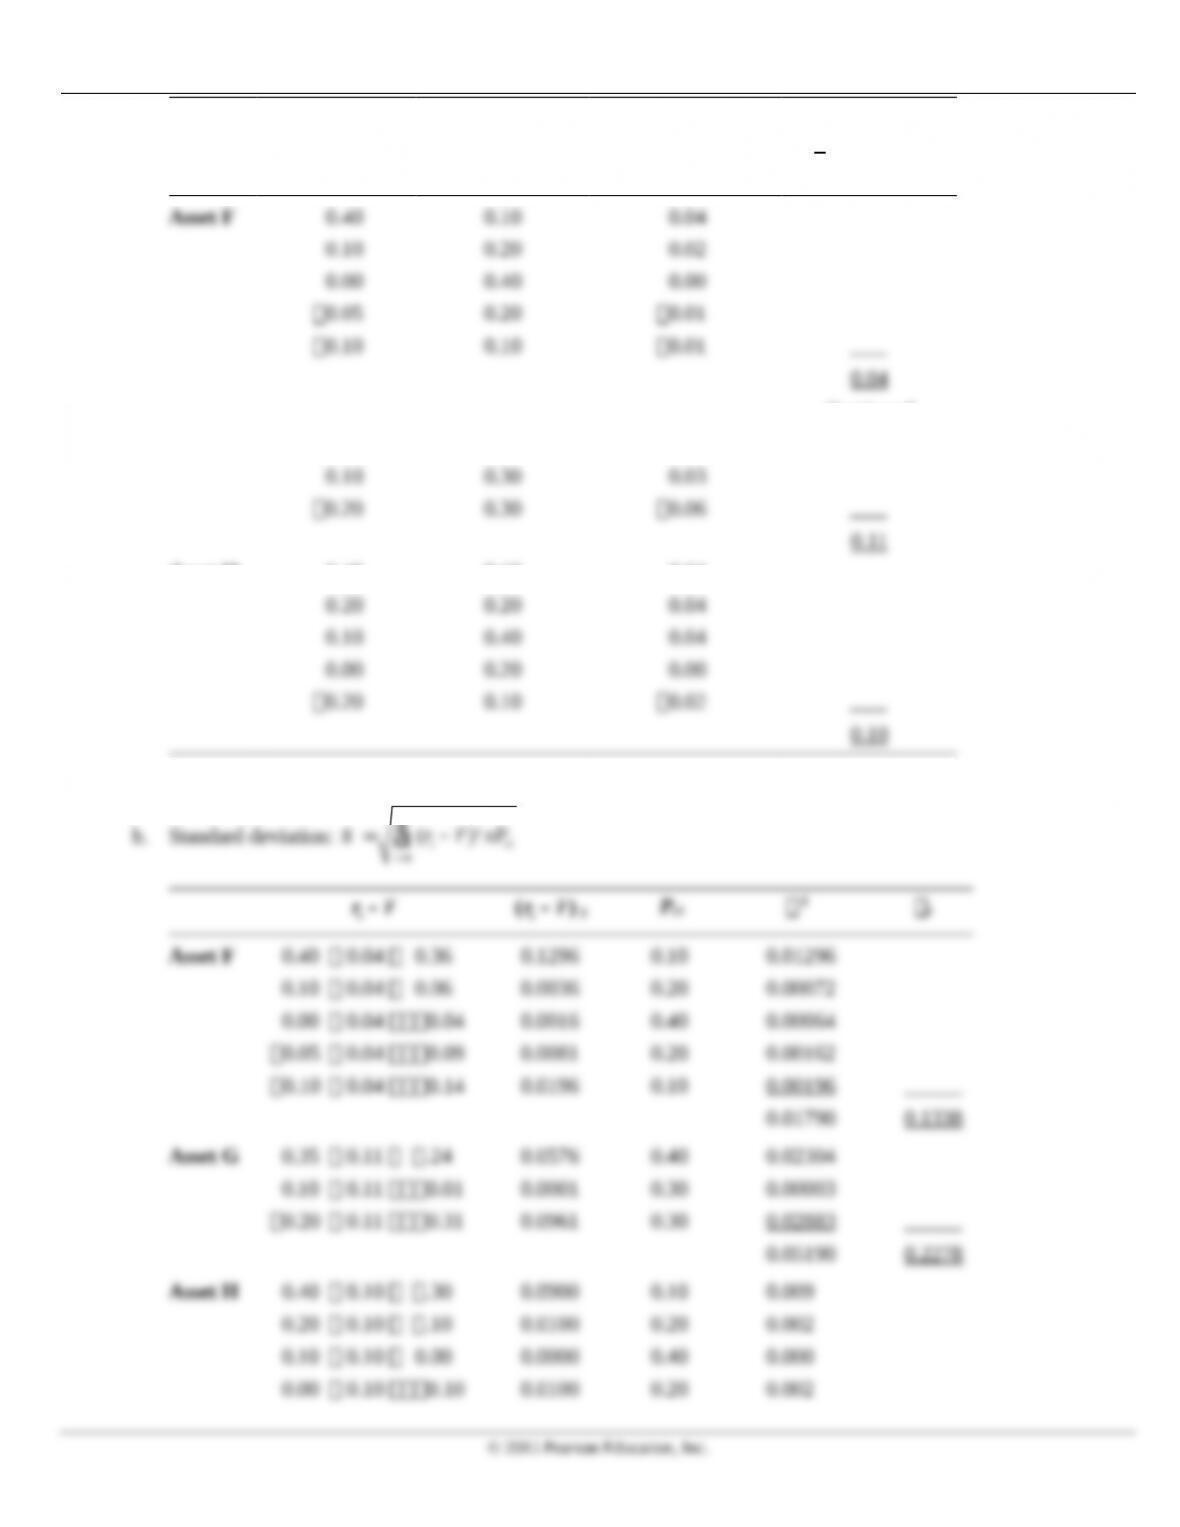
Asset G 0.35 0.40 0.14
Asset H 0.40 0.10 0.04
Asset G provides the largest expected return.
2
n
Chapter 3: Financial Statements and Ratio Analysis 5
Based on standard deviation, Asset G appears to have the greatest risk, but it must be measured against its
c.
standard deviation ( )
Coefficient of variation = expected value
s
Asset F:
0.1338 3.345
0.04
CV = =
Asset G:
0.2278 2.071
0.11
CV = =
Asset H:
0.1483 1.483
0.10
CV = =
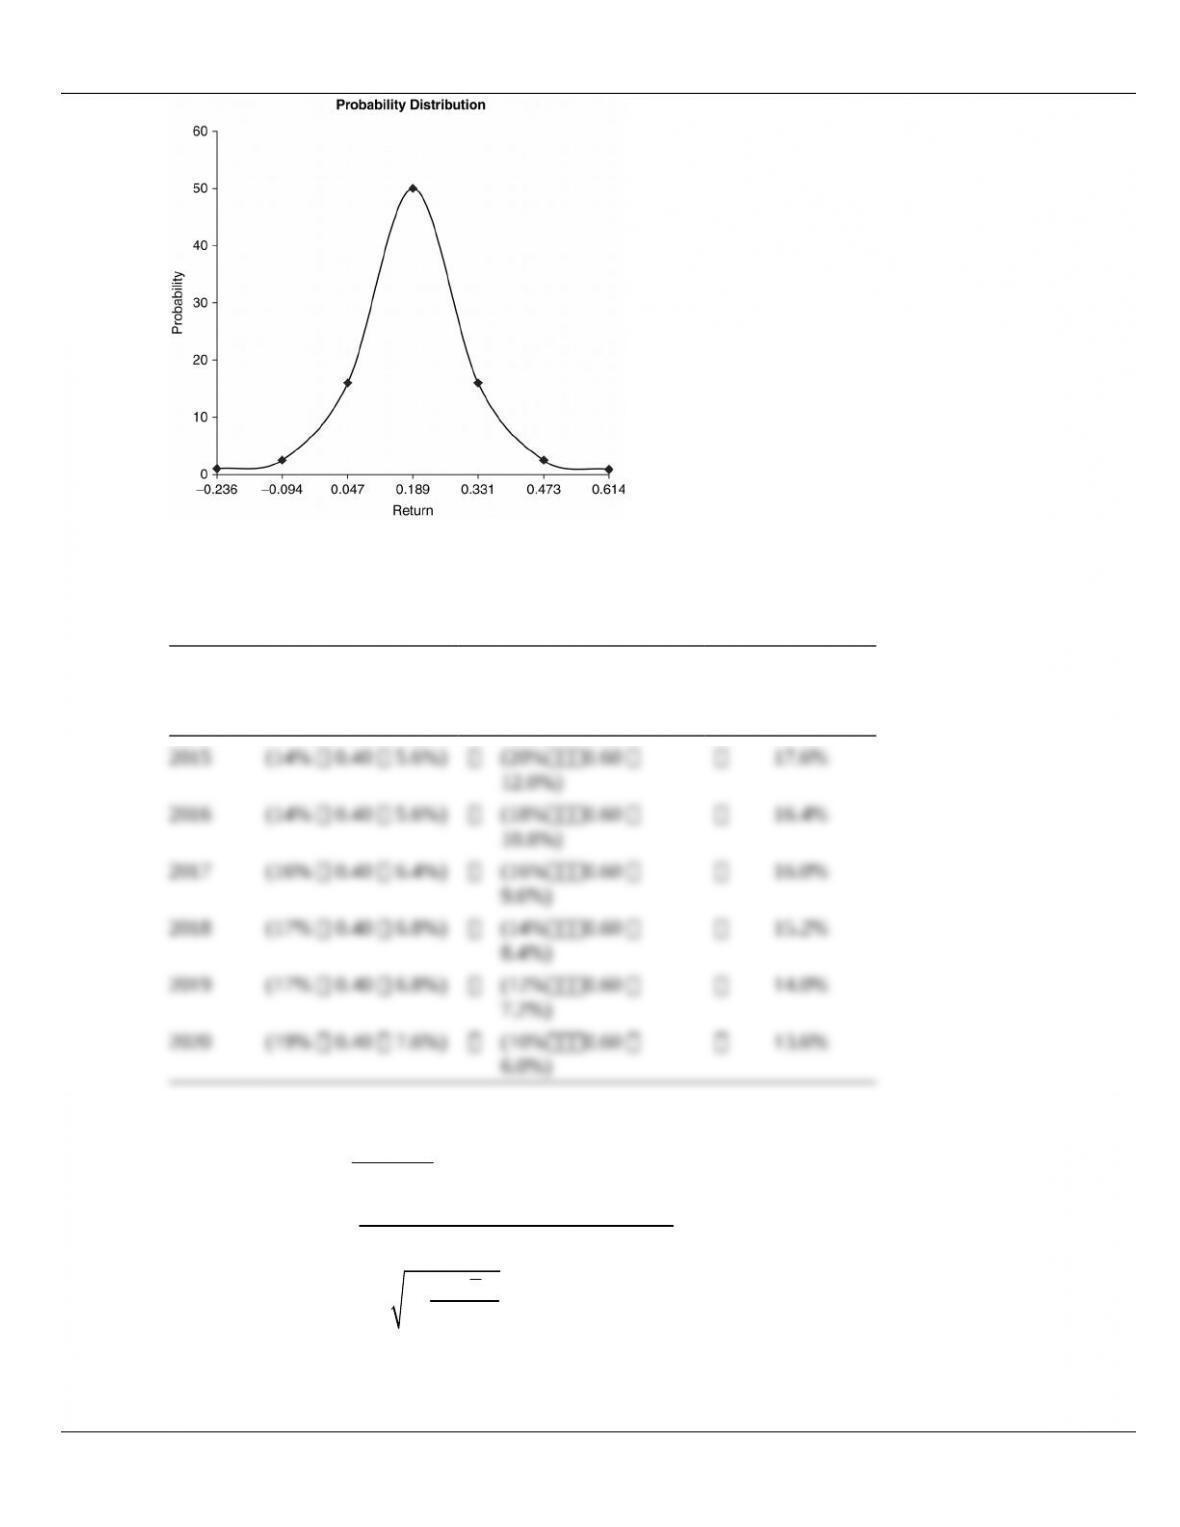
P8-12. Normal probability distribution
LG 2; Challenge
a. Coefficient of variation: CV
rrs¸
b. (1) 68% of the outcomes will lie between 1 standard deviation from the expected value:
1 0.189 0.14175 0.33075
1 0.189 0.14175 0.04725
s
s
+ = + =
– = – =
(2) 95% of the outcomes will lie between 2 standard deviations from the expected value:
2 0.189 (2 0.14175) 0.4725
2 0.189 (2 0.14175) 0.0945
s
s
+ = + ´ =
– = – ´ =–
(3) 99% of the outcomes will lie between 3 standard deviations from the expected value:
3 0.189 (3 0.14175) 0.61425
3 0.189 (3 0.14175) 0.23625
s
s
+ = + ´ =
– = – ´ =–
c.
© 2015 Pearson Education, Inc.
6 Gitman/Zutter Principles of Managerial Finance, Brief, Seventh Edition
P8-13. Personal finance: Portfolio return and standard deviation
LG 3; Challenge
a. Expected portfolio return for each year: rp (wLrL) (wMrM)
Year
Asset L
(wLrL)
Asset M
(wMrM)
Expected
Portfolio Return
rp
6.0%)
b. Portfolio return:
1
n
j j
j
p
w r
rn
=
´
=
å
17.6 16.4 16.0 15.2 14.0 13.6 15.467 15.5%
6
p
r+++++
= = =
c. Standard deviation:
2
1
( )
( 1)
n
i
rp
i
r r
n
s
=
–
=–
å
© 2015 Pearson Education, Inc.
Chapter 3: Financial Statements and Ratio Analysis 7
2 2 2
222
(17.6% 15.5%) (16.4% 15.5%) (16.0% 15.5%)
(15.2% 15.5%) (14.0% 15.5%) (13.6% 15.5%)
6 1
rp
s
– + – + –
é ù
ê ú
+ – + – + –
ë û
=–
222
2 2 2
(2.1%) (0.9%) (0.5%)
( 0.3%) ( 1.5%) ( 1.9%)
5
rp
s
+ +
é ù
ê ú
+ – + – + –
ë û
=
(.000441 0.000081 0.000025 0.000009 0.000225 0.000361)
5
rp
s+ + + + +
=
0.001142 0.000228% 0.0151 1.51%
5
rp
s= = = =
d. The assets are negatively correlated.
P8-14. Portfolio analysis
LG 3; Challenge
a. Expected portfolio return:
Chapter 3: Financial Statements and Ratio Analysis 9
P8-15. Correlation, risk, and return
LG 4; Intermediate
a. (1) Range of expected return: between 8% and 13%
b. (1) Range of expected return: between 8% and 13%
c. (1) Range of expected return: between 8% and 13%
P8-16. Personal finance: International investment returns
LG 1, 4; Intermediate
a. Returnpesos
24,750 20,500 4,250 0.20732 20.73%
20,500 20,500
–= = =
b.
Price in pesos 20.50
Purchase price $2.22584 1,000 shares $2,225.84
Pesos per dollar 9.21
= = ´ =
Price in pesos 24.75
Sales price $2.51269 1,000 shares $2,512.69
Pesos per dollar 9.85
= = ´ =
c. Returnus$
2,512.69 2,225.84 286.85 0.12887 12.89%
2,225.84 2,225.84
–= = =
d. The two returns differ due to the change in the exchange rate between the peso and the dollar. The peso had
depreciation (and thus the dollar appreciated) between the purchase date and the sale date, causing a decrease in
total return. The answer in part c is the more important of the two returns for Joe. An investor in foreign securities
will carry exchange-rate risk.
P8-17. Total, nondiversifiable, and diversifiable risk
LG 5; Intermediate
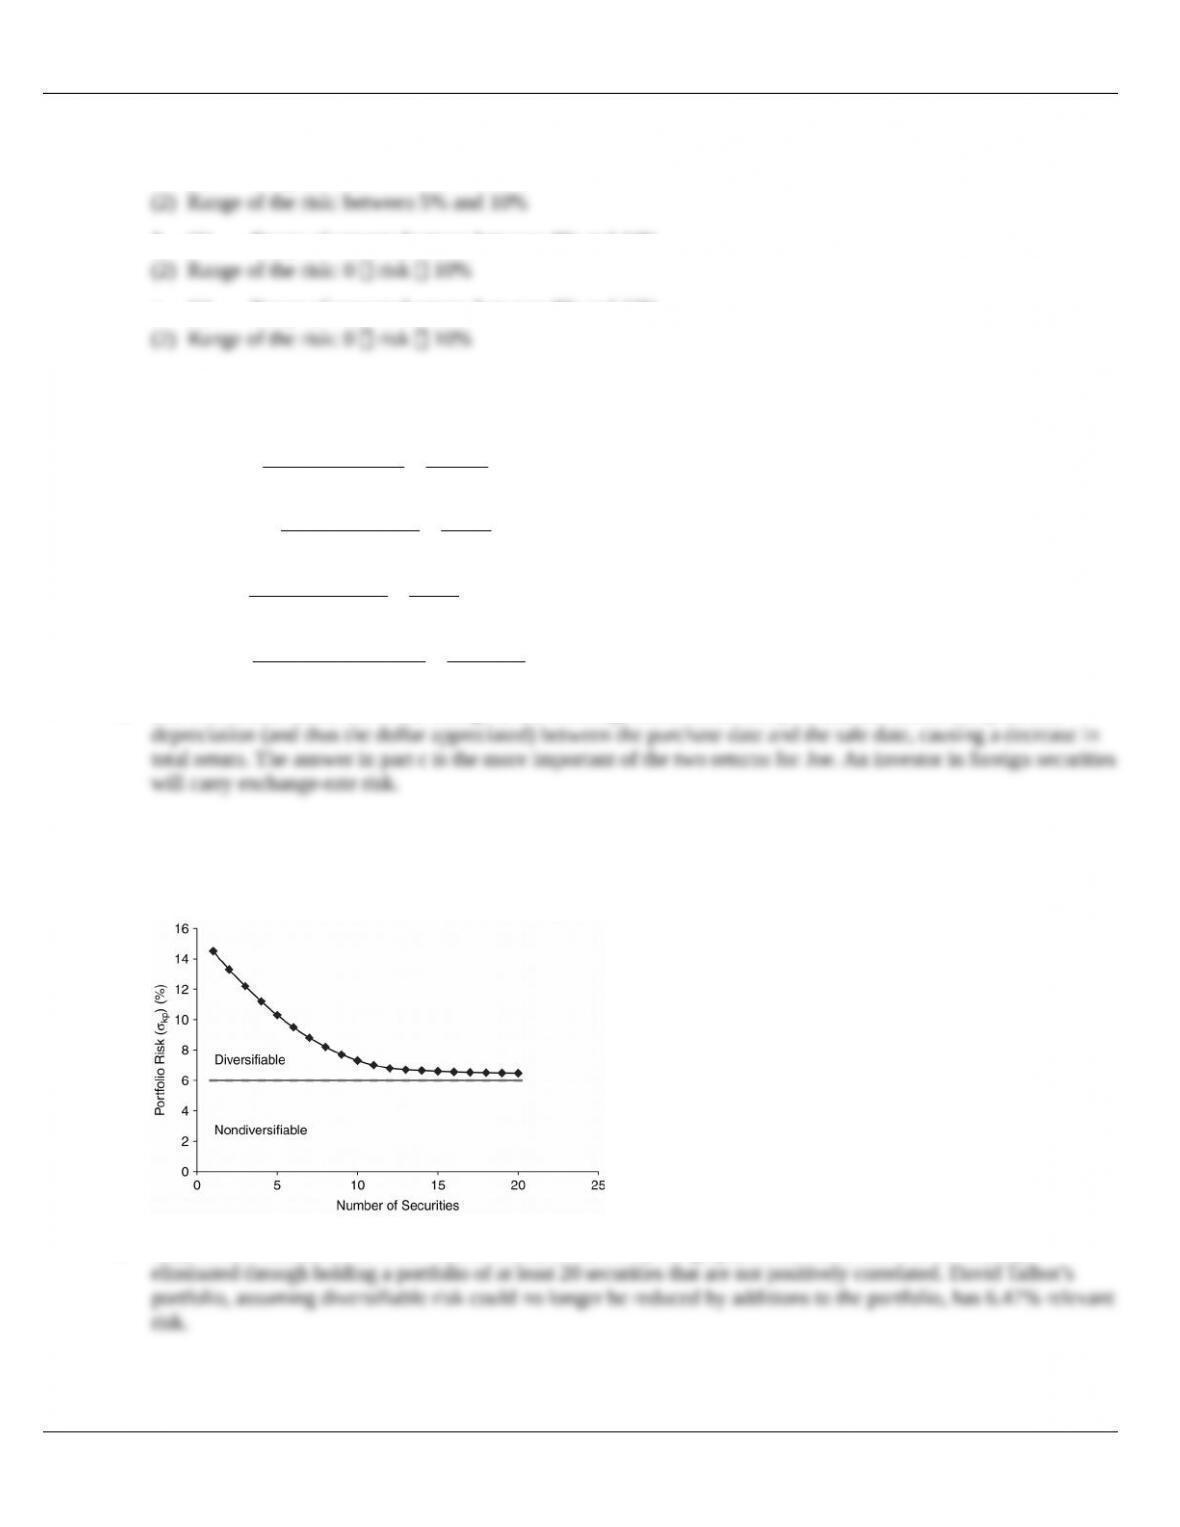
a. and b.
c. Only nondiversifiable risk is relevant because, as shown by the graph, diversifiable risk can be virtually
© 2015 Pearson Education, Inc.
10 Gitman/Zutter Principles of Managerial Finance, Brief, Seventh Edition
P8-18. Graphic derivation of beta
LG 5; Intermediate
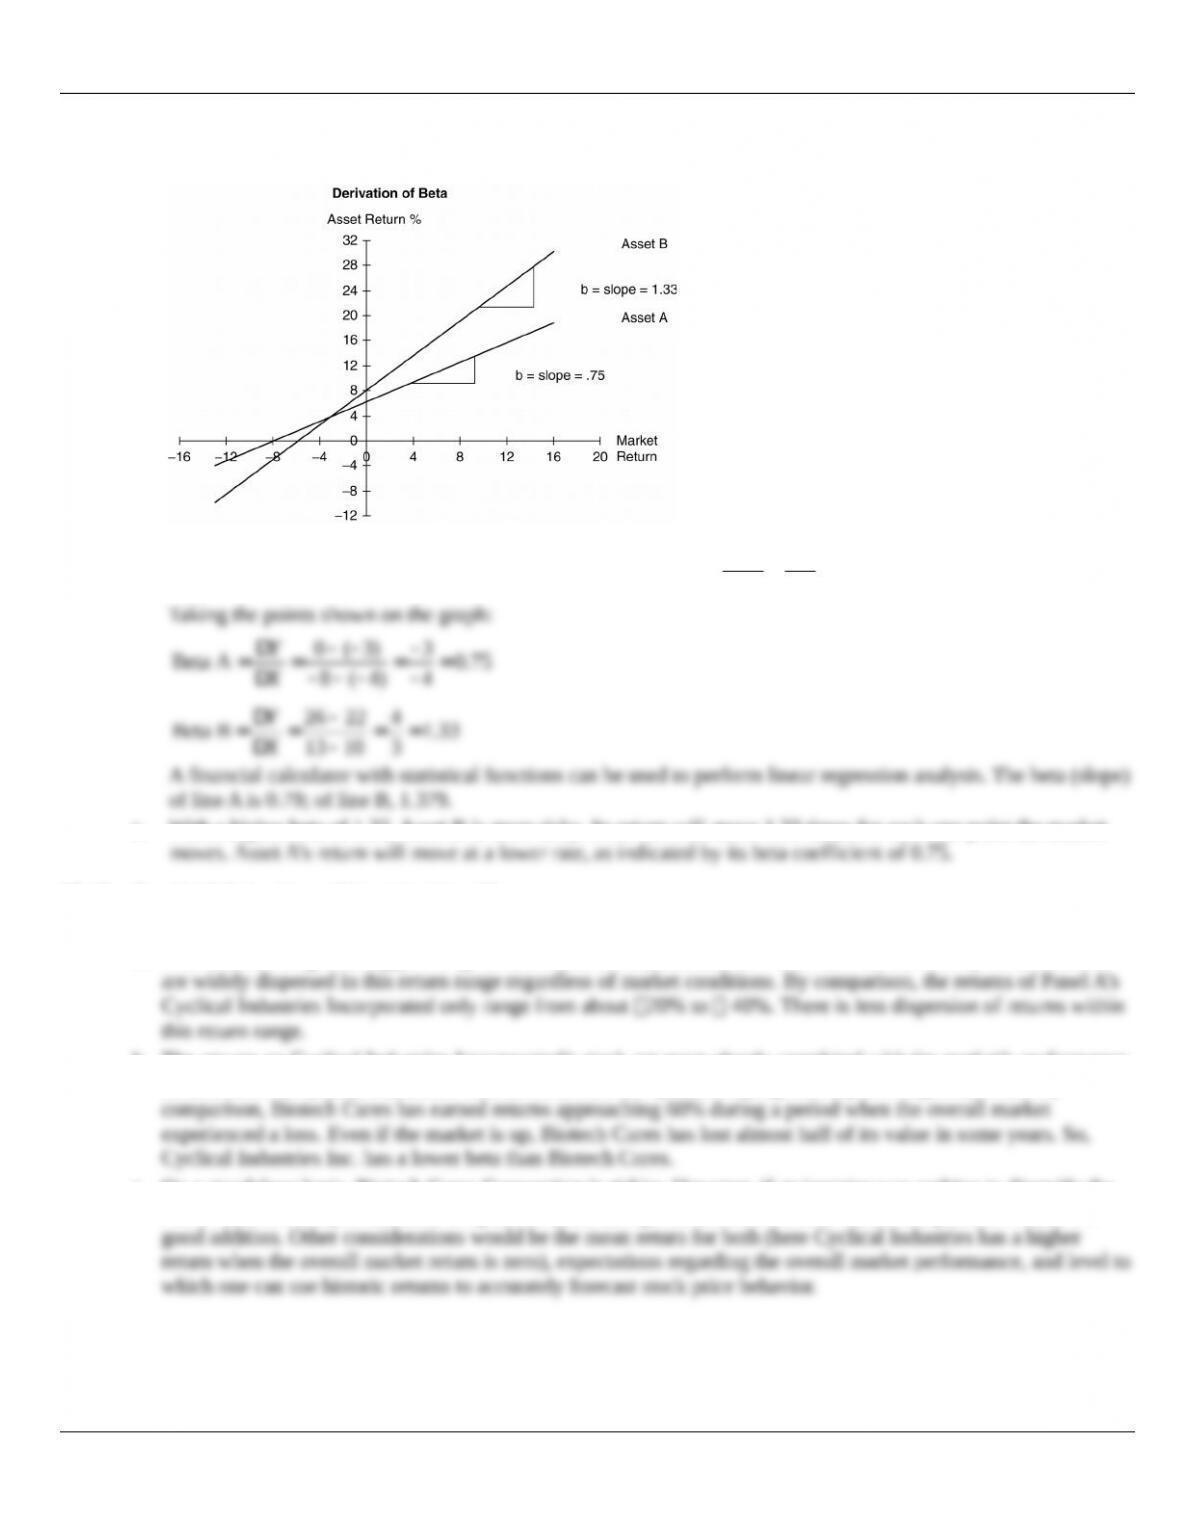
a.
b. To estimate beta, the “rise over run” method can be used:
Rise
Beta Run
Y
X
D
= =D
c. With a higher beta of 1.33, Asset B is more risky. Its return will move 1.33 times for each one point the market
P8-19. Graphical derivation and interpretation of beta
LG 5; Intermediate
a. With a return range from 0% to 30%, Biotech Cures, exhibited in Panel B, is the more risky stock. Returns
b. The returns on Cyclical Industries Incorporated’s stock are more closely correlated with the market’s performance.
Hence, most of Cyclical Industries’ returns fit around the upward-sloping least-squares regression line. By
c. On a standalone basis, Biotech Cures Corporation is riskier. However, if an investor was seeking to diversify the
risk of their current portfolio, the unique, nonsystematic performance of Biotech Cures Corporation makes it a
© 2015 Pearson Education, Inc.