
Part 4
Risk and the Required Rate of Return
Chapters in This Part
Chapter 8 Risk and Return
Chapter 9 The Cost of Capital
Chapter 8
Risk and Return
Instructor’s Resources
Overview
This chapter focuses on the fundamentals of the risk and return relationship of assets and their valuation. For the
single asset held in isolation, risk is measured with the probability distribution and its associated statistics: the
mean, the standard deviation, and the coefficient of variation. The concept of diversification is examined by
measuring the risk of a portfolio of assets that are perfectly positively correlated, perfectly negatively correlated,
and those that are uncorrelated. Next, the chapter looks at international diversification and its effect on risk. The
Capital Asset Pricing Model (CAPM) is then presented as a valuation tool for securities and as a general
explanation of the risk-return tradeoff involved in all types of financial transactions. Chapter 8 highlights the
importance of understanding the relationship of risk and return when making professional and personal decisions.
Answers to Review Questions
1.Risk is defined as the chance of financial loss, as measured by the variability of expected returns associated with
2.The return on an investment (total gain or loss) is the change in value plus any cash distributions over a defined
2 Gitman/Zutter Principles of Managerial Finance, Brief, Seventh Edition
3. a. The risk-averse financial manager requires an increase in return for a given increase in risk.
Most financial managers are risk averse.
4.Scenario analysis evaluates asset risk by using more than one possible set of returns to obtain a sense of the
5.The decision maker can get an estimate of project risk by viewing a plot of the probability distribution, which
6.The standard deviation of a distribution of asset returns is an absolute measure of dispersion of risk around the
mean or expected value. A higher standard deviation indicates a greater project risk.
7.The coefficient of variation is another indicator of asset risk; however, this measures relative dispersion. It is
calculated by dividing the standard deviation by the expected value. The coefficient of variation indicates
8.An efficient portfolio is one that maximizes return for a given risk level or minimizes risk for a given level of
Chapter 3: Financial Statements and Ratio Analysis 3
Diversification of risk in the asset selection process allows the investor to reduce overall risk by combining
10. The inclusion of foreign assets in a domestic company’s portfolio reduces risk for two reasons. When returns
from foreign-currency-denominated assets are translated into dollars, the correlation of returns of the
When the dollar appreciates relative to other currencies, the dollar value of a foreign-currency-denominated
Political risks result from possible actions by the host government that are harmful to foreign investors or possible
11.The total risk of a security is the combination of nondiversifiable risk and diversifiable risk. Diversifiable risk
refers to the portion of an asset’s risk attributable to firm-specific, random events (strikes, litigation, loss of
12. Beta measures nondiversifiable risk. It is an index of the degree of movement of an asset’s return in response
to a change in the market return. The beta coefficient for an asset can be found by plotting the asset’s
13. The equation for the capital asset pricing model is:
rj RF [bj(rm RF)],
where:
rj the required (or expected) return on asset j
The security market line (SML) is a graphical presentation of the relationship between the amount of systematic
14. a. If there is an increase in inflationary expectations, the security market line will show a parallel shift
b. The slope of the SML (the beta coefficient) will be less steep if investors become less risk averse, and
© 2015 Pearson Education, Inc.
4 Gitman/Zutter Principles of Managerial Finance, Brief, Seventh Edition
Suggested Answer to Focus on Ethics Box:
If It Sounds Too Good to Be True, It Probably Is
What are some hazards of allowing investors to pursue claims based on their most recent accounts
statements?
Allowing claims based on fraudulent statements reduces investors’ incentive to perform due diligence. If investors
Answers to Warm-Up Exercises
E8-1. Total annual return
Answer: ($0 $12,000,000 $10,000,000) $10,000,000 $2,000,000 $10,000,000 20%
Logistics, Inc., doubled the annual rate of return predicted by the analyst. The negative net
income is irrelevant to the problem.
E8-2. Expected return
Answer:
Analyst Probability Return Weighted Value
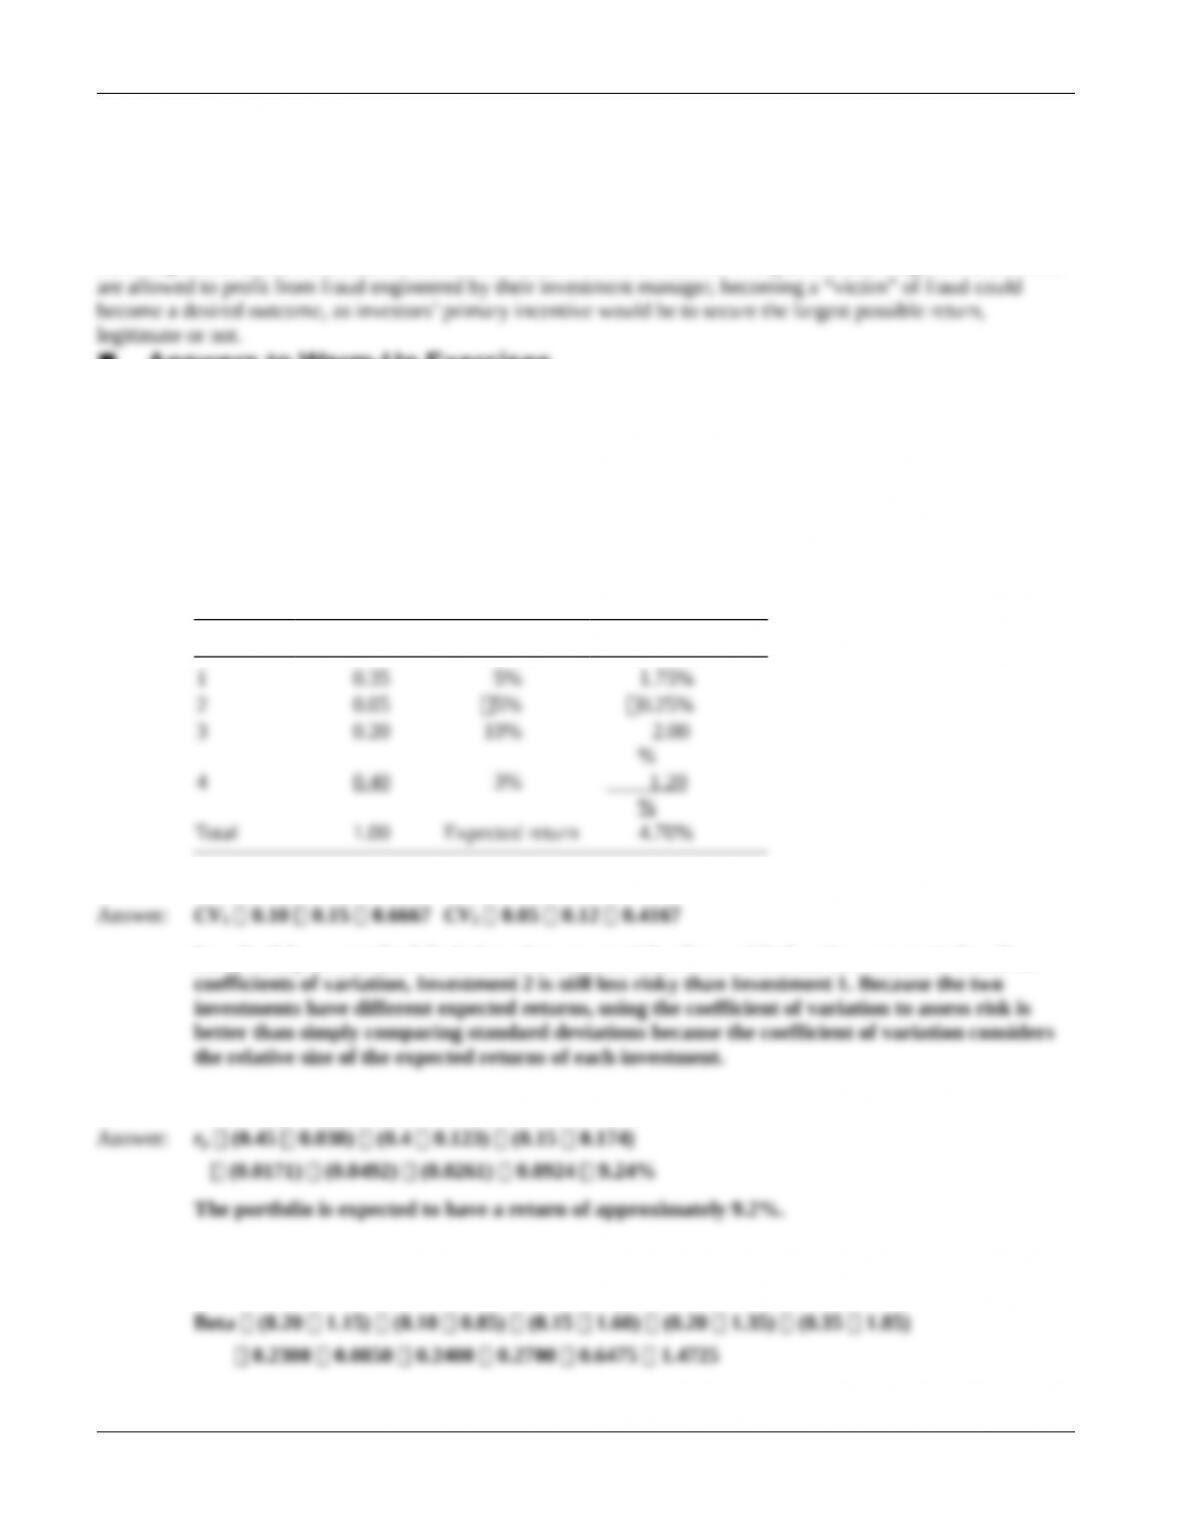
E8-3. Comparing the risk of two investments
Based solely on standard deviations, Investment 2 has lower risk than Investment 1. Based on
E8-4. Computing the expected return of a portfolio
E8-5. Calculating a portfolio beta
Answer:
© 2015 Pearson Education, Inc.
Chapter 3: Financial Statements and Ratio Analysis 5
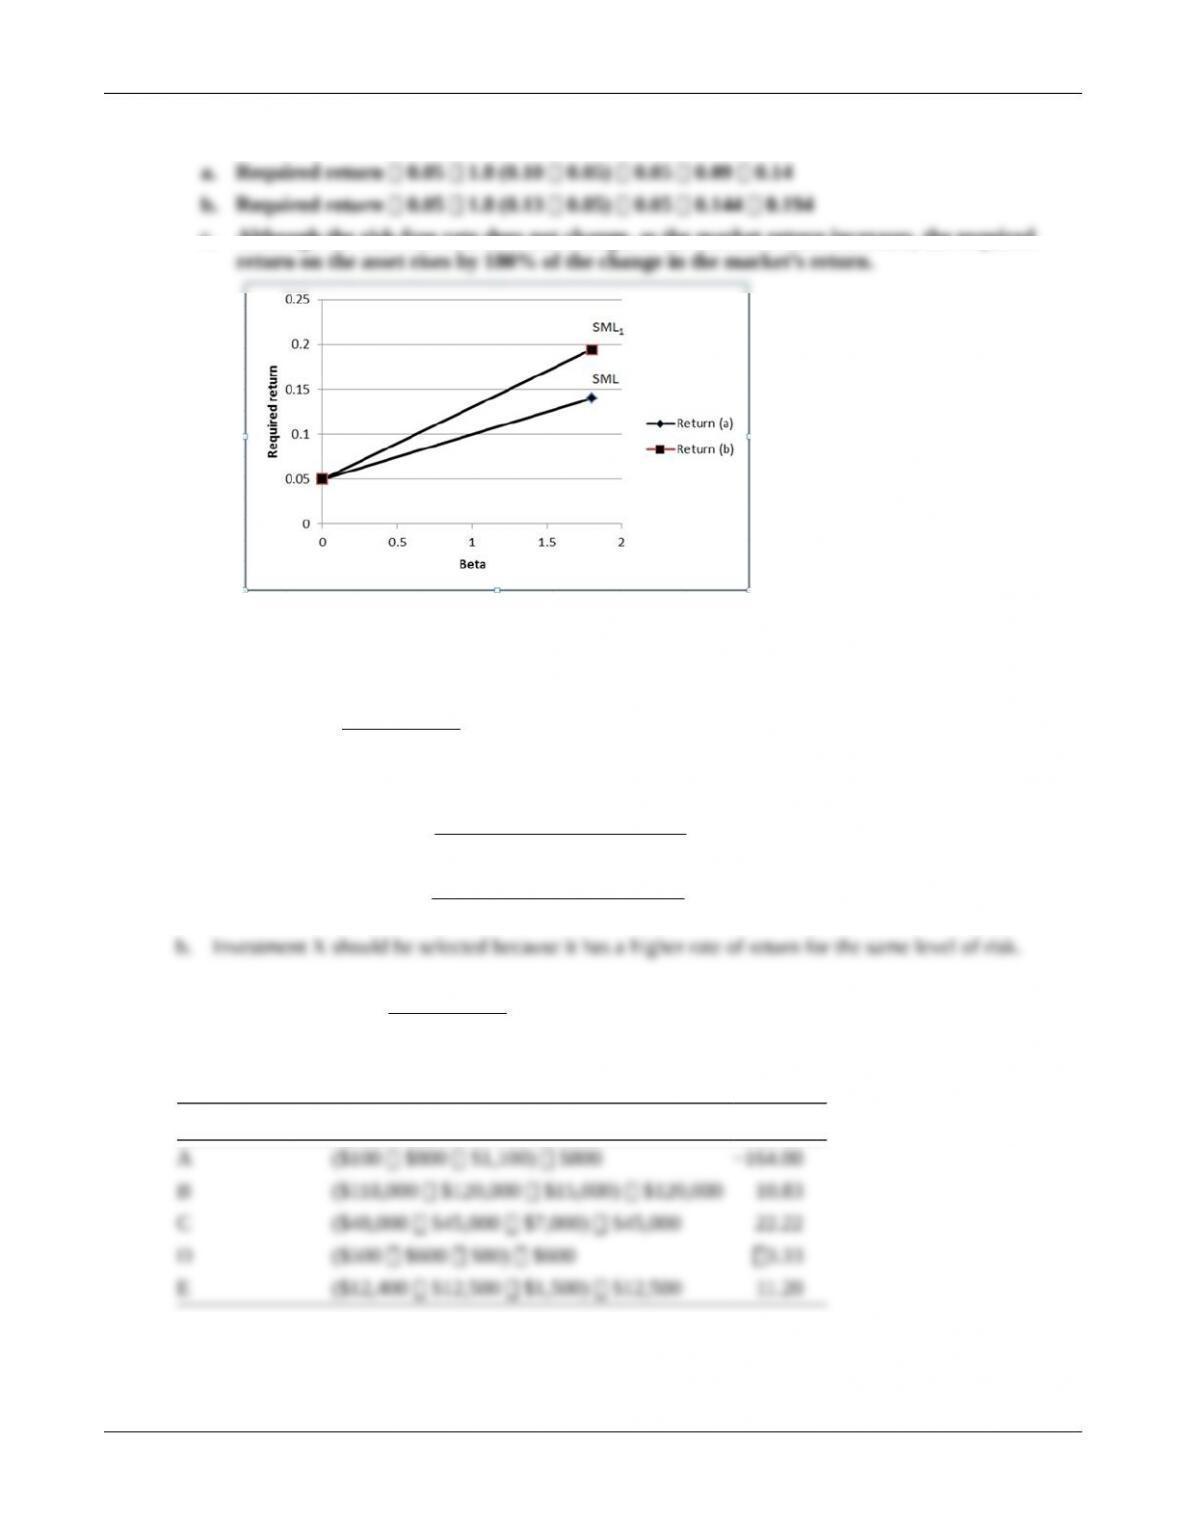
E8-6. Calculating the required rate of return
Answer:
c. Although the risk-free rate does not change, as the market return increases, the required
Solutions to Problems
P8-1. Rate of return:
1
1
( )
t
t t t
t
P P C
r = P–
––+
LG 1; Basic
a. Investment X: Return
($21,000 $20,000 $1,500) 12.50%
$20,000
– +
= =
Investment Y: Return
($55,000 $55,000 $6,800) 12.36%
$55,000
– +
= =
b. Investment X should be selected because it has a higher rate of return for the same level of risk.
P8-2. Return calculations:
1
1
( )
t
t t t
t
P P C
r = P–
––+
LG 1; Basic
Investment Calculation rt(%)
© 2015 Pearson Education, Inc.
6 Gitman/Zutter Principles of Managerial Finance, Brief, Seventh Edition
P8-3. Risk preferences
LG 1; Intermediate
a. The risk-neutral manager would accept Investments X and Y because these have higher returns than
b. The risk-averse manager would accept Investment X because it provides the highest return and has the
c. The risk-seeking manager would accept Investments Y and Z because he or she is willing to take
d. Traditionally, financial managers are risk averse and would choose Investment Xbecause it provides
P8-4. Risk analysis
LG 2; Intermediate
a.
Expansion Range
d. The answer is no longer clear because it now involves a risk-return tradeoff. Project B has a slightly
P8-5. Risk and probability
LG 2; Intermediate
a.
Camera Range
b.
Possible
Outcomes
Probability
Pri
Expected Return
ri
Weighted
Value (%)(ri
Pri)
Camera S Pessimistic 0.20 15 3.00%
© 2015 Pearson Education, Inc.
Chapter 3: Financial Statements and Ratio Analysis 7
1.00 Expected return 25.50%
c. Camera S is considered more risky than Camera R because it has a much broader range of outcomes.
P8-6. Bar charts and risk
LG 2; Intermediate
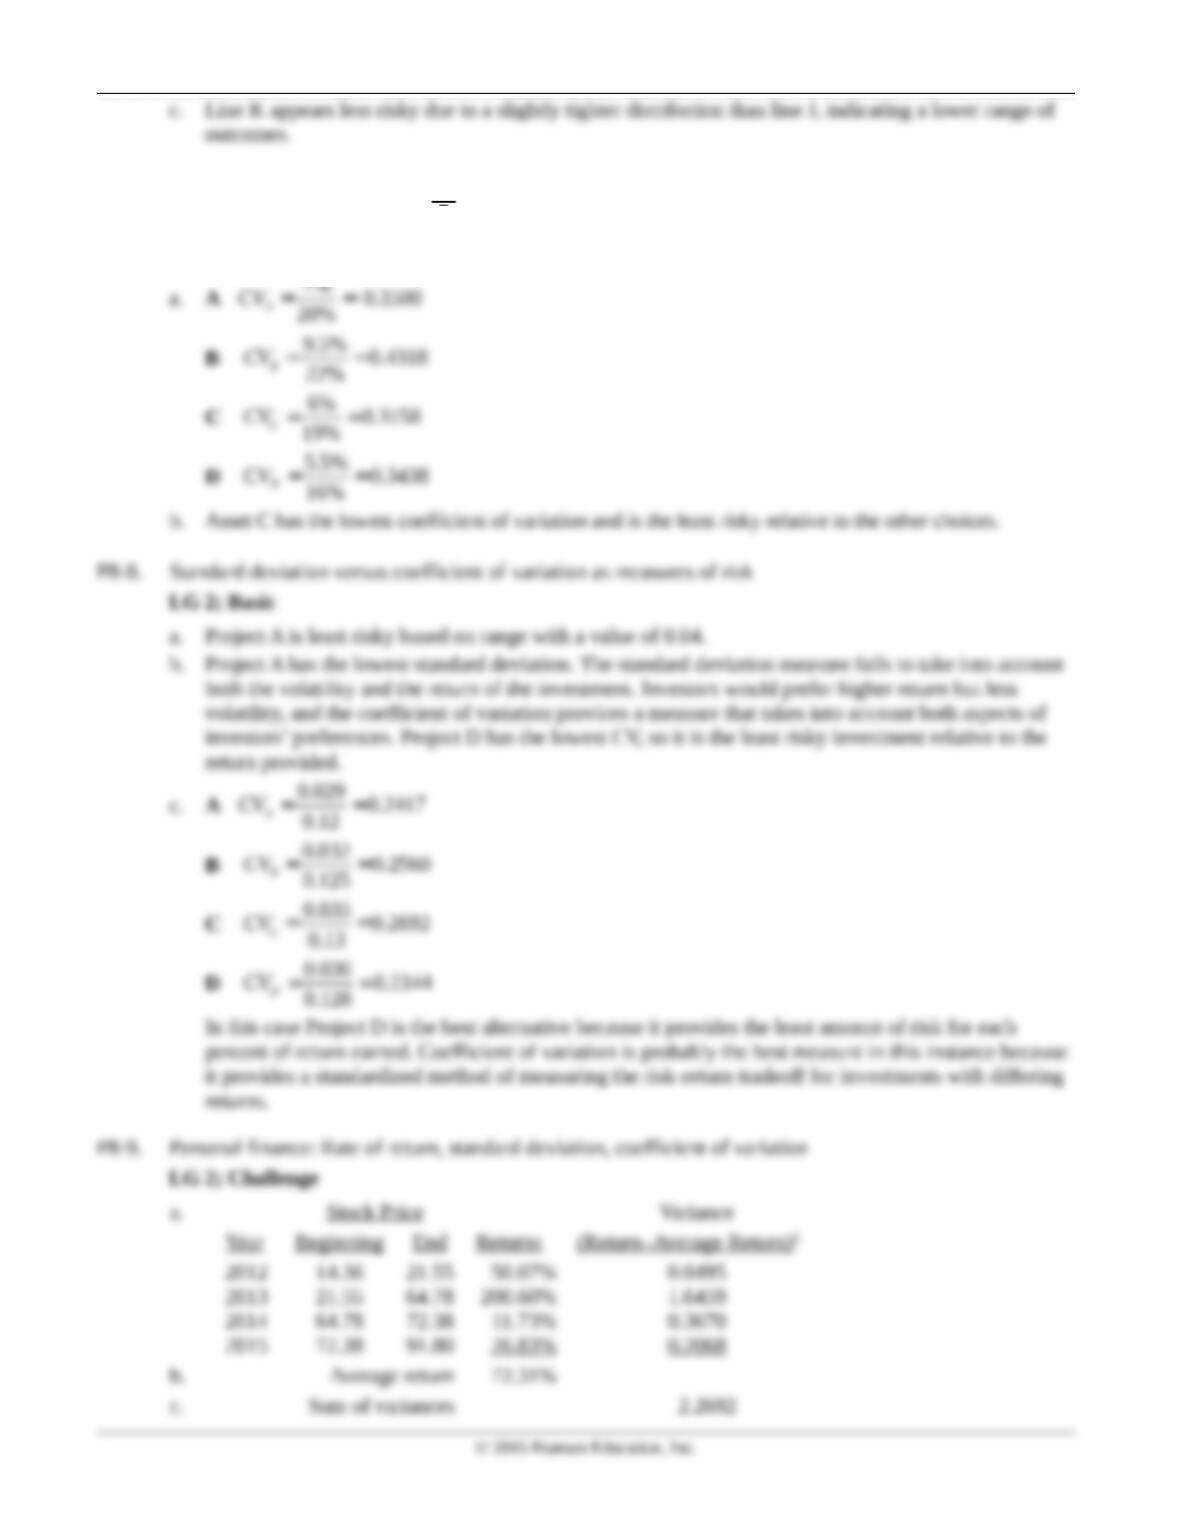
a.
b.
Market
Acceptance
Probability
Pri
Expected Return
ri
Weighted Value
(ri Pri)
Line J Very Poor 0.05 0.0075 0.000375
Line K Very Poor 0.05 0.010 0.000500
© 2015 Pearson Education, Inc.
8 Gitman/Zutter Principles of Managerial Finance, Brief, Seventh Edition
P8-7. Coefficient of variation:
r
CV r
s
=
LG 2; Basic
7% 0.3500
Chapter 3: Financial Statements and Ratio Analysis 9
d. 1.20 Coefficient of variation
e. The stock price of Hi-Tech, Inc. has definitely gone through some major price changes
over this time period. It would have to be classified as a volatile security having an
upward price trend over the past 4 years. Note how comparing securities on a CV basis
P8-10. Assessing return and risk
© 2015 Pearson Education, Inc.