
P3-21. The relationship between financial leverage and profitability
LG 4, 5; Challenge
a. (1)
total liabilities
Debt ratio total assets
=
Pelican
Timberland
$1,000,000
Debt ratio 0.10 10%
$10,000,000
$5,000,000
Debt ratio 0.50 50%
$10,000,000
= = =
= = =
(2)
earning before interest and taxes
Times interest earned interest
=
Pelican
Timberland
$6,250,000
Times interest earned 62.5
$100,000
$6,250,000
Times interest earned 12.5
$500,000
= =
= =
Timberland has a much higher degree of financial leverage than does Pelican. As a result, Timberland’s
earnings will be more volatile, causing the common stock owners to face greater risk. This additional risk
is supported by the significantly lower times interest earned ratio of Timberland. Pelican can face a very
large reduction in net income and still be able to cover its interest expense.
b. (1)
operating profit
Operating profit margin sales
=
Pelican
Timberland
$6,250,000
Operating profit margin 0.25 25%
$25,000,000
$6,250,000
Operating profit margin 0.25 25%
$25,000,000
= = =
= = =
(2)
Earnings available for common stockholders
Net profit margin sales
=
Pelican
Timberland
$3,690,000
Net profit margin 0.1476 14.76%
$25,000,000
$3,450,000
Net profit margin 0.138 13.80%
$25,000,000
= = =
= = =
(3)
Earnings available for common stockholders
Return on total assets total assets
=
Pelican
Timberland
$3,690,000
Return on total assets 0.369 36.9%
$10,000,000
$3,450,000
Return on total assets 0.345 34.5%
$10,000,000
= = =
= = =
2 Gitman/Zutter Principles of Managerial Finance, Brief, Seventh Edition
(4)
Earnings available for common stockholders
Return on common equity Common stock equity
=
Pelican
Timberland
$3,690,000
Return on common equity 0.41 41.0%
$9,000,000
$3,450,000
Return on common equity 0.69 69.0%
$5,000,000
= = =
= = =
Pelican is more profitable than Timberland, as shown by the higher operating profit margin, net profit
c. Even though Pelican is more profitable, Timberland has a higher ROE than Pelican due to the
additional financial leverage risk. The lower profits of Timberland are due to the fact that interest
P3-22. Ratio proficiency
LG 6; Basic
a.
Gross profit sales gross profit margin
Gross profit $40,000,000 0.8 $32,000,000
= ´
= ´ =
b.
Cost of goods sold sales gross profit
Cost of goods sold $40,000,000 $32,000,000 $8,000,000
= –
= – =
c.
Operating profit sales operating profit margin
Operating profit $40,000,000 0.35 $14,000,000
= ´
= ´ =
d.
Operating expenses gross profit operating profit
Operating expenses $32,000,000 $14,000,000 $18,000,000
= –
= – =
e.
Earnings available for common shareholders
sales net profit margin $40,000,000 0.08 $3,200,000= ´ = ´ =
f.
sales $40,000,000
Total assets $20,000,000
total asset turnover 2
= = =
g.
earnings available for common shareholders
Total common equity
ROE
$3,200,000
Total common equity $16,000,000
0.20
=
= =
h.
sales
Accounts receivable average collection period
365
$40,000,000
Accounts receivable 62.2 days 62.2 $109,589.041 $6,816,438.36
365
= ´
= ´ = ´ =
Chapter 3: Financial Statements and Ratio Analysis 3
P3-23. Cross-sectional ratio analysis
LG 6; Intermediate
a.
Fox Manufacturing Company
Ratio Analysis
Industry Average
2015
Actual
2015
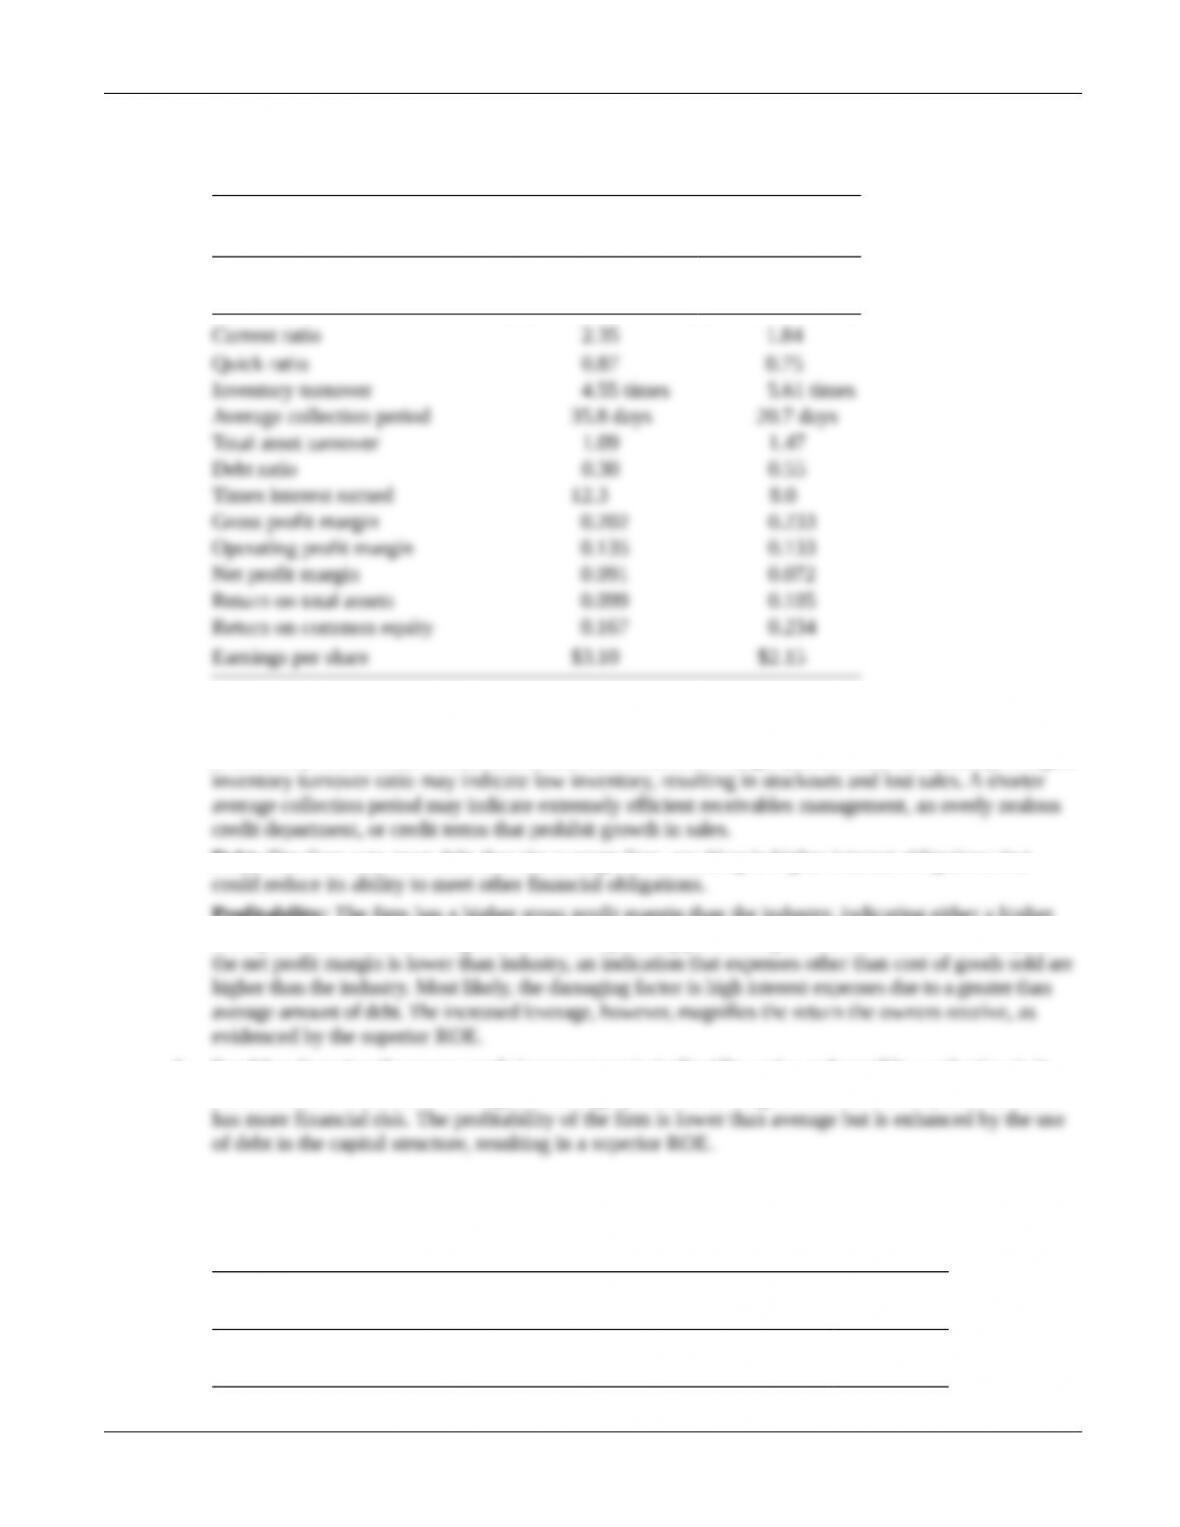
Liquidity: The current and quick ratios show a weaker position relative to the industry average.
Activity: All activity ratios indicate a faster turnover of assets compared to the industry. Further analysis
is necessary to determine whether the firm is in a weaker or stronger position than the industry. A higher
Debt: The firm uses more debt than the average firm, resulting in higher interest obligations that
Profitability: The firm has a higher gross profit margin than the industry, indicating either a higher
sales price or a lower cost of goods sold. The operating profit margin is in line with the industry, but
b. Fox Manufacturing Company needs improvement in its liquidity ratios and possibly a reduction in its
total liabilities. The firm is leveraged more highly than the average firm in its industry and therefore
P3-24. Financial statement analysis
LG 6; Intermediate
a.
Zach Industries
Ratio Analysis
Industry
Average
Actual
2014
Actual
2015
Current ratio 1.80 1.84 1.04
© 2015 Pearson Education, Inc.
4 Gitman/Zutter Principles of Managerial Finance, Brief, Seventh Edition
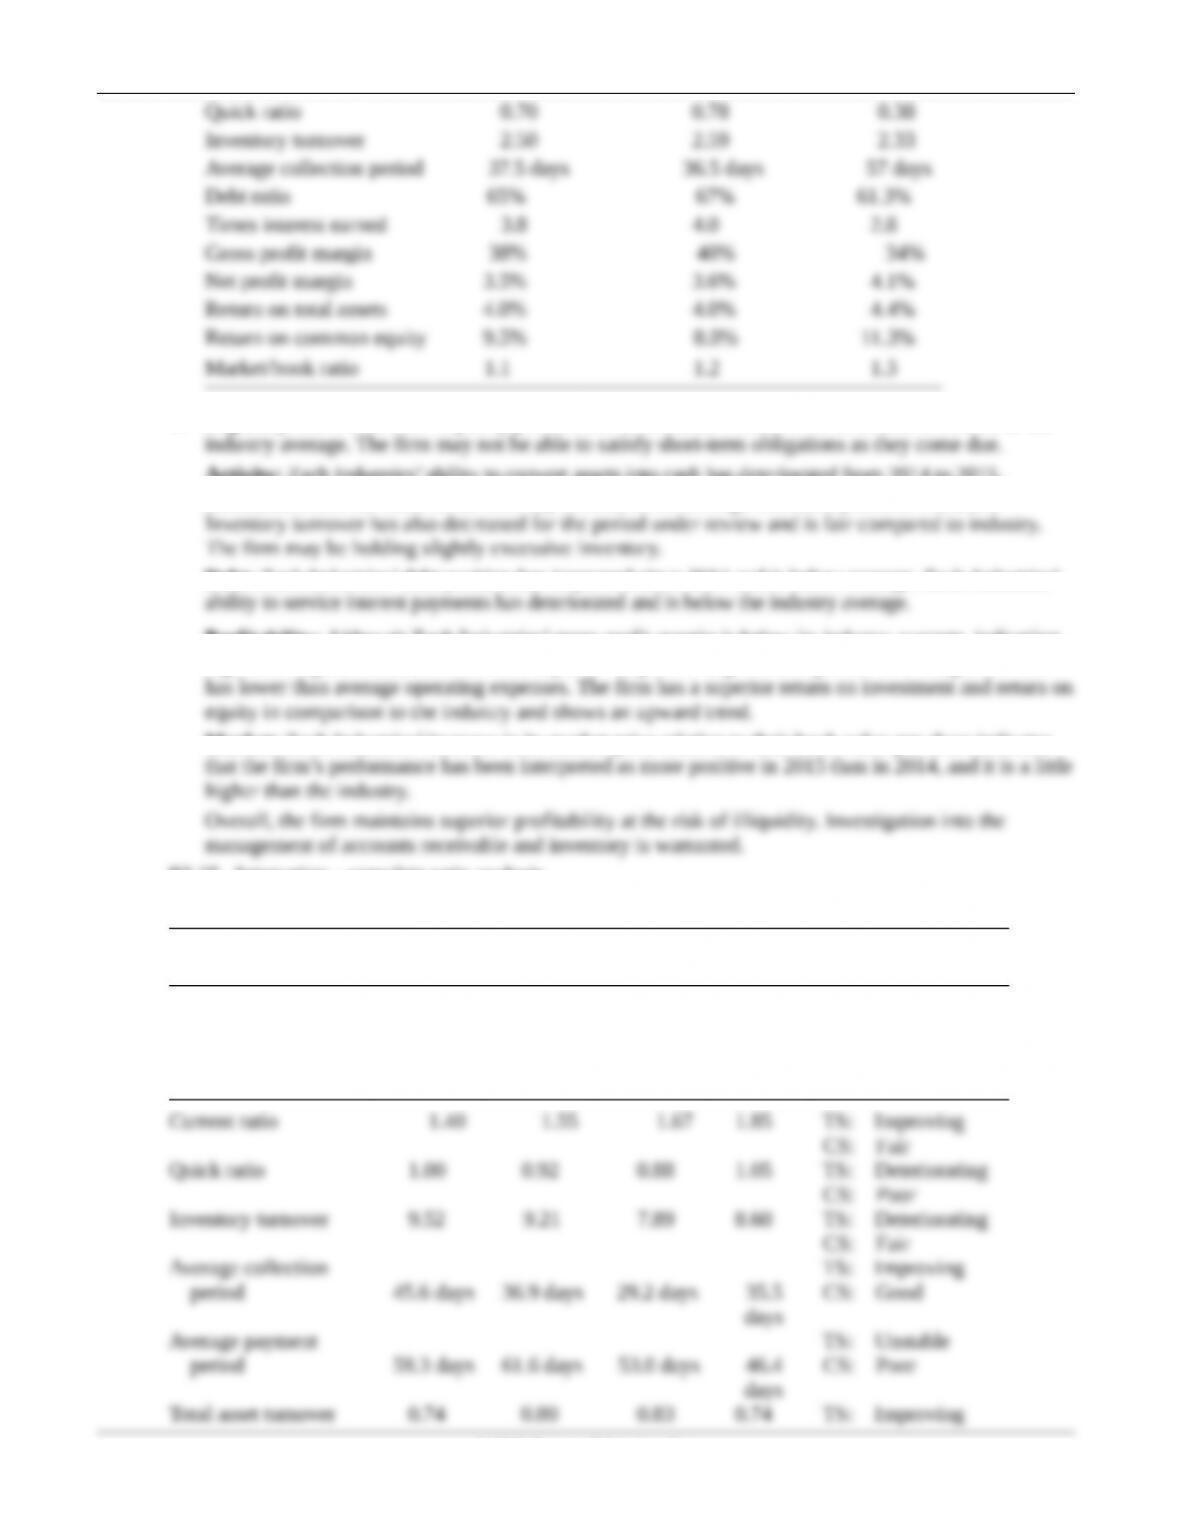
b. Liquidity: Zach Industries’ liquidity position has deteriorated from 2014 to 2015 and is inferior to the
Activity: Zach Industries’ ability to convert assets into cash has deteriorated from 2014 to 2015.
Examination into the cause of the 20.5-day increase in the average collection period is warranted.
Debt: Zach Industries’ debt position has improved since 2014 and is below average. Zach Industries’
Profitability: Although Zach Industries’ gross profit margin is below its industry average, indicating
high cost of goods sold, the firm has a superior net profit margin in comparison to average. The firm
Market: Zach Industries’ increase in its market price relative to their book value per share indicates
P3-25. Integrative—complete ratio analysis
LG 6; Challenge
Sterling Company
Ratio Analysis
Actual Actual Actual
Industry
Average TS: Time-Series
Ratio 2013 2014 2015 2015 CS: Cross-Section
al
© 2015 Pearson Education, Inc.
Chapter 3: Financial Statements and Ratio Analysis 5
CS: Good
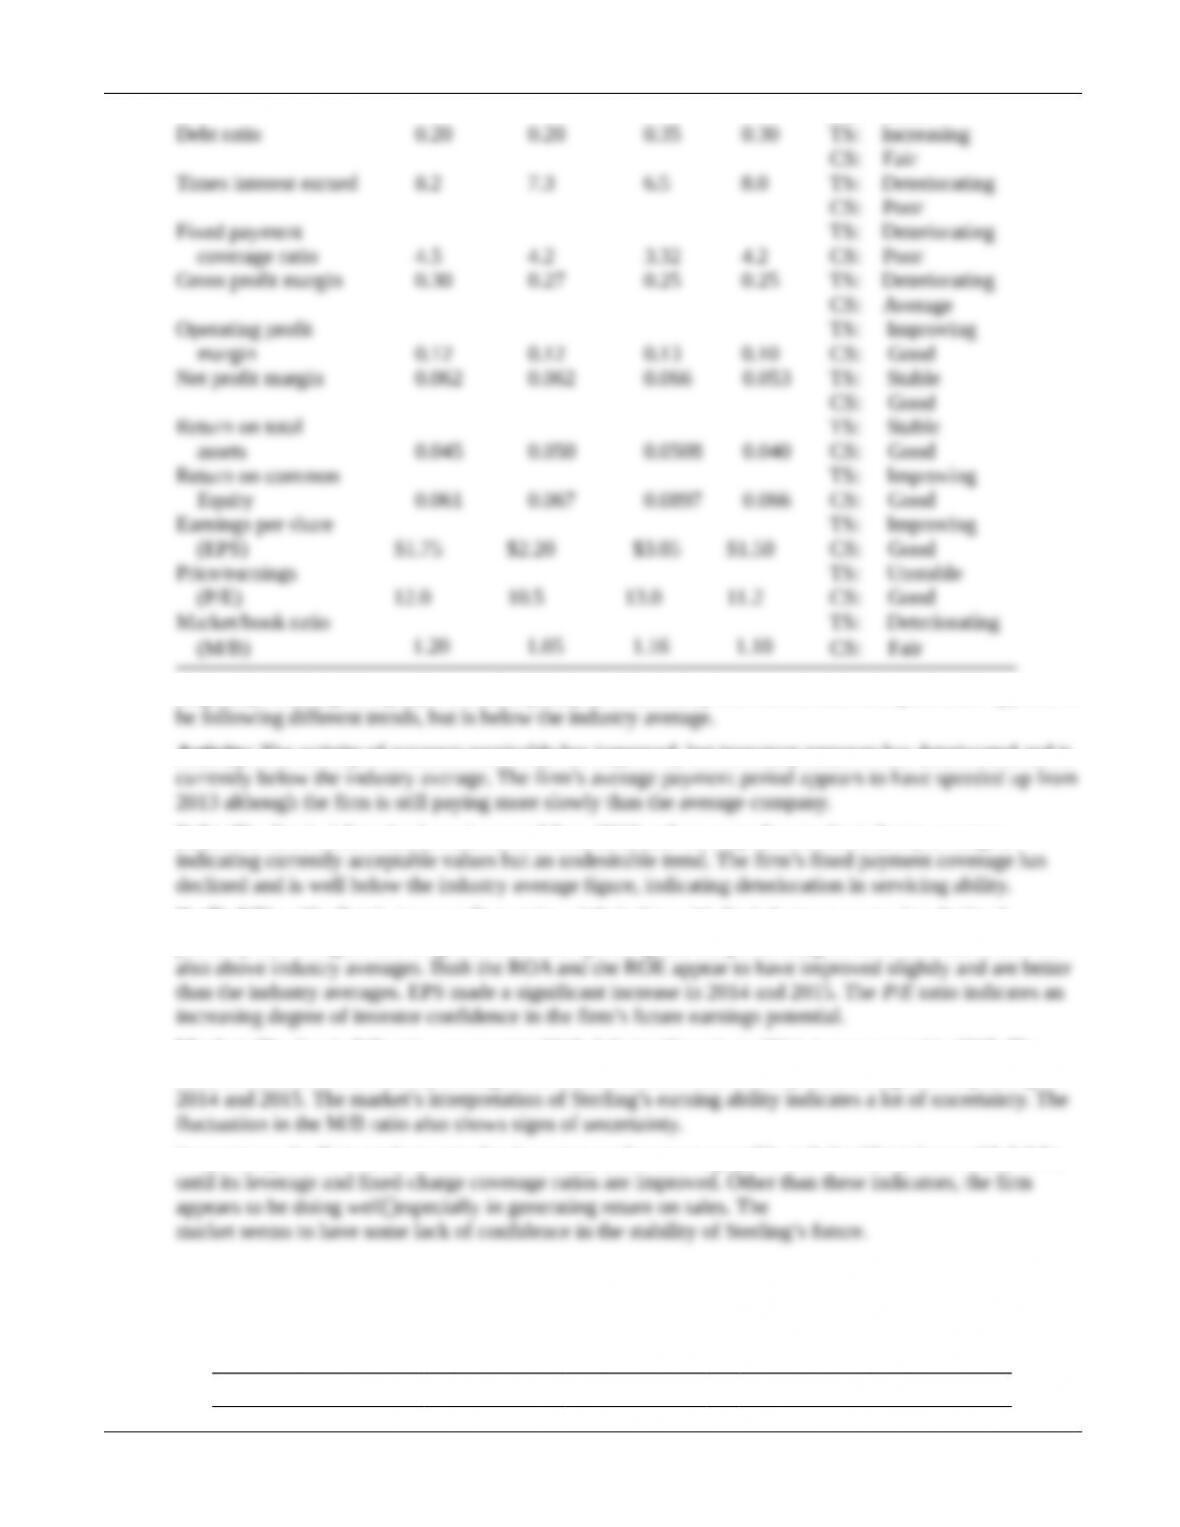
Liquidity: Sterling Company’s overall liquidity as reflected by the current ratio and quick ratio appears to
Activity: The activity of accounts receivable has improved, but inventory turnover has deteriorated and is
Debt: The firm’s debt ratios have increased from 2013 and are very close to the industry averages,
Profitability: The firm’s gross profit margin, while in line with the industry average, has declined,
probably due to higher cost of goods sold. The operating and net profit margins have been stable and are
Market: The firm’s P/E ratio was good in 2013, fell significantly in 2014, but recovered in 2015. The
ratio is now above the industry average. The market to book ratio initially showed signs of improving in
In summary, the firm needs to attend to inventory and accounts payable and should not incur added debts
P3-26. DuPont system of analysis
LG 6; Intermediate
a.
Margin(%) Turnover ROA(%) FL ROE(%)
© 2015 Pearson Education, Inc.
6 Gitman/Zutter Principles of Managerial Finance, Brief, Seventh Edition
Multiple
2015
less.
Leverage: Only Johnson shows an increase in leverage from 2014 to 2015, while the industry has had
P3-27. Complete ratio analysis, recognizing significant differences
LG 6; Intermediate
a.
Home Health, Inc.
Ratio 2014 2015 Difference
Proportional
Difference
© 2015 Pearson Education, Inc.
Chapter 3: Financial Statements and Ratio Analysis 7
b.
Ratio
Proportional
Difference Company’s Favor
c. The most obvious relationship is associated with the increase in the ROE value. The increase in this
ratio is connected with the increase in the ROA. The higher ROA is partially attributed to the higher
P3-28. Ethics problem
LG 1; Intermediate
Answers will vary by article chosen, but in general students will report that financial statements are more
Case
Case studies are available on www.myfinancelab.com.
Assessing Martin Manufacturing’s Current Financial Position
Martin Manufacturing Company is an integrative case study addressing financial analysis techniques.
a. Ratio calculations
Financial Ratio 2012
© 2015 Pearson Education, Inc.
8 Gitman/Zutter Principles of Managerial Finance, Brief, Seventh Edition
Historical Ratios
Martin Manufacturing Company
Ratio
Actual
2010
Actual
2011
Actual
2012
Industry
Average
b. Liquidity: The firm has sufficient current assets to cover current liabilities. The trend is upward and is much
Activity: The inventory turnover is stable but much lower than the industry average. This indicates the firm is
holding too much inventory. The average collection period is increasing and much higher than the industry
Debt: The debt ratio has increased and is substantially higher than the industry average. This places the
company at high risk. Typically industries with heavy capital investment and higher operating risk try to
Profitability: The gross profit margin is stable and quite favorable when compared to the industry average.
The net profit margin, however, is deteriorating and far below the industry average. When the gross profit
Market: The market price of the firm’s common stock shows weakness relative to both earnings and book
c. Martin Manufacturing clearly has a problem with its inventory level, and sales are not at an appropriate level for
Spreadsheet Exercise
© 2015 Pearson Education, Inc.
Chapter 3: Financial Statements and Ratio Analysis 9
Group Exercise
Group exercises are available on www.myfinancelab.com.
This chapter’s group focuses solely on the group’s shadow firm. Groups are asked to investigate and describe their
firm’s latest 10-K obtained from the Securities and Exchange website (www.sec.gov). From the filing the groups
are asked to calculate the basic ratios as done in the text and discuss each ratio’s importance. This leads to a
Modifications could include dropping the intertemporal analysis and focusing solely on the most recent year.
© 2015 Pearson Education, Inc.