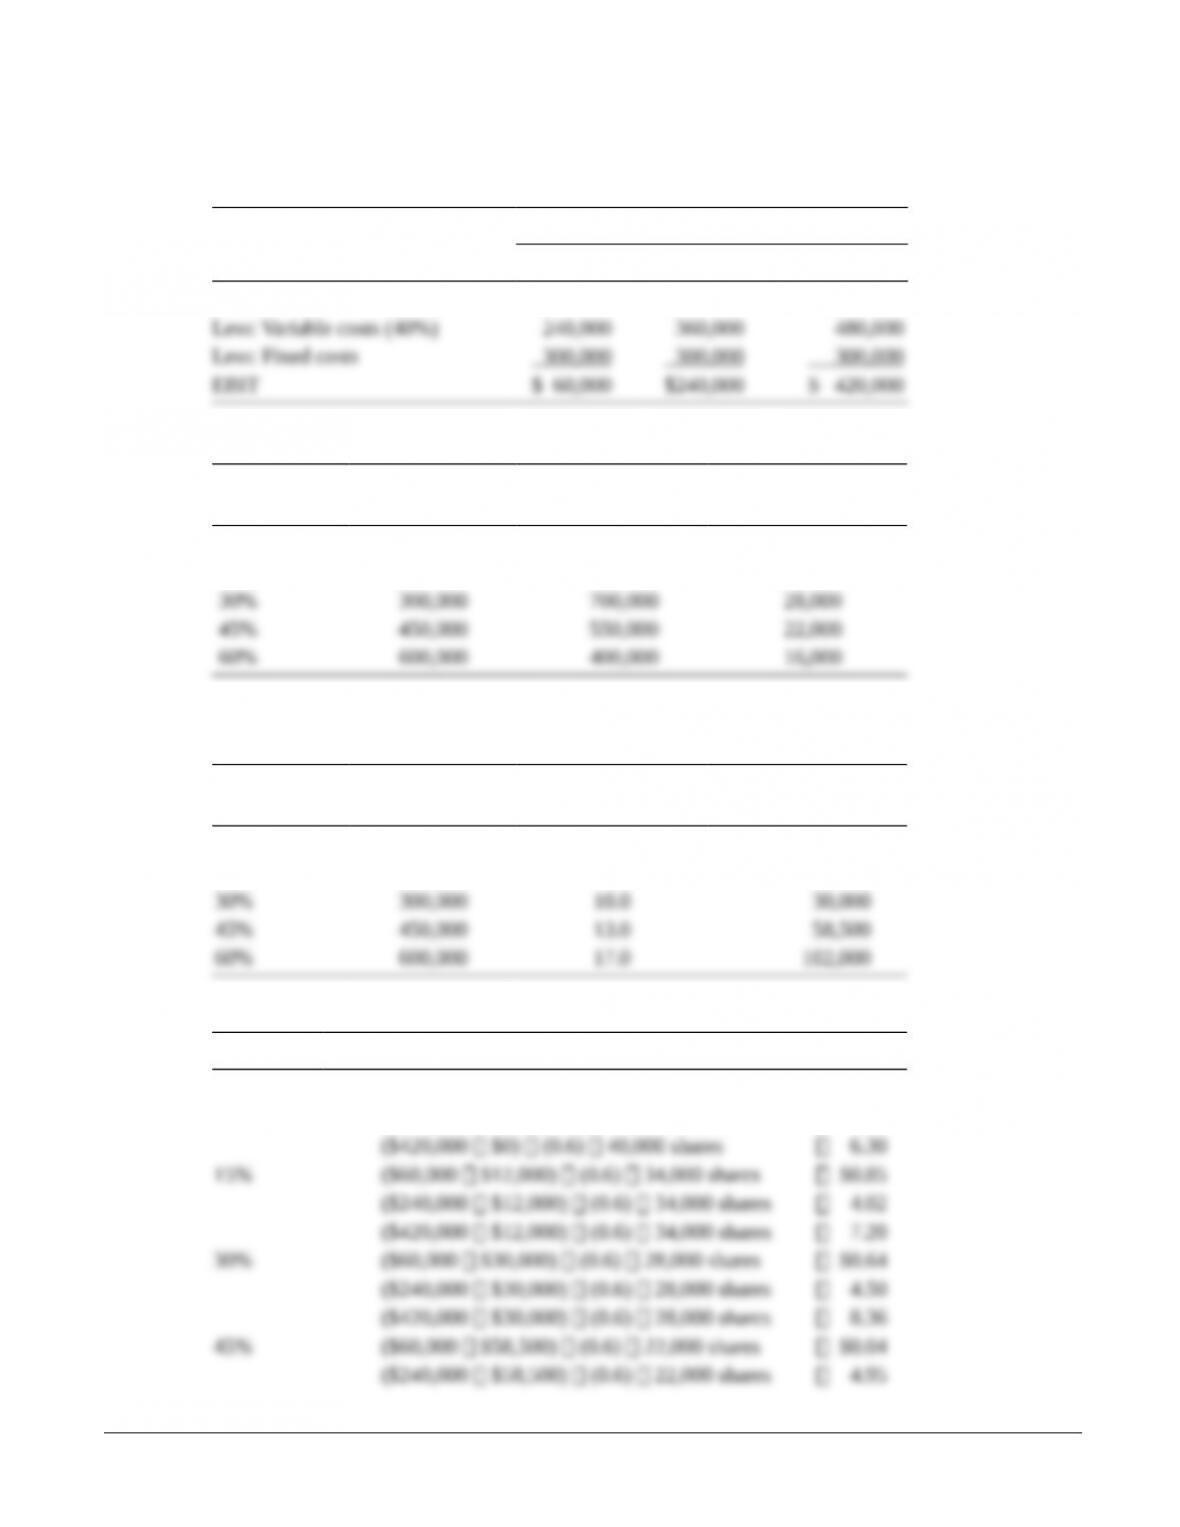
P12-27. Integrative—optimal capital structure
LG 3, 4, 5, 6; Challenge
a.
Probability
0.30 0.40 0.30
Sales $600,000 $900,000 $1,200,000
b.
Debt Ratio
Amount
of Debt
Amount
of Equity
Number of Shares of
Common Stock*
0% $ 0 $1,000,000 40,000
15% 150,000 850,000 34,000
* Dollar amount of equity $25 per share Number of shares of common stock.
c.
Debt Ratio
Amount
of Debt
Before Tax
Cost of Debt Annual Interest
0% $ 0 0.0% $ 0
15% 150,000 8.0 12,000
d. EPS [(EBIT interest) (1 T)] number of common shares outstanding
Debt Ratio Calculation EPS
0% ($60,000 $0) (0.6) 40,000 shares $0.90
($240,000 $0) (0.6) 40,000 shares 3.60
© 2015 Pearson Education, Inc.

2 Gitman/Zutter Principles of Managerial Finance, Brief, Seventh Edition
($420,000 $58,500) (0.6) 22,000 shares 9.86
e. (1) E(EPS) 0.30(EPS1) 0.40(EPS2) 0.30(EPS3)
Debt Ratio Calculation E(EPS)
0% 0.30 (0.90) 0.40 (3.60) 0.30 (6.30)
0.27 1.44 1.89 $3.60
(2) EPS
Debt
Ratio Calculation
0%
s= – ´ + – ´ + – ´
2 2 2
EPS [(0.90 3.60) 0.3] [(3.60 3.60) 0.4] [(6.30 3.60) 0.3]
s= + +EPS 2.187 0 2.187
s=EPS 4.374
s=EPS 2.091
15%
s= – ´ + – ´ + – ´
2 2 2
EPS [(0.85 4.03) 0.3] [(4.03 4.03) 0.4] [(7.20 4.03) 0.3]
s= + +EPS 3.034 0 3.034
s=EPS 6.068
s=EPS 2.463
30%
s= – ´ + – ´ + – ´
2 2 2
EPS [(0.64 4.50) 0.3] [(4.50 4.50) 0.4] [(8.36 4.50) 0.3]
s= + +EPS 4.470 0 4.470
s=EPS 8.94
s=EPS 2.99
45%
s= – ´ + – ´ + – ´
2 2 2
EPS [(0.04 4.95) 0.3] [(4.95 4.95) 0.4] [(9.86 4.95) 0.3]
EPS 7.232 0 7.232s= + +
s=EPS 14.464
s=EPS 3.803
60%
s= – – ´ + – ´ + – ´
2 2 2
EPS [( 1.58 5.18) 0.3] [(5.18 5.18) 0.4] [(11.930 5.18) 0.3]
s= + +EPS 13.669 0 13.669
s=EPS 27.338
EPS 5.229s=
© 2015 Pearson Education, Inc.
Chapter 12: Leverage and Capital Structure 3
(3)
Debt Ratio EPS E(EPS) CV
0% 2.091 3.60 0.581
f. (1)
(2)
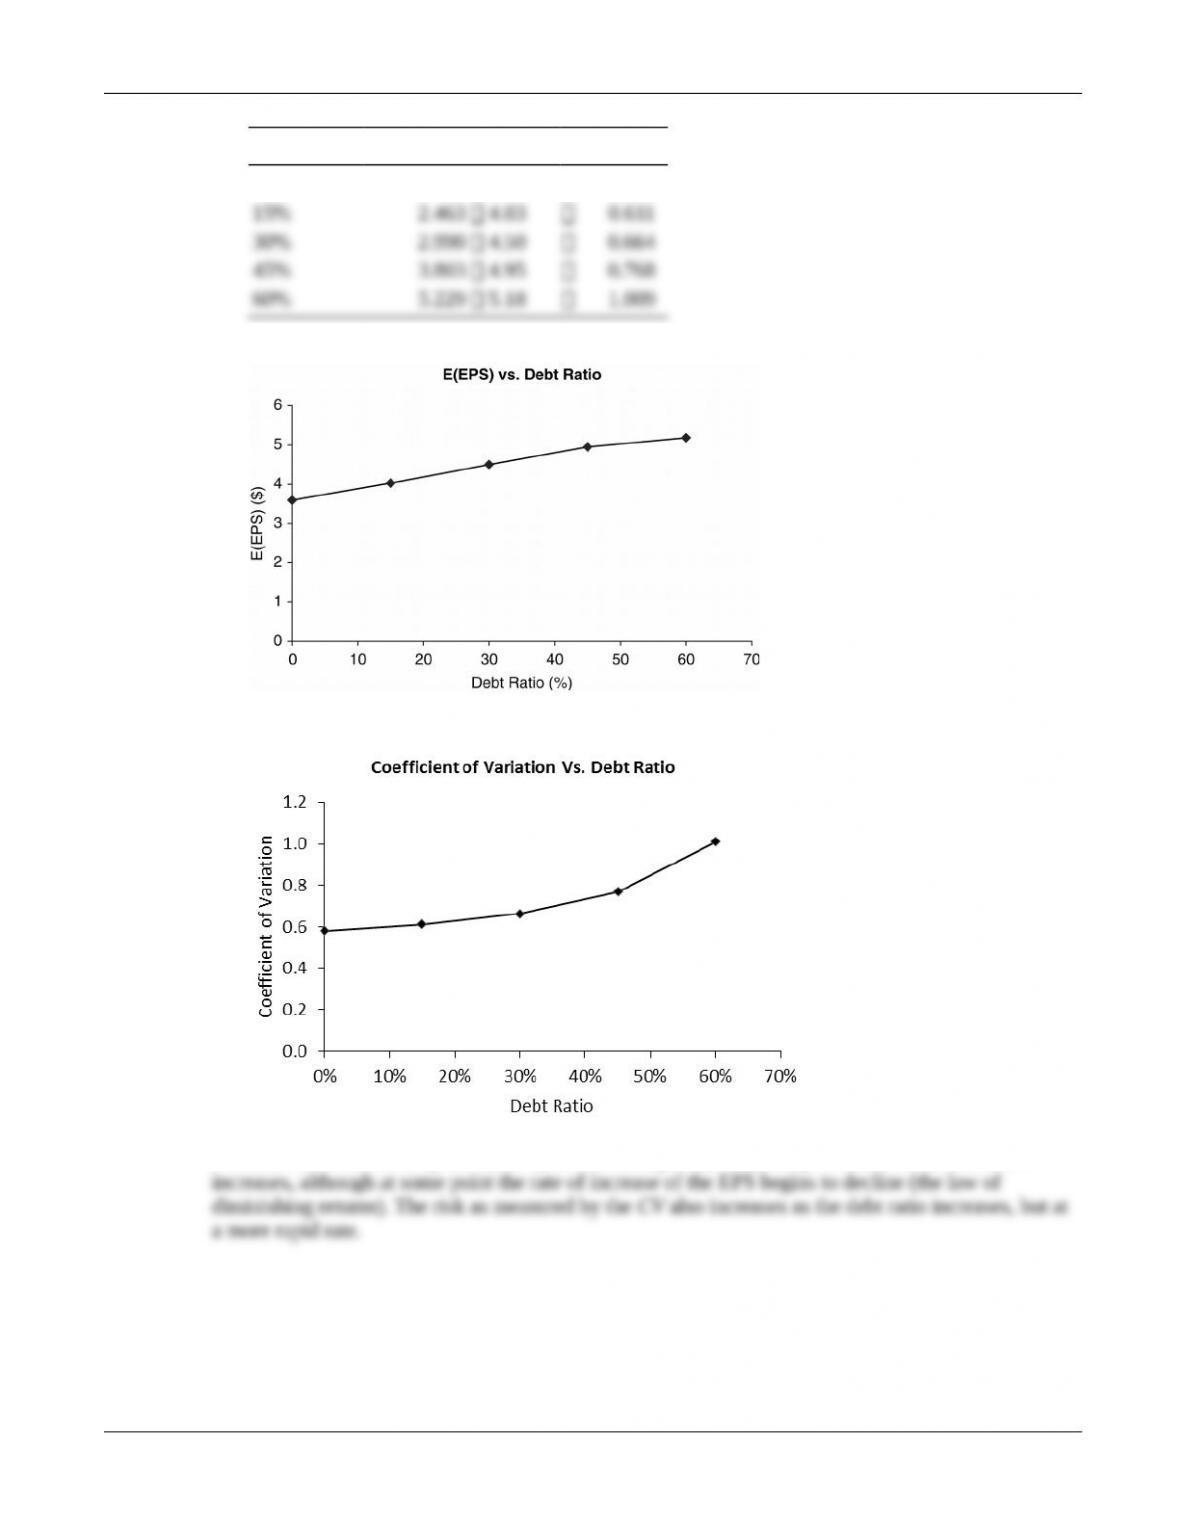
The return, as measured by the E(EPS), as shown in part d, continually increases as the debt ratio
© 2015 Pearson Education, Inc.
4 Gitman/Zutter Principles of Managerial Finance, Brief, Seventh Edition
g.
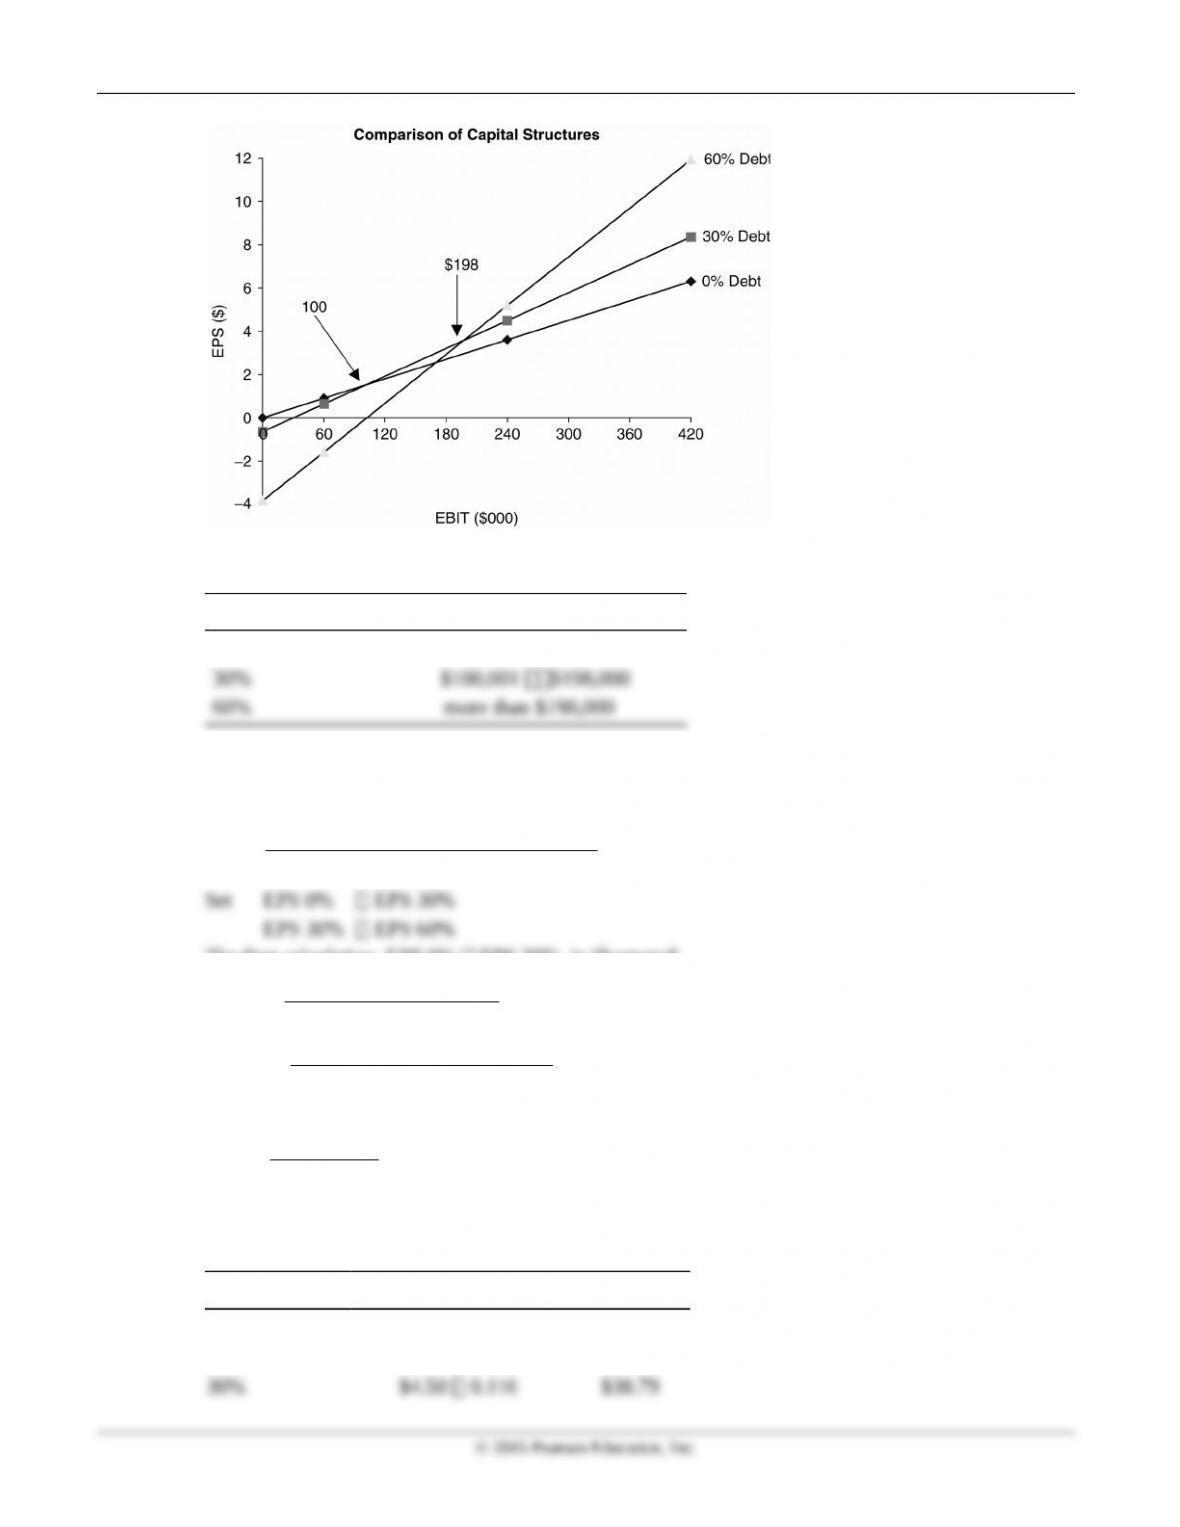
The EBIT ranges over which each capital structure is preferred are as follows:
Debt Ratio EBIT Range
0% $0 $100,000
To calculate the intersection points on the graphic representation of the EBIT-EPS approach to capital
structure, the EBIT level that equates EPS for each capital structure must be found, using the formula
in Footnote 18 of the text.
– ´ – –
=(1 ) (EBIT )
EPS number of common shares outstanding
T I PD
The first calculation, EPS 0% EPS 30%, is illustrated:
– – –
=
0%
[(1 0.4)(EBIT $0) 0]
EPS 40,000 shares
– – –
=
30%
[(1 0.4)(EBIT $30,000) 0]
EPS 28,000 shares
16,800 EBIT 24,000 EBIT 720,000,000= –
720,000,000
EBIT= $100,000
7,200 =
The major problem with this approach is that is does not consider maximization of shareholder wealth
(i.e., share price).
h.
Debt Ratio EPS rsShare Price
0% $3.60 0.100 $36.00
15% $4.03 0.105 $38.38
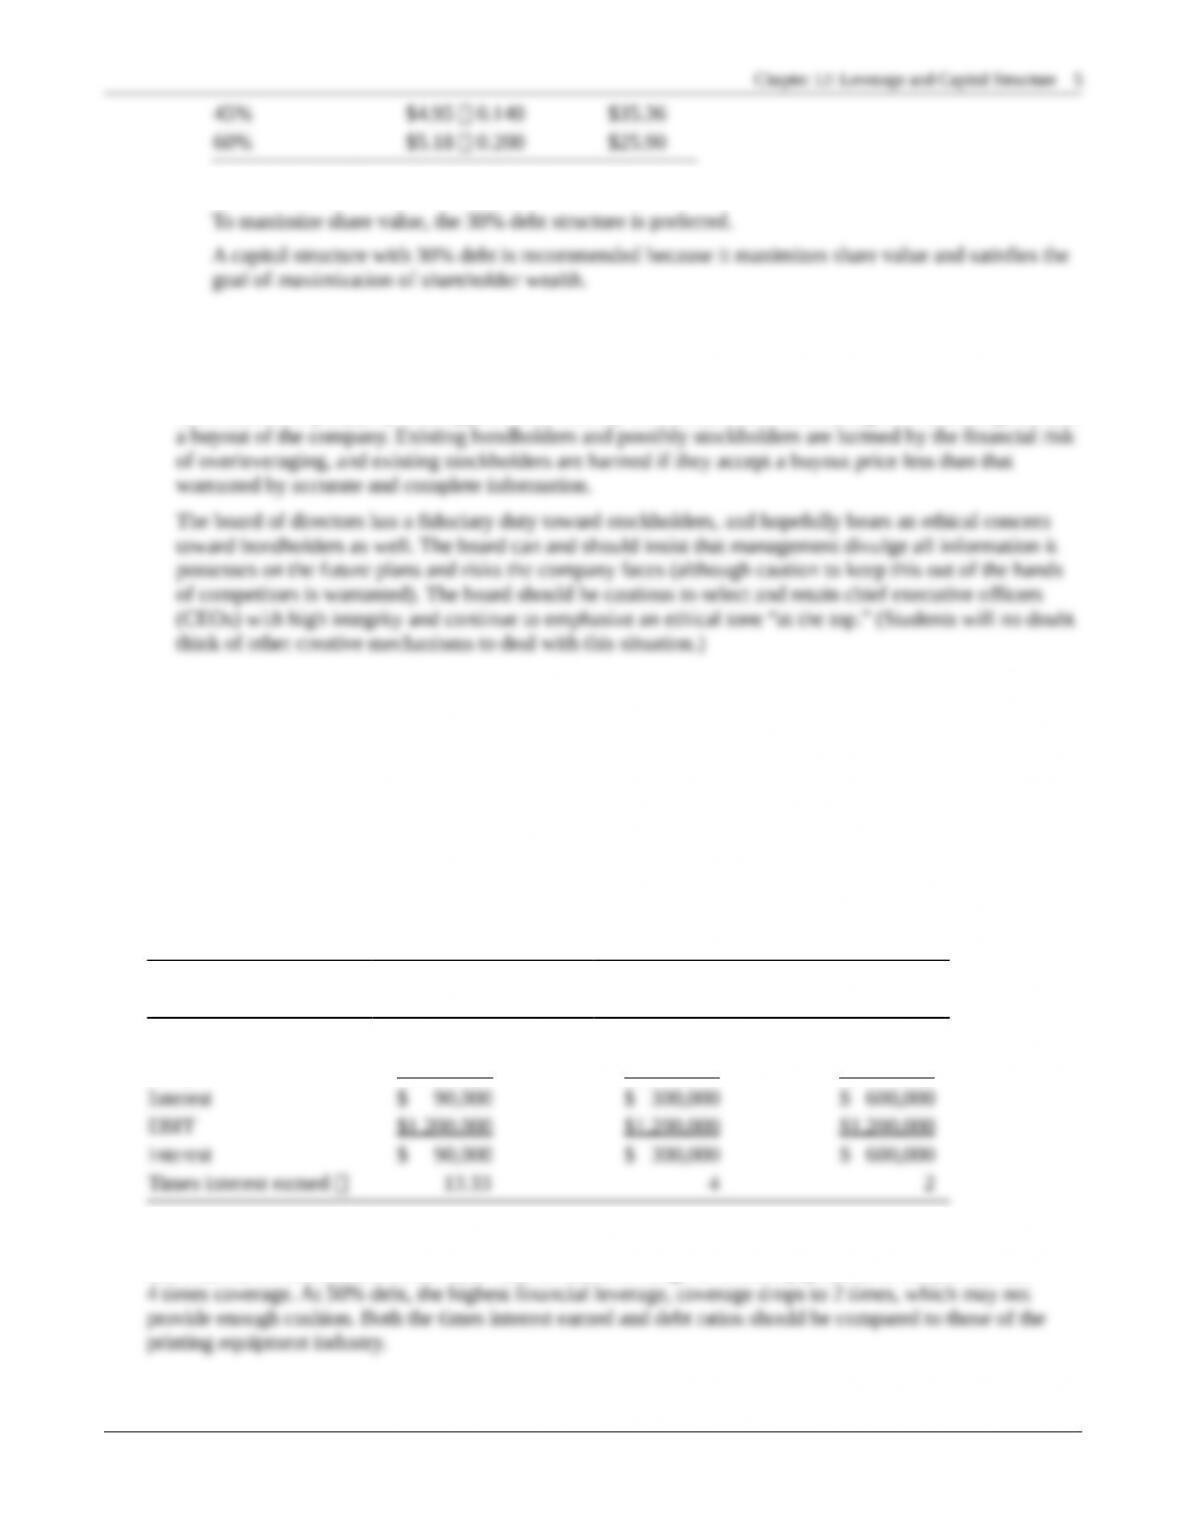
i. To maximize EPS, the 60% debt structure is preferred.
P12-28. Ethics problem
LG 3; Intermediate
Information asymmetry applies to situations in which one party has more and better information than the
other interested party(ies). This appears to be exactly the situation in which managers overleverage or lead
Case
Case studies are available on www.myfinancelab.com.
Evaluating Tampa Manufacturing’s Capital Structure
This case asks the student to evaluate Tampa Manufacturing’s current and proposed capital structures in terms of
maximization of EPS and financial risk before recommending one. It challenges the student to go beyond just the
numbers and consider the overall impact of his or her choices on the firm’s financial policies.
a. Times interest earned calculations
Current
10% Debt
Alternative A
30% Debt
Alternative B
50% Debt
Debt $1,000,000 $3,000,000 $5,000,000
Coupon rate 0.09 0.10 0.12
As the debt ratio increases from 10% to 50%, so do both financial leverage and risk. At 10% debt
and $1,200,000 EBIT, the firm has more than 13 times coverage of interest payments; at 30%, it still has
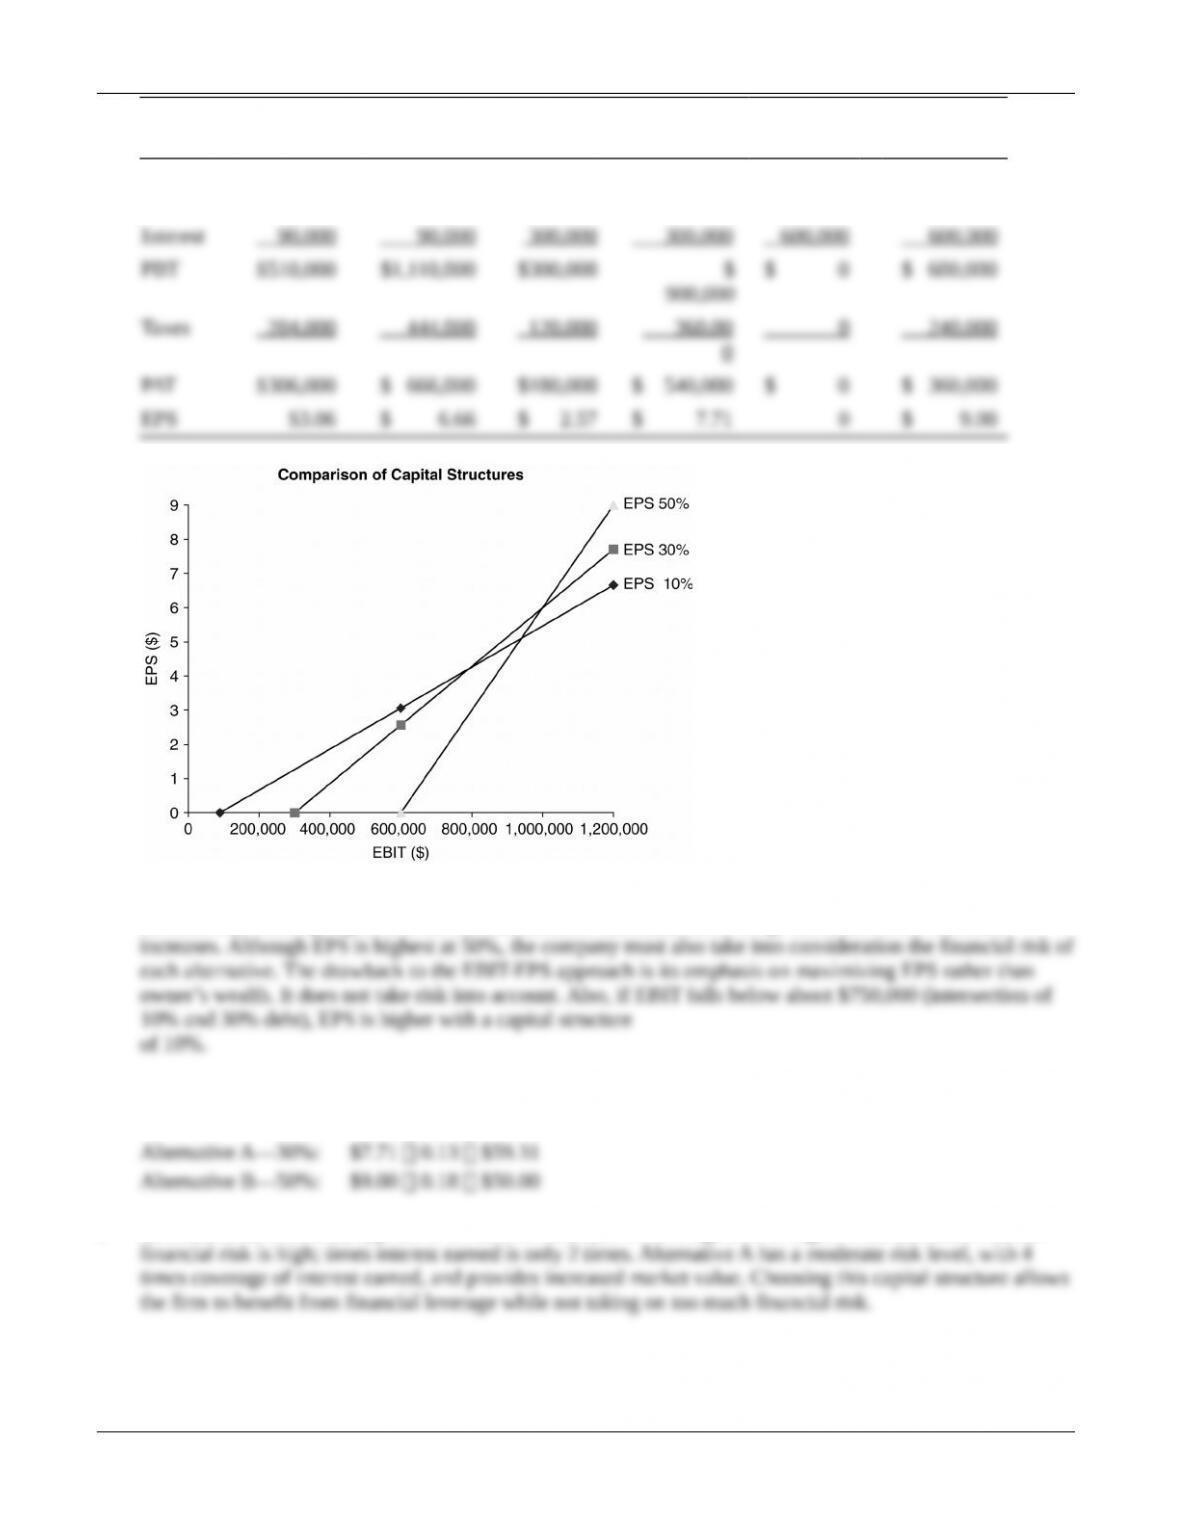
b. EBIT–EPS calculations (using any two EBIT levels)
© 2015 Pearson Education, Inc.
6 Gitman/Zutter Principles of Managerial Finance, Brief, Seventh Edition
Current 10% Debt
100,000 Shares
Alternative A: 30% Debt
70,000 Shares
Alternative B: 50% Debt
40,000 Shares
EBIT $600,000 $1,200,000 $600,000 $1,200,00
0
$600,000 $1,200,000
c. If Tampa Manufacturing’s EBIT is $1,200,000, EPS is highest with the 50% debt ratio. The steeper slope of
the lines representing higher debt levels demonstrates that financial leverage increases as the debt ratio
d. Market value: P0 EPS rs
Current: $6.66 0.12 $55.50
e. Alternative A, 30% debt, appears to be the best alternative. Although EPS is higher with Alternative B, the
Spreadsheet Exercise
© 2015 Pearson Education, Inc.
Chapter 12: Leverage and Capital Structure 7
The answer to Chapter 12’s determination of the optimal capital structure at Starstruck Company spreadsheet
problem is located on the Instructor’s Resource Center at www pearsonhighered.com/irc under the Instructor’s
Manual.
Group Exercise
Group exercises are available on www.myfinancelab.com.
This chapter links with the previous chapter to continue the valuation process of the firm. The first step is to
retrieve the most recent income statement of their shadow firm. The most important measures from the income
statement include measures of leverage such as EBIT, and fixed and variable operating costs. Using this
information, a similar income statement is designed for the fictitious firm.
© 2015 Pearson Education, Inc.