
Part 6
Long-Term Financial Decisions
Chapters in this Part
Chapter 12 Leverage and Capital Structure
Chapter 13 Payout Policy
Chapter 12
Leverage and Capital Structure
Instructor’s Resources
Overview
This chapter introduces the student to the concepts of operating and financial leverage and the associated business and financial
risks. As a prerequisite to operating leverage, breakeven analysis is presented through graphic and algebraic methods. The
limitations of breakeven analysis are also discussed. Financial leverage is presented graphically by comparing financial plans on
a set of earnings before interest and tables-earnings per share (EBIT-EPS) axes. The degree of operating, financial, and total
leverage are presented to provide tools to measure the relative differences in risk of differing operating and financial structures
within the firm. Capital structure is discussed with regard to a firm’s optimal mix of debt and equity, and the EBIT-EPS and
valuation model approaches to evaluate capital structure, as well as important qualitative factors, are presented. Chapter 12
explains how such concepts as breakeven analysis, leverage, and risk arising from borrowing will impact the student’s
professional life and personal life.
Answers to Review Questions
1. Leverage is the use of fixed-cost assets or funds to magnify the returns to owners. Leverage is closely related to the risk
of being unable to meet operating and financial obligations when due. Operating leverage refers to the sensitivity of
2. The firm’s operating breakeven point is the level of sales at which all fixed and variable operating costs are covered;
i.e., EBIT equals zero. An increase in fixed operating costs and variable operating costs will increase the operating
© 2015 Pearson Education, Inc.

2 Gitman/Zutter Principles of Managerial Finance, Brief, Seventh Edition
3. Operating leverage is the ability to use fixed operating costs to magnify the effects of changes in sales on earnings
before interest and taxes. Operating leverage results from the existence of fixed operating costs in the firm’s income stream.
( )
DOL at base sales level ( )
Q P VC
QQ P VC FC
´ –
=´ – –
where:
Q quantity of units
P sales price per unit
VC variable costs per unit
FC fixed costs per period
4. Financial leverage is the use of fixed financial costs to magnify the effects of changes in EBIT on EPS. Financial
leverage is caused by the presence of fixed financial costs such as interest on debt and preferred stock dividends. The degree
of financial leverage (DFL) may be measured by either of two equations:
a.
=% change in EPS
DFL % change in EBIT
b.
[ ]
=– – ´ ¸ –
EBIT
DFL at base level EBIT EBIT (1 (1 ))I PD T
where:
EPS earnings per share
EBIT earnings before interest and taxes
I interest on debt
PD preferred stock dividends
5. The total leverage of the firm is the combined effect of fixed costs, both operating and financial, and is therefore
directly related to the firm’s operating and financial leverage. Increases in these types of leverage will increase total risk,
6. A firm’s capital structure is the mix of long-term debt and equity it utilizes. The key differences between debt and
equity capital are summarized in the table below.
Key Differences between Debt and Equity Capital:
Characteristic
Type of Capital
Debt Equity
*In default, debt holders and preferred stockholders may receive a voice in management;
otherwise, only common stockholders have voting rights.
The ratios used to determine the degree of financial leverage in the firm’s capital structure are the debt ratio and the
debt-equity ratios, which are direct measures, and the times interest earned and fixed-payment coverage ratios that are
© 2015 Pearson Education, Inc.
Chapter 3: Financial Statements and Ratio Analysis 3
indirect measures. Higher direct ratios indicate a greater level of financial leverage. If coverage ratios are low, the firm is
less able to meet fixed payments and will generally have high financial leverage.
7. The capital structure of non-U.S. companies can be quite different from that of U.S. corporations. These firms tend to
Similarities exist between non-U.S. and U.S. firms with regard to capital structure. Debt ratios within industry groupings
generally follow similar patterns, as they do in the United States, and large multinational companies (MNCs) headquartered
8. The tax deductibility of interest is the major benefit of debt financing. In effect, the government subsidizes the cost of
debt through the tax deduction. Because this reduces the amount of taxes paid, more earnings are available for investors.
9. Business risk is the risk that the firm will be unable to cover its operating costs. Three factors affecting business risk are
the use of fixed operating costs (operating leverage), revenue stability, and cost stability. Revenue stability refers to the
10. The agency problem occurs because lenders provide funds to a firm based on their expectations for the firm’s current and
future capital expenditures and capital structure, which determine the firm’s business and financial risk. Firm managers,
as agents of the owners, have an incentive to “take advantage” of lenders. Lenders have an incentive to protect their own
11.Asymmetric information results when a firm’s managers have more information about operations and future prospects than
do investors. This additional information will generally cause financial managers to raise funds using a pecking order (a
Because of management’s access to asymmetric information, the firm’s financing decisions can give signals to investors
12. As financial leverage increases, both the cost of debt and the cost of equity increase, with equity rising at a faster rate.
The overall cost of capital—with the addition of debt—first begins to decrease, reaches a minimum, and then begins to
© 2015 Pearson Education, Inc.
4 Gitman/Zutter Principles of Managerial Finance, Brief, Seventh Edition
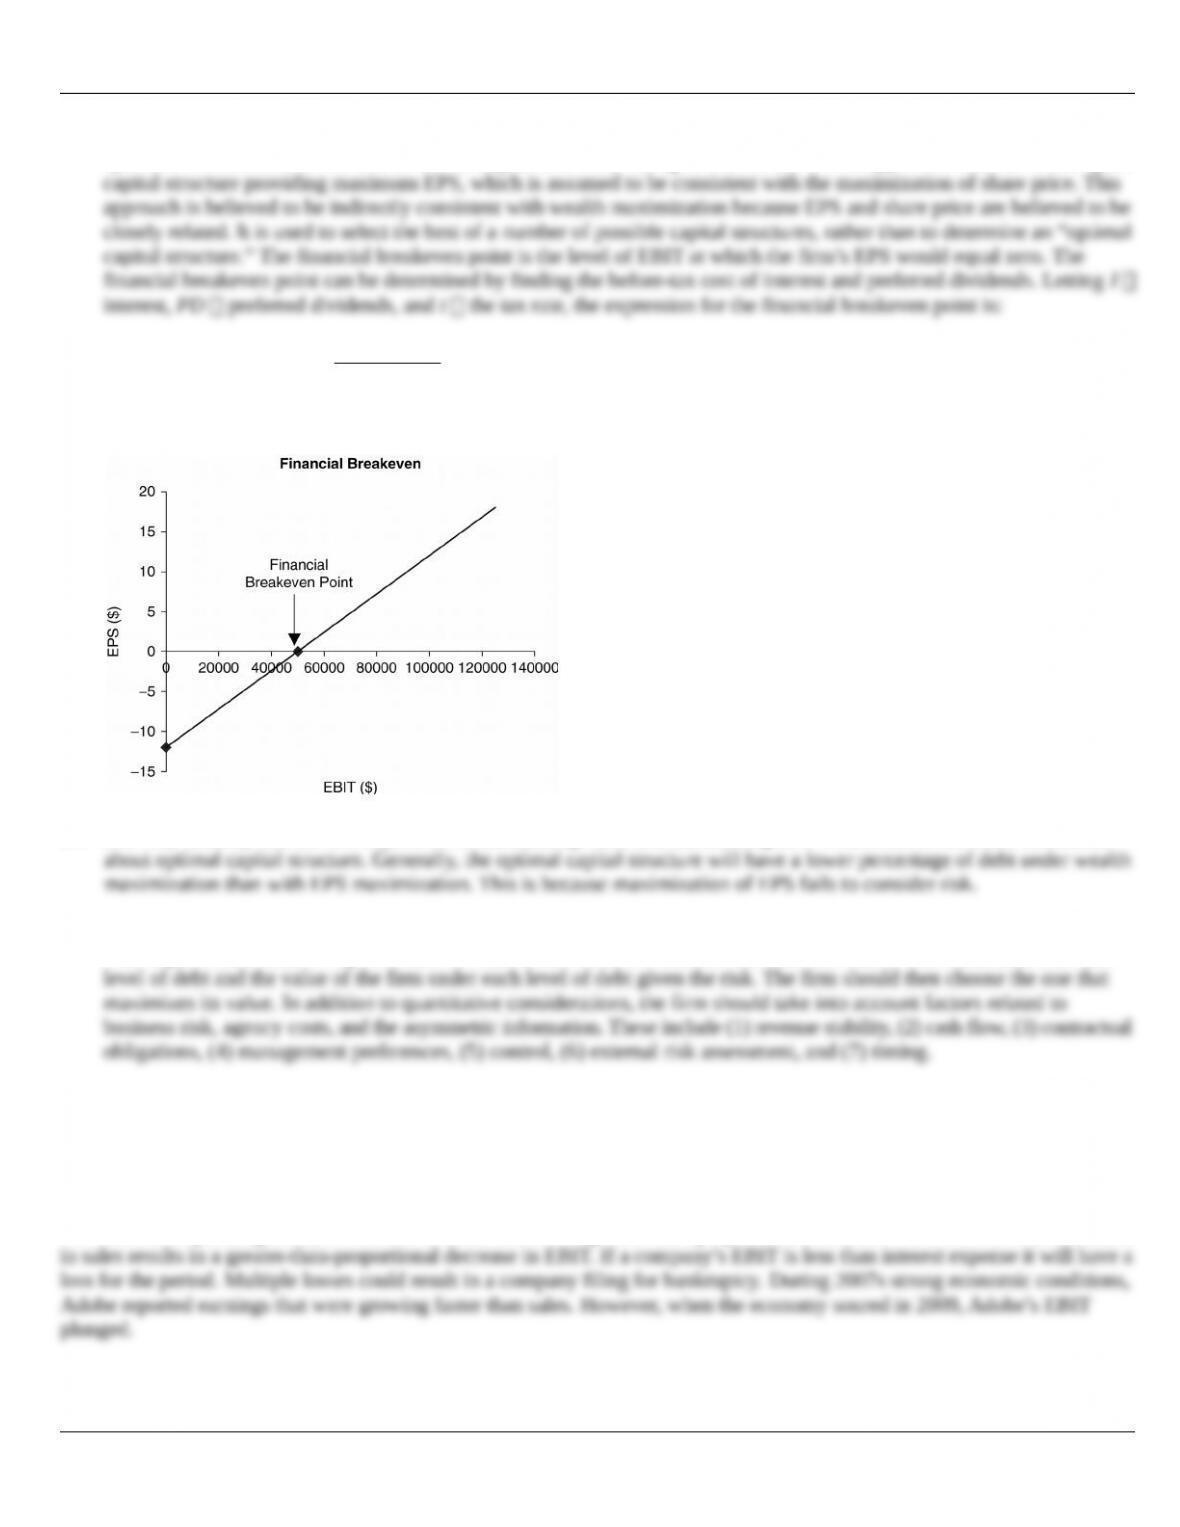
13. The EBIT-EPS approach is based upon the assumption that the firm, by attempting to maximize EPS, will also maximize
the owners’ wealth. The theoretical approach to identifying the optimal capital structure evaluates capital structure based
upon the minimization of the overall cost of capital and maximizing value; the EBIT–EPS approach involves selecting the
15. Basically, the firm should find the optimal capital structure that balances risk and return factors to maximize share value.
This requires estimates of required rates of return under different levels of risk: the estimate of risk associated with each
Suggested Answer to Focus on Practice Box: Adobe’s Leverage
Summarize the pros and cons of operating leverage.
Operating leverage exists when a firm uses fixed operating costs to magnify the effects of changes in sales on EBIT. When a
firm has fixed operating costs, an increase in sales results in a greater-than-proportional increase in EBIT. However, a decrease
Answers to Warm-Up Exercises
© 2015 Pearson Education, Inc.

Chapter 3: Financial Statements and Ratio Analysis 5
E12-1. Breakeven analysis
Answer: The operating breakeven point is the level of sales at which all fixed and variable operating costs are covered and
EBIT is equal to $0.
E12-2. Changing costs and the operating breakeven point
Answer: Calculate the breakeven point for the current process and the breakeven point for the new process, and compare the
two.
E12-3. Risk-adjusted discount rates
Answer: Use Equation 12.5 to find the DOL at 15,000 units.
15,000
$20
$12
$30,000
Q
P
VC
FC
=
=
=
=
15,000 ($20 $12) $120,000
DOL at 15,000 units 1.33
15,000 ($20 $12) $30,000 $90,000
´ –
= = =
´ – –
E12-4. DFL
Answer: Substitute EBIT $20,000, I $3,000, PD $4,000, and the tax rate (T 0.38) into
Equation 12.7.
=– – ´ ¸ –
= =
$20,000
DFL at $20,000 EBIT $20,000 $3,000 [$4,000 (1 (1 0.38)]
$20,000 1.90
$10,548
E12-5. Net operating profits after taxes (NOPAT)
Answer: Calculate EBIT, then NOPAT and the weighted average cost of capital (WACC) for Cobalt Industries.

6 Gitman/Zutter Principles of Managerial Finance, Brief, Seventh Edition
Solutions to Problems
P12-1. Breakeven point—algebraic
LG1; Basic
( )
$12,350 1,300
($24.95 $15.45)
FC
QP VC
Q
=–
= =
–
P12-2. Breakeven comparisons—algebraic
LG 1; Basic
a.
( )
FC
QP VC
=–
Firm F:
( )
$45,000 4,000 units
$18.00 $6.75
Q= =
–
Firm G:
( )
$30,000 4,000 units
$21.00 $13.50
Q= =
–
Firm H:
( )
$90,000 5,000 units
$30.00 $12.00
Q= =
–
b. From least risky to most risky: F and G are of equal risk, then H. It is important to recognize that operating
leverage is only one measure of risk.
P12-3. Breakeven point—algebraic and graphical
LG 1; Intermediate
a. Q FC (P VC)
b.
P12-4. Breakeven analysis
LG 1; Intermediate
© 2015 Pearson Education, Inc.
Chapter 3: Financial Statements and Ratio Analysis 7
a.
( )
= =
–
$73,500 21,000 CDs
$13.98 $10.48
Q
c. 2,000 12 24,000 CDs per year. 2,000 records per month exceeds the operating breakeven by 3,000 records
per year. Barry should go into the CD business.
d. EBIT (P Q) FC (VC Q)
P12-5. Personal finance: Breakeven analysis
LG 1; Easy
P12-6. Breakeven point—changing costs/revenues
LG 1; Intermediate
a. Q F (P VC)Q $40,000 ($10 $8.00) 20,000 books
P12-7. Breakeven analysis
LG 1; Challenge
a.
= = =
– –
$4,000 2,000 figurines
( ) $8.00 $6.00
FC
QP VC
b. Sales $10,000
Less:
Less:
d.
+ +
= = = =
– –
EBIT $4,000 $4,000 $8,000 4,000 units
$8 $6 $2
FC
QP VC
e. One alternative is to price the units differently based on the variable cost of the unit. Those more costly to
© 2015 Pearson Education, Inc.
8 Gitman/Zutter Principles of Managerial Finance, Brief, Seventh Edition
P12-8. EBIT sensitivity
LG 2; Intermediate
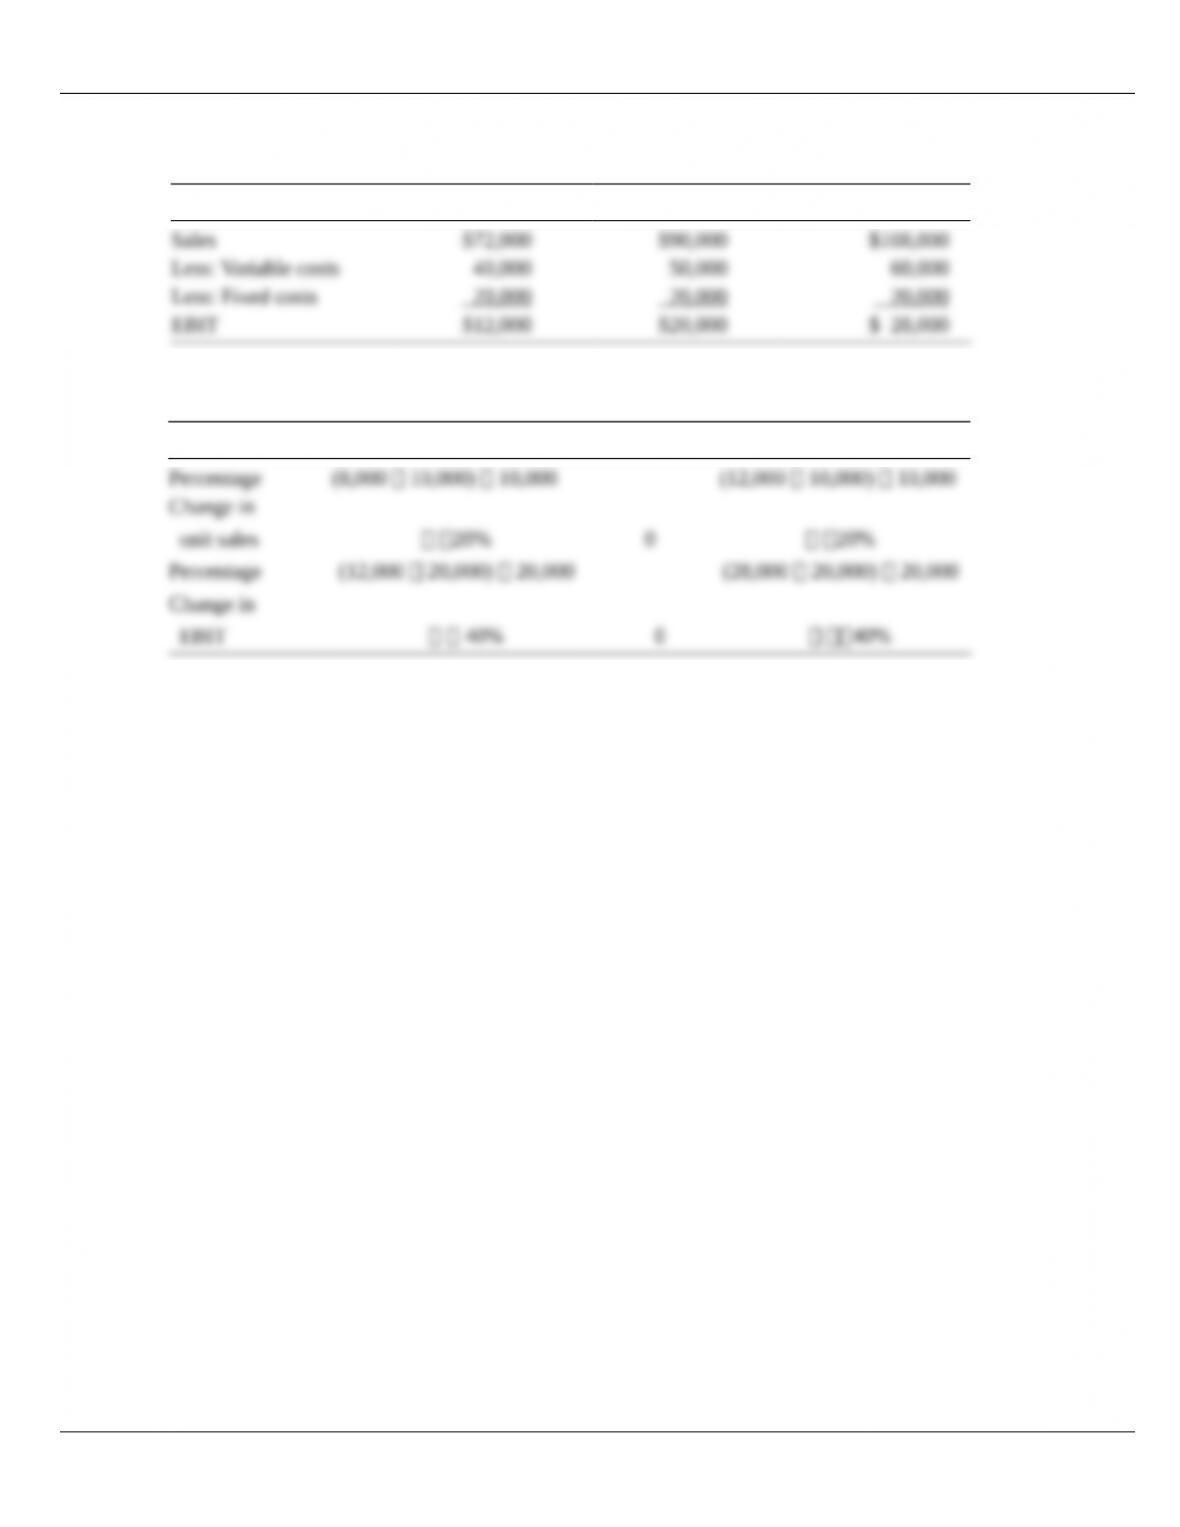
a. and b.
8,000 Units 10,000 Units 12,000 Units
c.
Unit Sales 8,000 10,000 12,000
d. EBIT is more sensitive to changing sales levels; it increases/decreases twice as much as sales.
© 2015 Pearson Education, Inc.