P11-10. Calculating initial investment
LG 3, 4; Challenge
a.Book value ($60,000 0.31) $18,600
b. Sales price of old equipment $35,000
Taxes on recapture of depreciation $16,400 0.40 $6,560
c. Changes in current asset accounts
Inventory $ 50,000
Changes in current liability accounts
Accruals $ (20,000)
d. Cost of new roaster $130,000
P11-11. Incremental operating cash inflows
LG 5; Intermediate
a. Incremental profits before depreciation and tax $1,200,000 $480,000
$720,000 each year
b.
Year (1) (2) (3) (4) (5) (6)
PBDT $720,0
00
$720,000 $720,000 $720,000 $720,000 $720,000
0
© 2015 Pearson Education, Inc.
2 Gitman/Zutter Principles of Managerial Finance, Brief, Seventh Edition
c.
Cash
flow
(1)
$592,000
(2)
$688,000
(3)
$584,000
(4)
$528,000
(5)
$528,000
(6)
$472,000
(NPAT depreciation)
P11-12. Personal finance: Incremental operating cash inflows
LG 5; Challenge
Richard and Linda Thomson
Incremental Operating Cash Flows
Replacement of John Deere Riding Mower
Year 1 Year 2 Year 3 Year 4 Year 5 Year 6
Savings from new and improved mower $500 $ 500 $500 $500 $500 —
Annual maintenance cost 120 120 120 120 120 0
*MACRS Depreciation Schedule
Year Base MACRS Depreciation
Year 1 $1,800 20.0% $360
© 2015 Pearson Education, Inc.
Chapter 3: Financial Statements and Ratio Analysis 3
P11-13. Incremental operating cash flows
LG 5; Intermediate
a.
Year
Reven
ue
Expenses
(excluding
depreciatio
n
and
interest)
Profits
before
Depreciation
and Taxes
Depre–
ciation
Net
Profits
before
Taxes Taxes
Net
Profits
after
Tax
Operati
ng
Cash
Inflows
New Lathe
1 $40,00
0
$30,000 $10,000 $2,00
0
$8,000 $3,2
00
$4,80
0
$6,80
0
0
0
00
0
0
b. Calculation of incremental cash flows
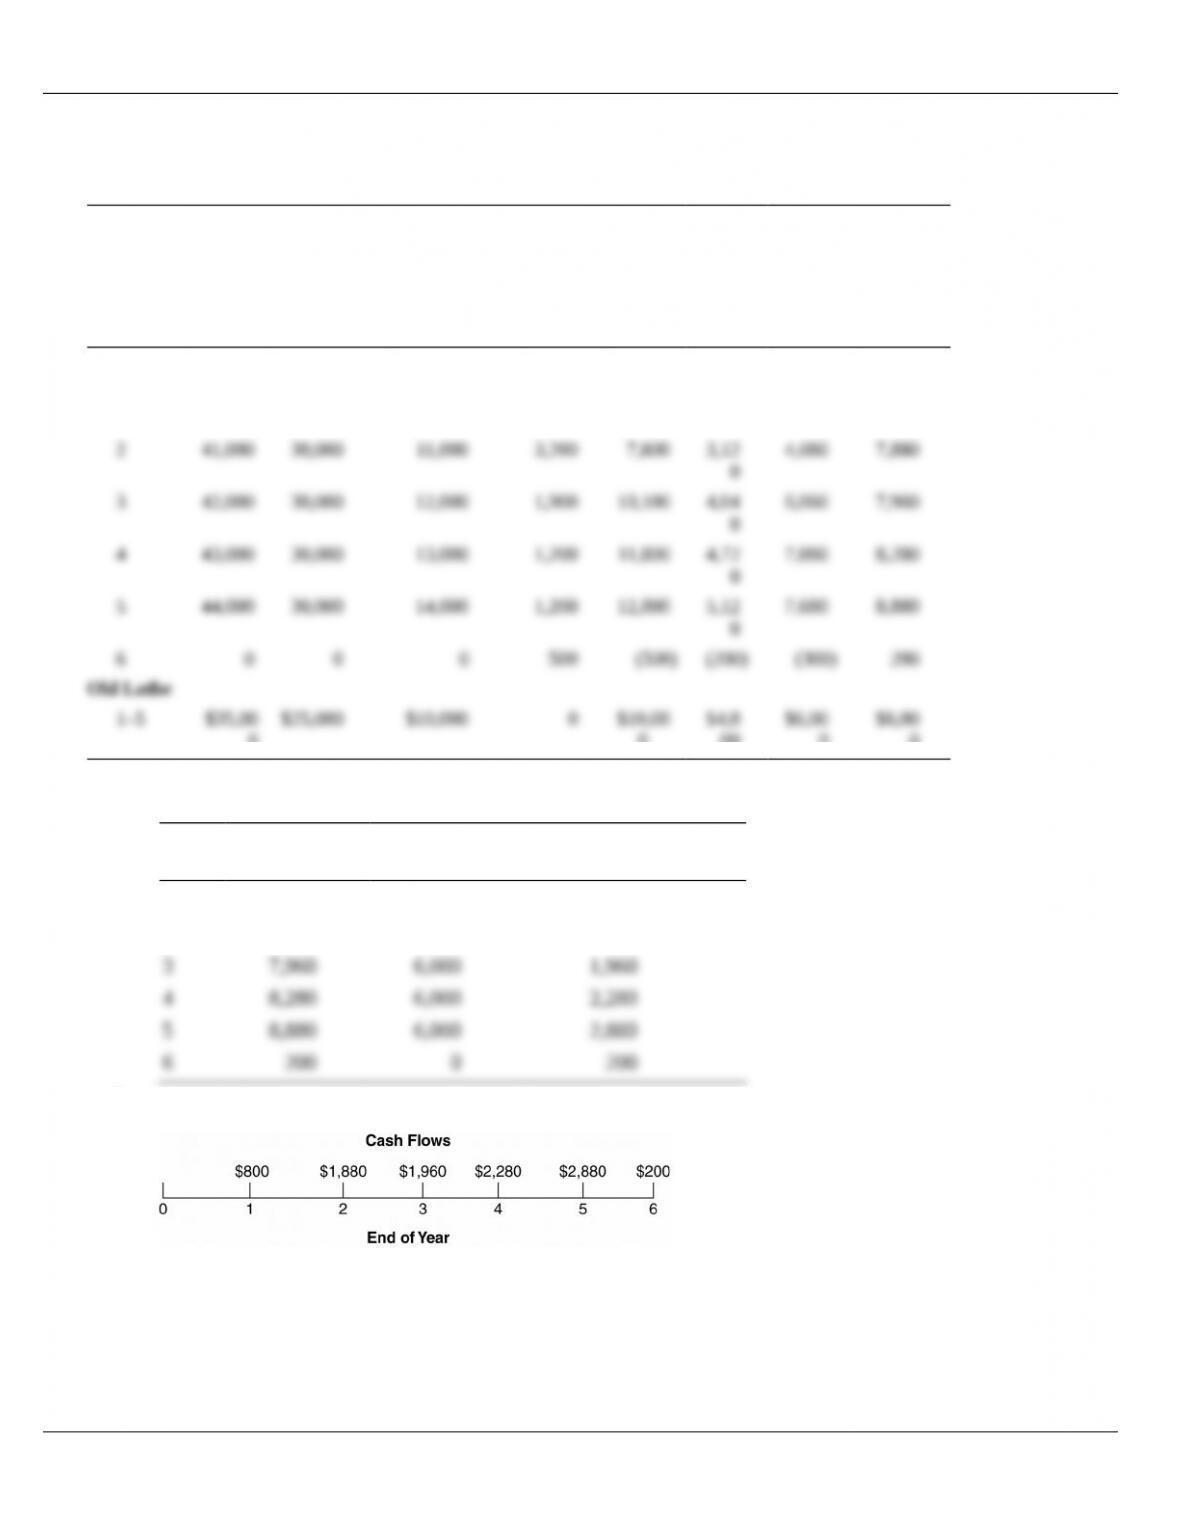
Year New Lathe Old Lathe Incremental Cash
Flows
1 $6,800 $6,000 $800
2 7,880 6,000 1,880
c.
P11-14. Terminal cash flows—various lives and sale prices
LG 6; Challenge
a.
After-tax proceeds from sale of new asset 3-Year*5-Year*7-Year*
Proceeds from sale of proposed asset $10,000 $10,000 $10,000
© 2015 Pearson Education, Inc.
4 Gitman/Zutter Principles of Managerial Finance, Brief, Seventh Edition
Tax on sale of proposed asset* 16,880 400 4,000
*1. Book value of asset [1 (0.20 0.32 0.19)] $180,000 $52,200
Proceeds from sale $10,000
2. Book value of asset [1 (0.20 0.32 0.19 0.12 0.12)] $180,000 $9,000
3. Book value of asset $0
c.
(1) (2)
After-tax proceeds from sale of new asset
1. Book value of the asset $180,000 0.05 $9,000; no taxes are due
2. Tax ($170,000 $9,000) 0.4 $64,400.
d. The higher the sale price, the higher the terminal cash flow.
P11-15. Terminal cash flow—replacement decision
LG 6; Challenge
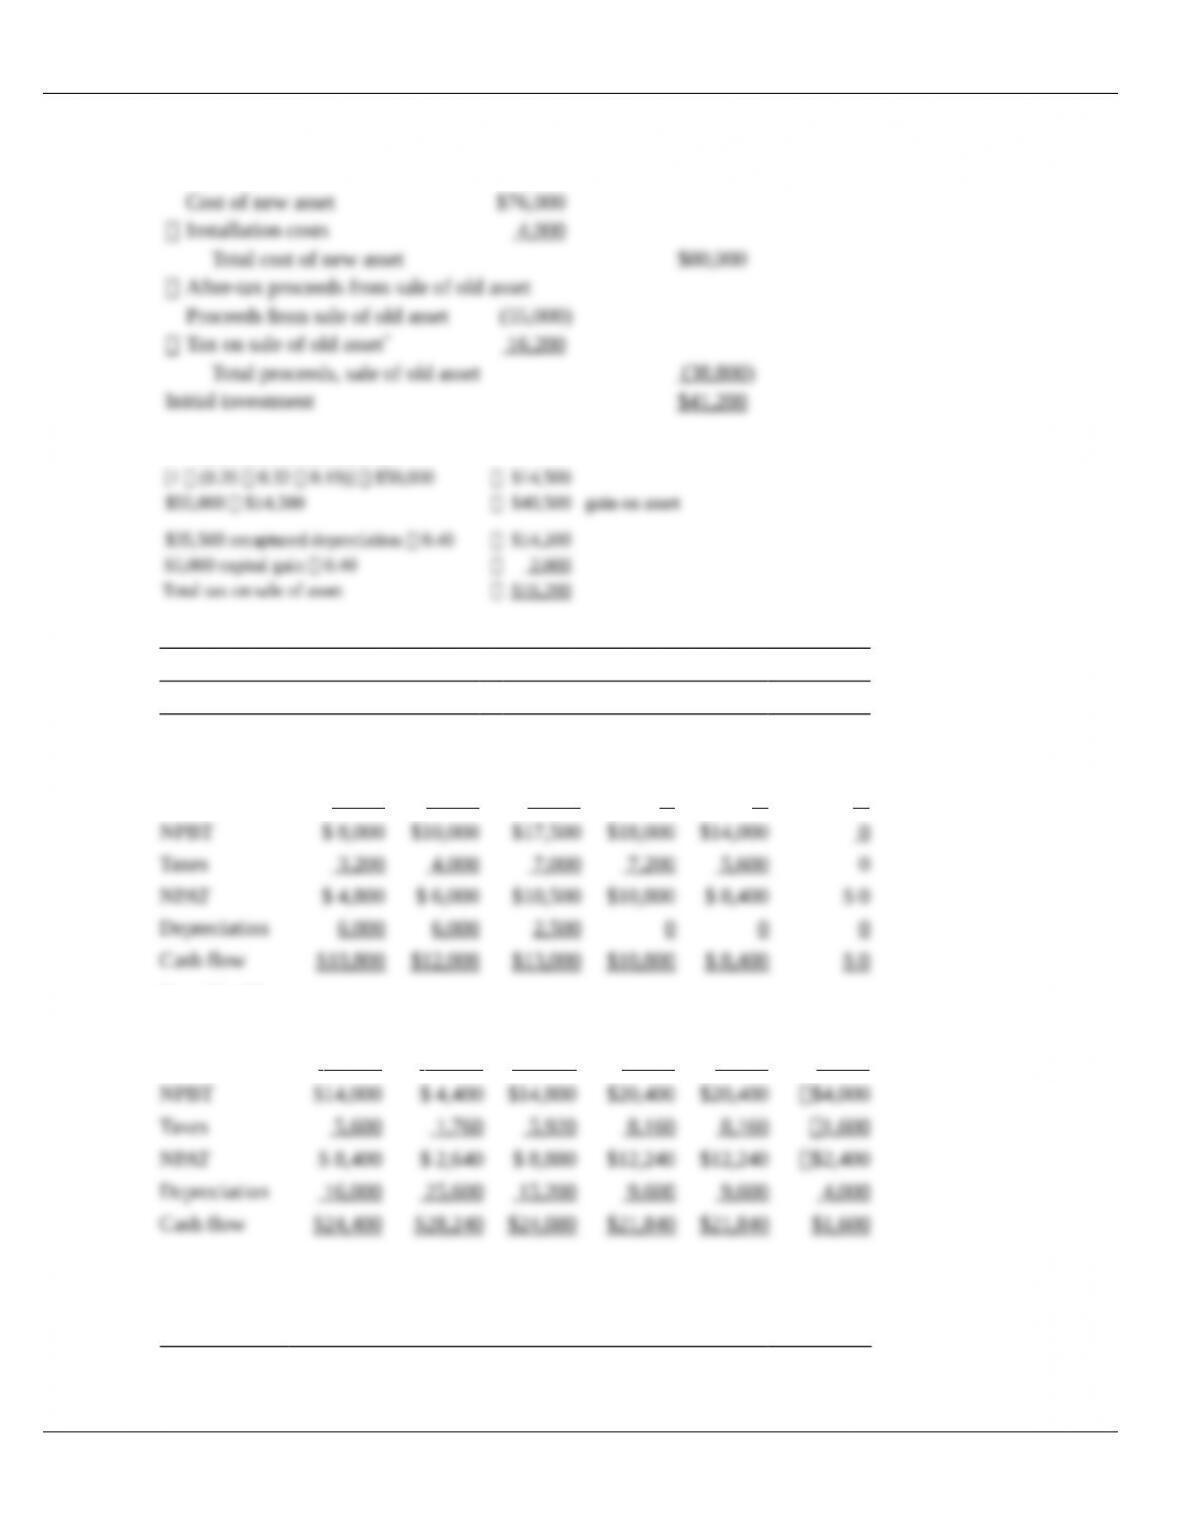
After-tax proceeds from sale of new asset
After-tax proceeds from sale of old asset
Proceeds from sale of old machine (15,000)
1Book value of new machine at end of year 4:
2Book value of old machine at end of year 4:
$0
© 2015 Pearson Education, Inc.
Chapter 3: Financial Statements and Ratio Analysis 5
11-16. Relevant cash flows—no terminal value
LG 3, 4, 5; Challenge
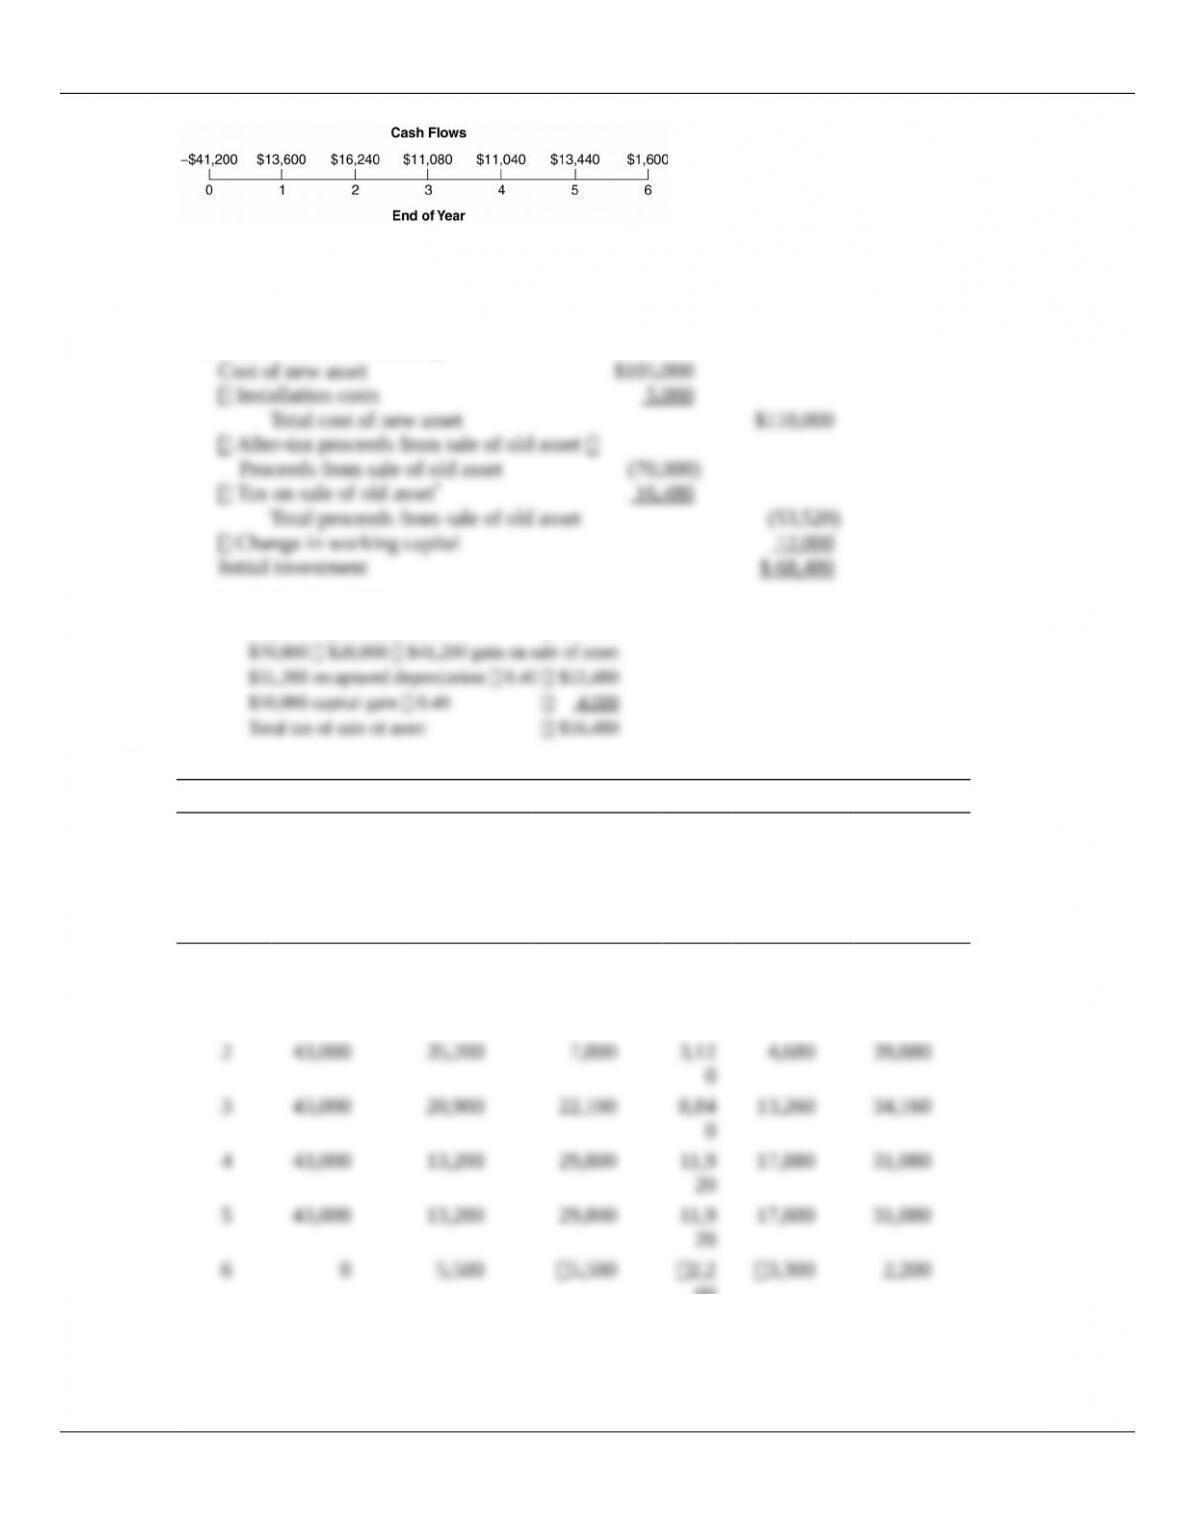
a. Installed cost of new asset
* Book value of old machine:
b.
Calculation of Operating Cash Flow
Year (1) (2) (3) (4) (5) (6)
Old Machine
PBDT $14,000 $16,000 $20,000 $18,000 $14,000 $ 0
Depreciation 6,000 6,000 2,500 0 0 0
New Machine
PBDT $30,000 $30,000 $30,000 $30,000 $30,000 $ 0
Depreciation 16,000 25,600 15,200 9,600 9,600 4,000
Incremental
After-tax
cash flows $13,600 $16,240 $11,080 $11,040 $13,440 $1,600
© 2015 Pearson Education, Inc.
6 Gitman/Zutter Principles of Managerial Finance, Brief, Seventh Edition
c.
P11-17. Integrative—determining relevant cash flows
LG 3, 4, 5, 6; Challenge
a. Initial investment:
Installed cost of new asset
*Book value of old asset:
[1 (0.20 0.32)] $60,000 $28,800
b.
Calculation of Operating Cash Flows
Year
Profits
before
Depreciatio
n
and Taxes
Depreciatio
n
Net Profits
before
Taxes
Taxe
s
Net Profits
after Taxes
Operating
Cash
flows
New Grinder
1 $43,00
0
$22,000 $21,000 $8,4
00
$12,600 $34,60
0
00
Existing Grinder
1 $26,00
0
$11,400 $14,600 $5,8
40
$8,760 $20,16
0
2 24,000 7,200 16,800 6,72 10,080 17,280
© 2015 Pearson Education, Inc.
Chapter 3: Financial Statements and Ratio Analysis 7
0
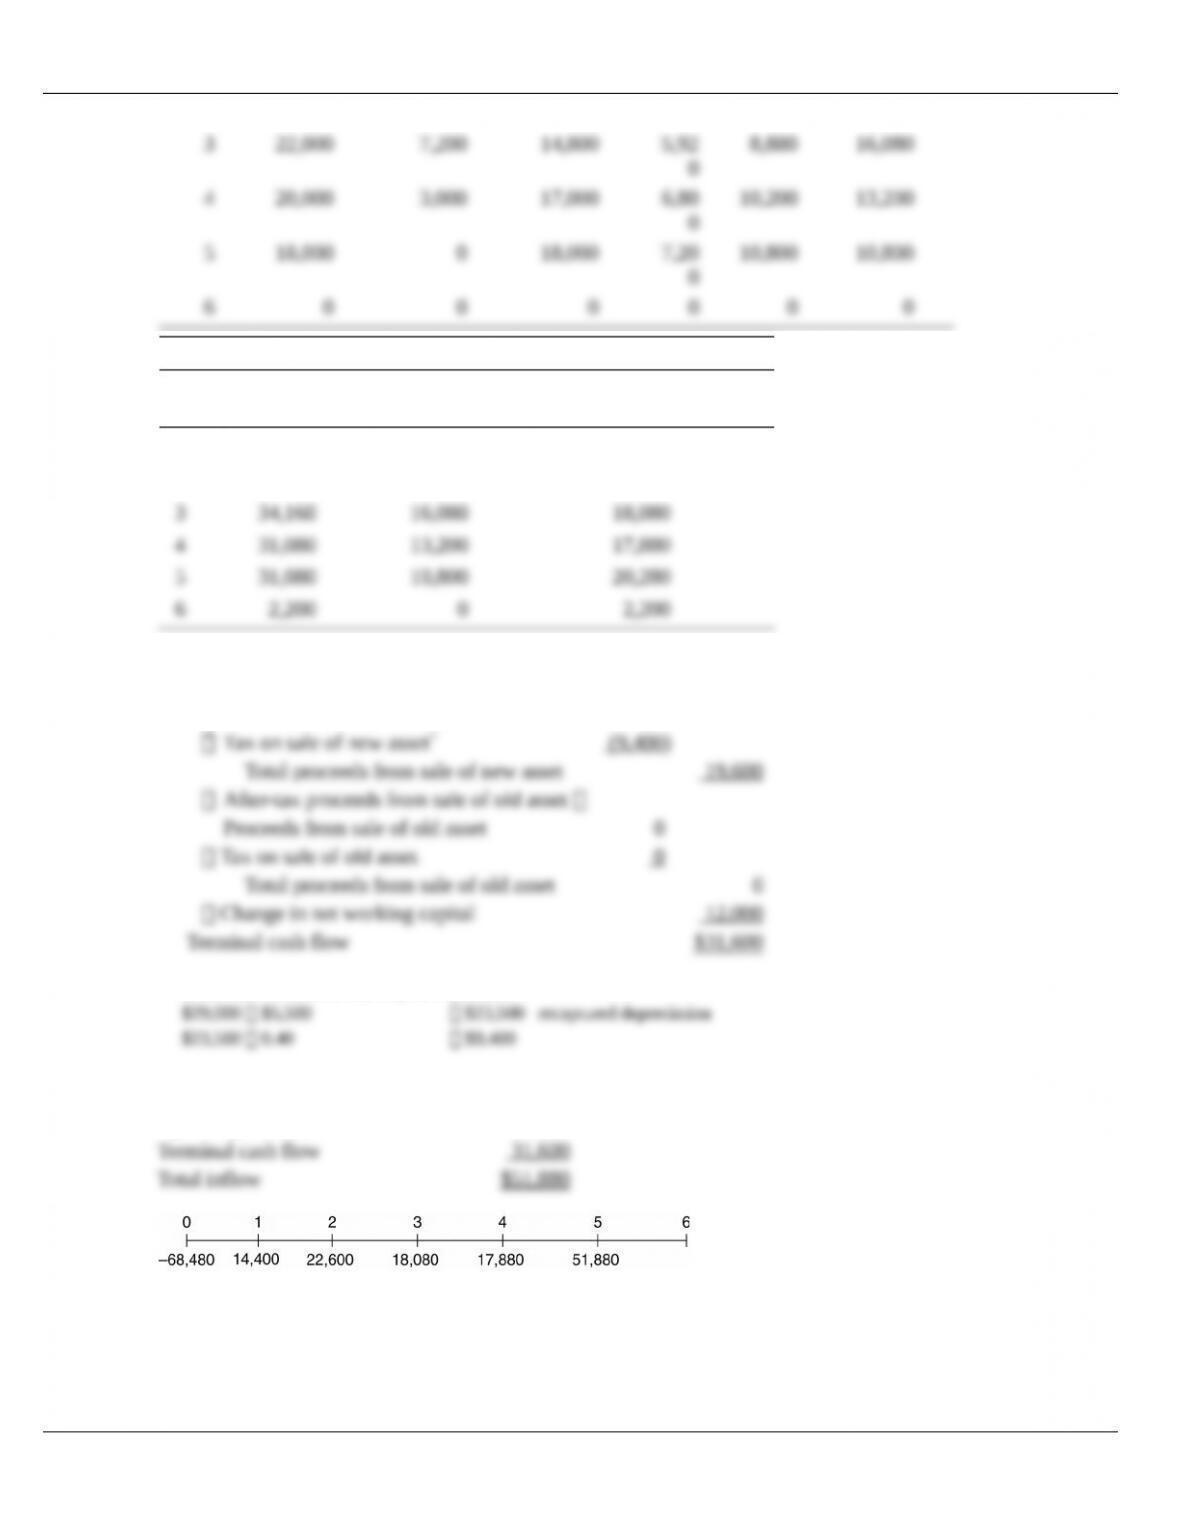
Calculation of Incremental Cash Flows
Year New Grinder
Existing
Grinder
Incremental Operating
Cash Flow
1 $34,600 $20,160 $14,440
2 39,880 17,280 22,600
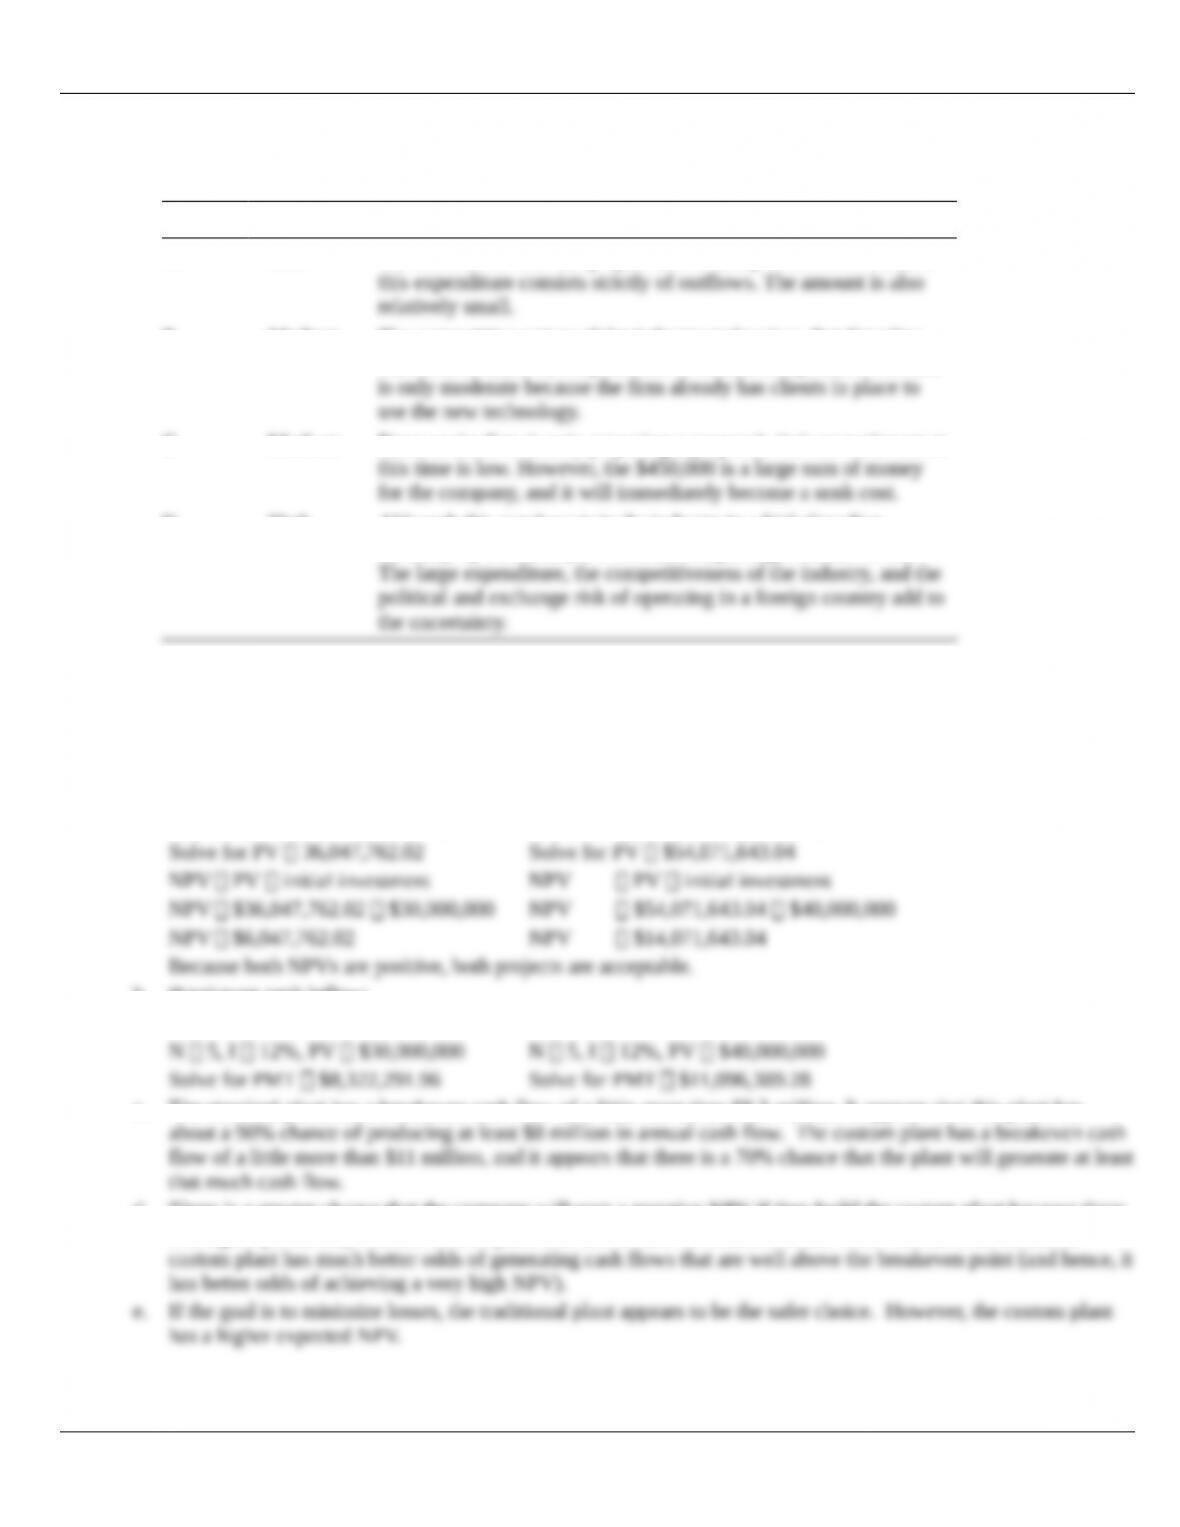
c. Terminal cash flow:
After-tax proceeds from sale of new asset
Proceeds from sale of new asset $29,000
*Book value of asset at end of year 5 $5,500
d. Year 5 relevant cash flow:
Operating cash flow $20,280
© 2015 Pearson Education, Inc.
8 Gitman/Zutter Principles of Managerial Finance, Brief, Seventh Edition
P11-18 Recognizing risk
LG 1; Basic
a. and b.
Project Risk Reason
A Low The cash flows from the project can be easily determined because
B Medium The competitive nature of the industry makes it so that Caradine
will need to make this expenditure to remain competitive. The risk
C Medium Because the firm is only preparing a proposal, their commitment at
D High Although this purchase is in the industry in which Caradine
normally operates, they are encountering a large amount of risk.
Note: Other answers are possible depending on the assumptions a student may make. There is too little information
given about the firm and industry to establish a definitive risk analysis.
P11-19 Breakeven cash inflows and risk
LG 2; Intermediate
a. Standard Plant Custom Plant
N 5, I 12%, PMT $10,000,000 N 5, I 12%, PMT $15,000,000
b. Breakeven cash inflow:
Standard Plant Custom Plant
c. The standard plant has a breakeven cash flow of a little more than $8.3 million. It appears that this plant has
d. There is a greater chance that the company will earn a negative NPV if they build the custom plant because there
is a higher probability that the custom plant will fail to earn its breakeven cash flow. On the other hand, the
P11-20 Basic scenario analysis
LG 2; Intermediate
© 2015 Pearson Education, Inc.
Chapter 3: Financial Statements and Ratio Analysis 9
a. Range A $1,800 $200 $1,600 Range B $1,100 $900 $200
b.
NPVs
Outcome Project A Project B
c. Although the “most likely” outcome is identical for Project A and B, the NPV range varies considerably.
P11-21 Scenario analysis
LG 2; Intermediate
b.
NPVs
Outcome Soft drinks Snack foods
Pessimistic $72.28 $542.17
c. Range Soft drinks $3,144.57 $72.28 $3,072.29
Each machine has the same most likely result. Machine for snack foods has both a greater potential loss and a
greater potential return. Therefore, the decision will depend on the risk disposition of management.
© 2015 Pearson Education, Inc.