P10-9. NPV and maximum return
LG 3; Challenge
a. N 4, I 10%, PMT $44,400
Solve for PV $140,742.03
At a cost of capital of 10%, the NPV is −$9,258, which means that the project is not acceptable.
P10-10. NPV—mutually exclusive projects
LG 3; Intermediate
a. and b.
Press A
CF0 −$85,000; CF1 $18,000; F1 8
Press B
CF0 −$60,000; CF1 $12,000; CF2 $14,000; CF3 $16,000; CF4 $18,000;
Press C
CF0 −$130,000; CF1 $50,000; CF2 $30,000; CF3 $20,000; CF4 $20,000;
c. Ranking—using NPV as criterion
Rank Press NPV
d. Profitability Indexes
© 2015 Pearson Education, Inc.
2 Gitman/Zutter Principles of Managerial Finance, Brief, Seventh Edition
Press C: $145,043.89 $130,000 1.12
P10-11. Personal finance: Long-term investment decisions, NPV method
LG 3
Key information:
Cost of MBA program $100,000
($50,000 for tuition and $50,000 for lost earnings)
P10-12. Payback and NPV
LG 2, 3; Intermediate
a.
Project Payback Period
b. Worksheet keystrokes
Year Project A Project B Project C
0$40,000 $40,000 $40,000
Solve for
NPV
$2,565.82 $322.53 $5,454.17
Accept Reject Accept
Project C is preferred using the NPV as a decision criterion.
© 2015 Pearson Education, Inc.
Chapter 3: Financial Statements and Ratio Analysis 3
c. At a cost of 16%, Project C has the highest NPV. Because of Project C’s cash flow characteristics, high early-year
cash inflows, it has the lowest payback period and the highest NPV.
P10-13. NPV and EVA
LG 3; Intermediate
P10-14. IRR—Mutually exclusive projects
LG 4; Intermediate
IRR is found by solving:
1
$0 initial investment
(1 IRR)
nt
t
t
CF
=
é ù
= –
ê ú
+
ë û
å
Project A
CF0 $90,000; CF1 $20,000; CF2 $25,000; CF3 $30,000; CF4 $35,000; CF5 $40,000
Project B
CF0 $490,000; CF1 $150,000; CF2 $150,000; CF3 $150,000; CF4 $150,000
Project C
CF0 $20,000; CF1 $7500; CF2 $7500; CF3 $7500; CF4 $7500; CF5 $7500
Project D
CF0 $240,000; CF1 $120,000; CF2 $100,000; CF3 $80,000; CF4 $60,000
P10-15. IRR
LG 4; Intermediate
The IRR of the project is 4%. Because the IRR is lower than the firm’s cost of capital, the firm should reject the
© 2015 Pearson Education, Inc.
4 Gitman/Zutter Principles of Managerial Finance, Brief, Seventh Edition
each of the next two years. In a project like this, the IRR decision rule is the opposite of the normal case. Because
P10-16. IRR—Mutually exclusive projects
LG 4; Intermediate
a. and b.
Project X
1 2345
$100,000 $120,000 $150,000 $190,000 $250,000
$0 $500,000
(1 IRR) (1 IRR) (1 IRR) (1 IRR) (1 IRR)
= + + + + –
+ + + + +
CF0 −$500,000; CF1 $100,000; CF2 $120,000; CF3 $150,000; CF4 $190,000
CF5 $250,000
Solve for IRR 15.67; since IRR cost of capital, accept the project.
Project Y
1 2345
$140,000 $120,000 $95,000 $70,000 $50,000
$0 $325,000
(1 IRR) (1 IRR) (1 IRR) (1 IRR) (1 IRR)
= + + + + –
+ + + + +
CF0 $325,000; CF1 $140,000; CF2 $120,000; CF3 $95,000; CF4 $70,000
CF5 $50,000
Solve for IRR 17.29%; because IRR cost of capital, accept the project.
c. Project Y, with the higher IRR, is preferred, although both are acceptable.
P10-17. Personal Finance: Long-term investment decisions, IRR method
LG 4; Intermediate
IRR is the rate of return at which NPV equals zero
P10-18. IRR, investment life, and cash inflows
LG 4; Challenge
a. N 10, PV −$61,450, PMT $10,000
b. I 15%, PV $61,450, PMT $10,000
c. N 10, I 15%, PV $61,450
© 2015 Pearson Education, Inc.
Chapter 3: Financial Statements and Ratio Analysis 5
Solve for PMT $12,244.04
P10-19. NPV and IRR
LG 3, 4; Intermediate
a. N 7, I 10%, PMT $4,000
b. N 7, PV $18,250, PMT $4,000
c. The project should be accepted because the NPV 0 and the IRR the cost of capital.
P10-20. NPV, with rankings
LG 3, 4; Intermediate
a. NPVA $45,665.50 (N 3, I 15, PMT $20,000) $50,000
NPVB Key strokes
NPVC Key strokes
NPVD Key strokes
b.
Rank Press NPV
1 C $7,088.02
c. Using the calculator, the IRRs of the projects are:
© 2015 Pearson Education, Inc.
6 Gitman/Zutter Principles of Managerial Finance, Brief, Seventh Edition
Project IRR
A 9.70%
Note: Because Project A was the only rejected project from the four projects, all that was
needed to find the minimum acceptable cost of capital was to find the IRR of A.
P10-21. All techniques, conflicting rankings
LG 2, 3, 4: Intermediate
a.
Project A Project B
Year
Cash
Inflows
Investment
Balance Year
Cash
Inflows
Investment
Balance
0$150,000 0 $150,000
1 $45,000 105,000 1 $75,000 75,000
Chapter 3: Financial Statements and Ratio Analysis 7
IRRB:
CF0 $150,000; CF1 $75,000; CF2 $60,000; CF3 $120,000
Solve for IRR 22.71%
e.
Rank
Project Payback NPV IRR
A 2 1 2
B 1 2 1
The project that should be selected is A. The conflict between NPV and IRR is due partially to the reinvestment
f. NPVA:
CF0 $150,000; CF1 $45,000; F1 6
NPVB:
At a cost of capital of 12%, the NPV of Project A is $35,013, and the NPV of Project B is $37,436. In this case,
P10-22. Payback, NPV, and IRR
LG 2, 3, 4; Intermediate
a. Payback period
b. NPV computation
c.
1 2 3 4 5
$20,000 $25,000 $30,000 $35,000 $40,000
$0 $95,000
(1 IRR) (1 IRR) (1 IRR) (1 IRR) (1 IRR)
= + + + + –
+ + + + +
d. NPV $9,080; because NPV 0; accept
© 2015 Pearson Education, Inc.
8 Gitman/Zutter Principles of Managerial Finance, Brief, Seventh Edition
P10-23. NPV, IRR, and NPV profiles
LG 3, 4, 5; Challenge
a. and b.
Project A
CF0 $130,000; CF1 $25,000; CF2 $35,000; CF3 $45,000
Project B
CF0 $85,000; CF1 $40,000; CF2 $35,000; CF3 $30,000
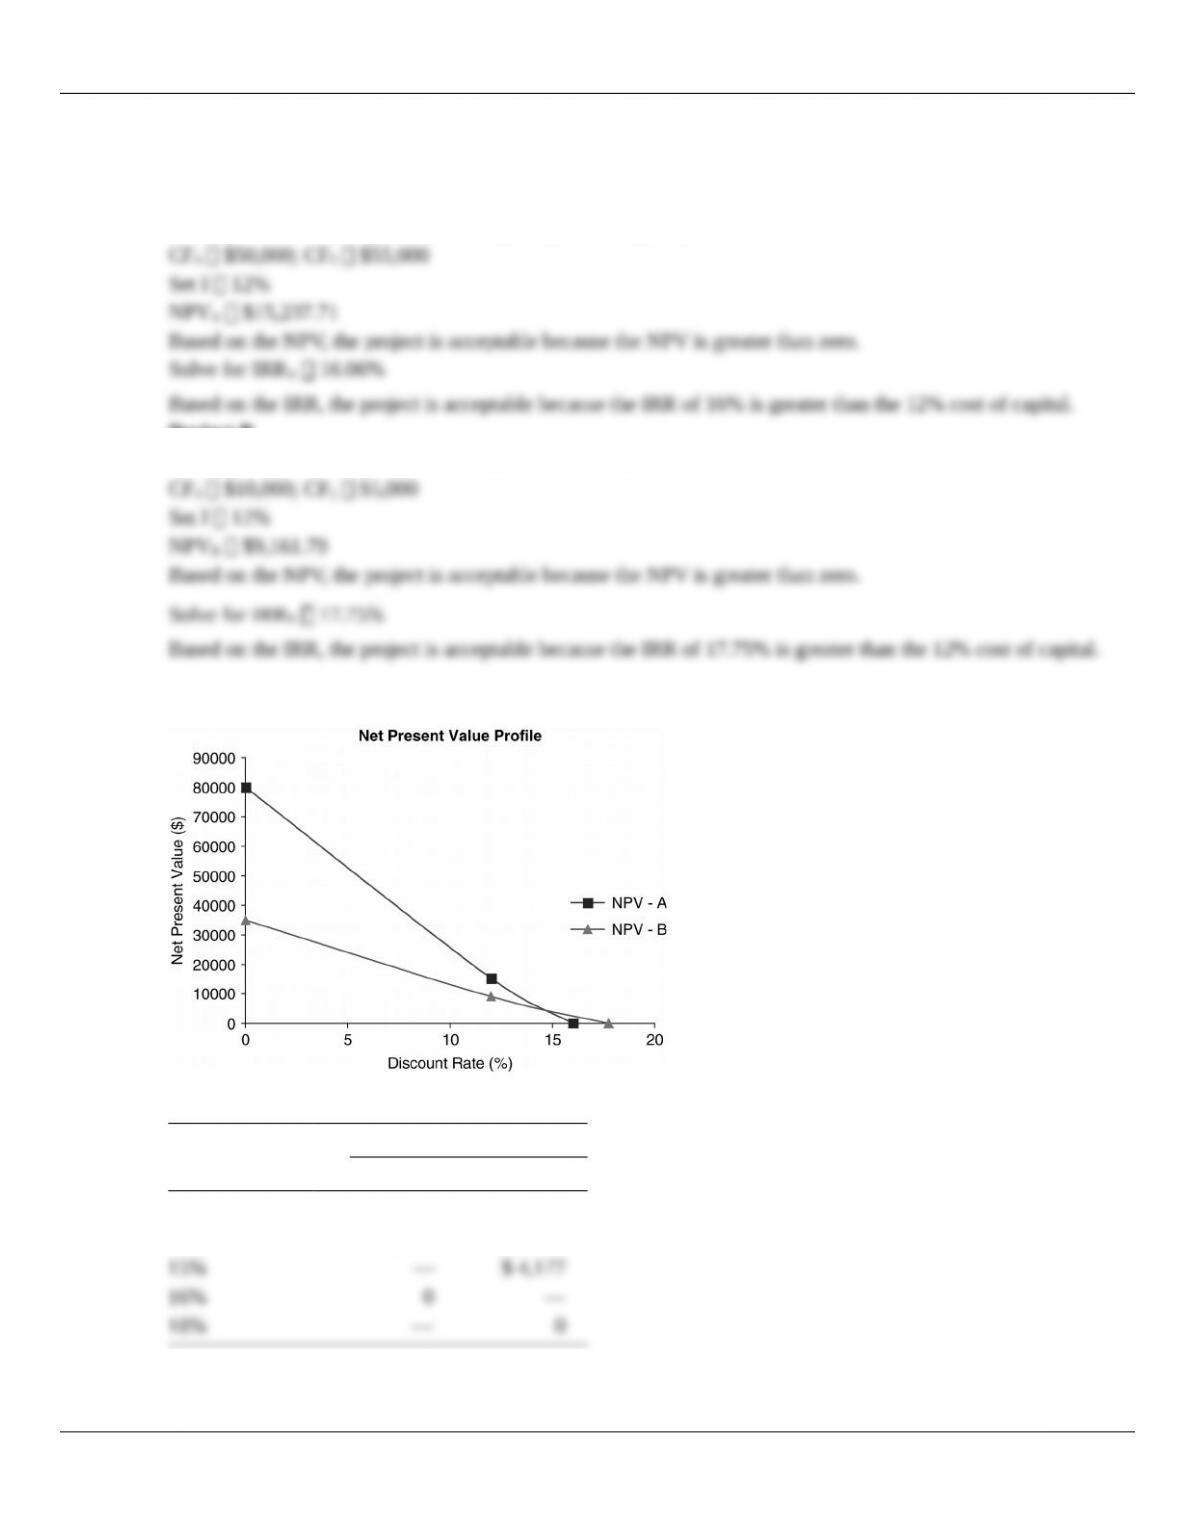
c.
Data for NPV Profiles
NPV
Discount Rate A B
0% $80,000 $35,000
12% $15,238 $9,161
d. The net present value profile indicates that there are conflicting rankings at a discount rate less than the
intersection point of the two profiles (approximately 15%). The conflict in rankings is caused by the relative cash
© 2015 Pearson Education, Inc.

Chapter 3: Financial Statements and Ratio Analysis 9
e. Project A has an increasing cash flow from Year 1 through Year 5, whereas Project B has a decreasing cash flow
© 2015 Pearson Education, Inc.