P8-10. Assessing return and risk
LG 2; Challenge
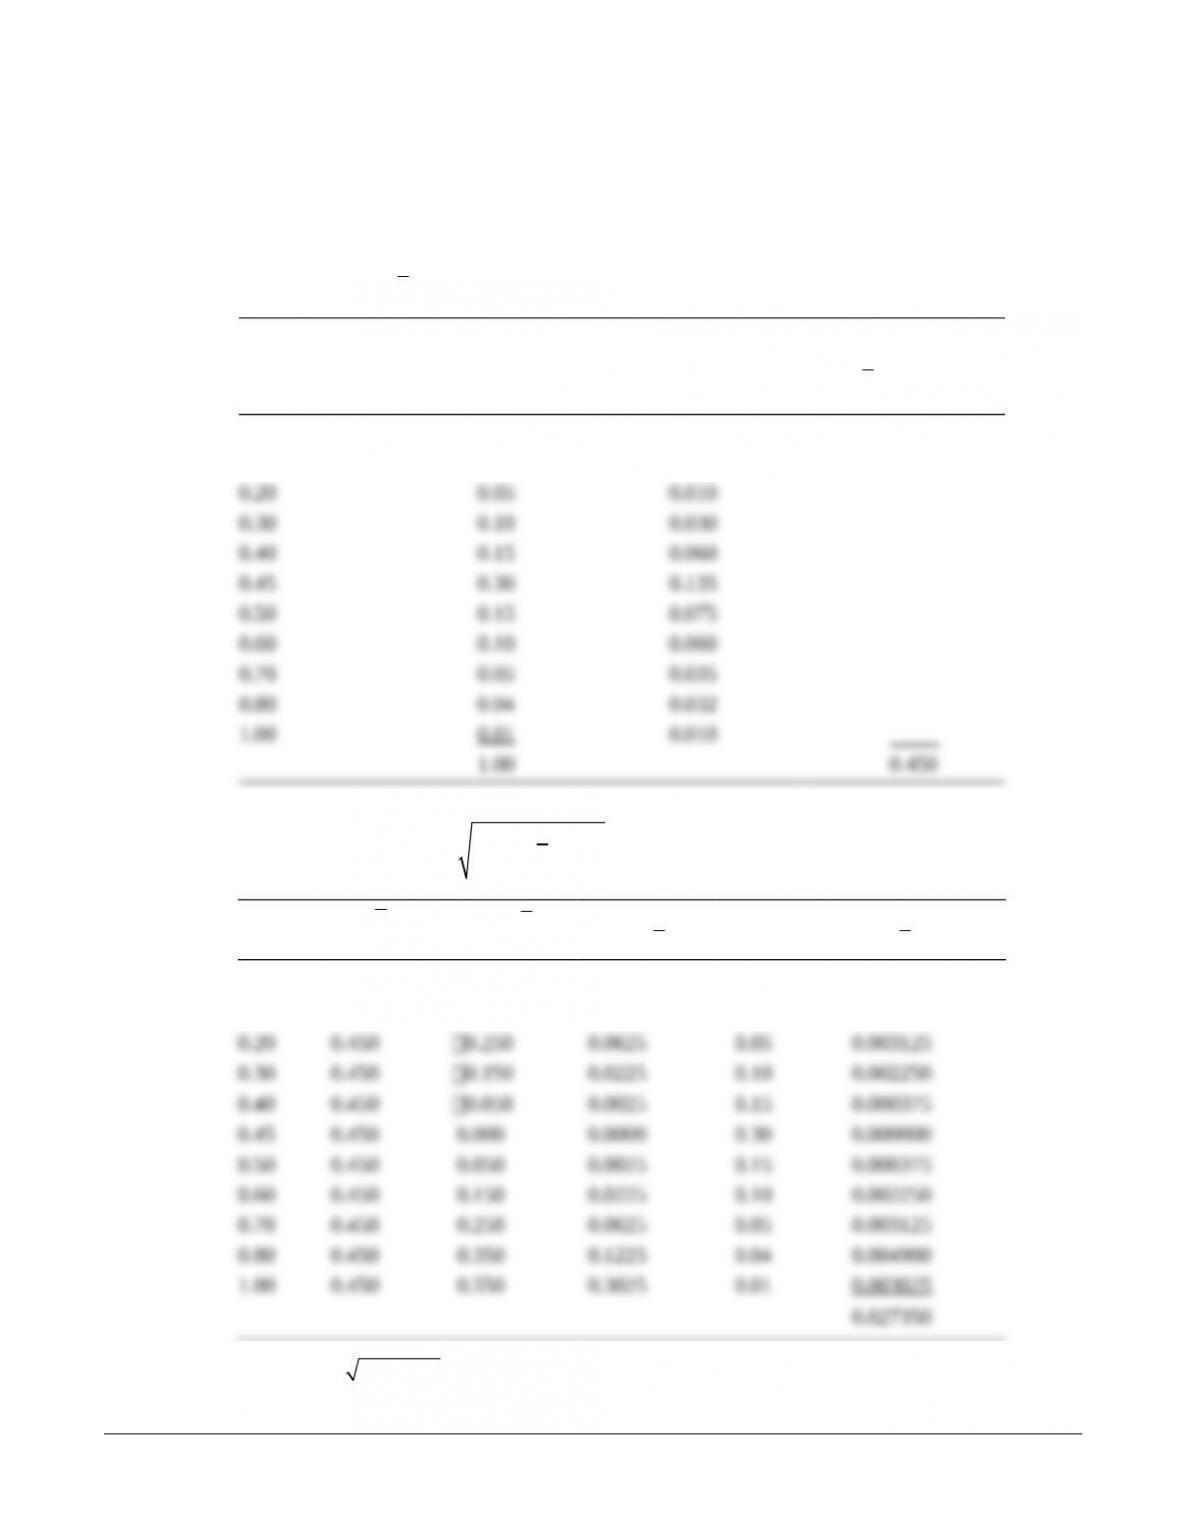
a. Project 257
(1) Range: 1.00 (.10) 1.10
(2) Expected return:
=1
n
i ri
i
r r P= ´
å
Rate of Return
ri
Probability
Pr i
Weighted Value
ri Pr i
Expected Return
å
1=
= ´
n
i ri
i
r r P
.10 0.01 0.001
0.10 0.04 0.004
(3) Standard deviation:
2
1
( )
n
i ri
i
r r Ps
=
= – ´
å
ri
r
–
i
r r
( )–
i
r r
2Pr i
( )–
i
r r
2Pr i
0.10 0.450 0.550 0.3025 0.01 0.003025
0.10 0.450 0.350 0.1225 0.04 0.004900
Project 257
0.027350 0.165378s= =
© 2015 Pearson Education, Inc.
(4)
0.165378 0.3675
0.450
CV = =
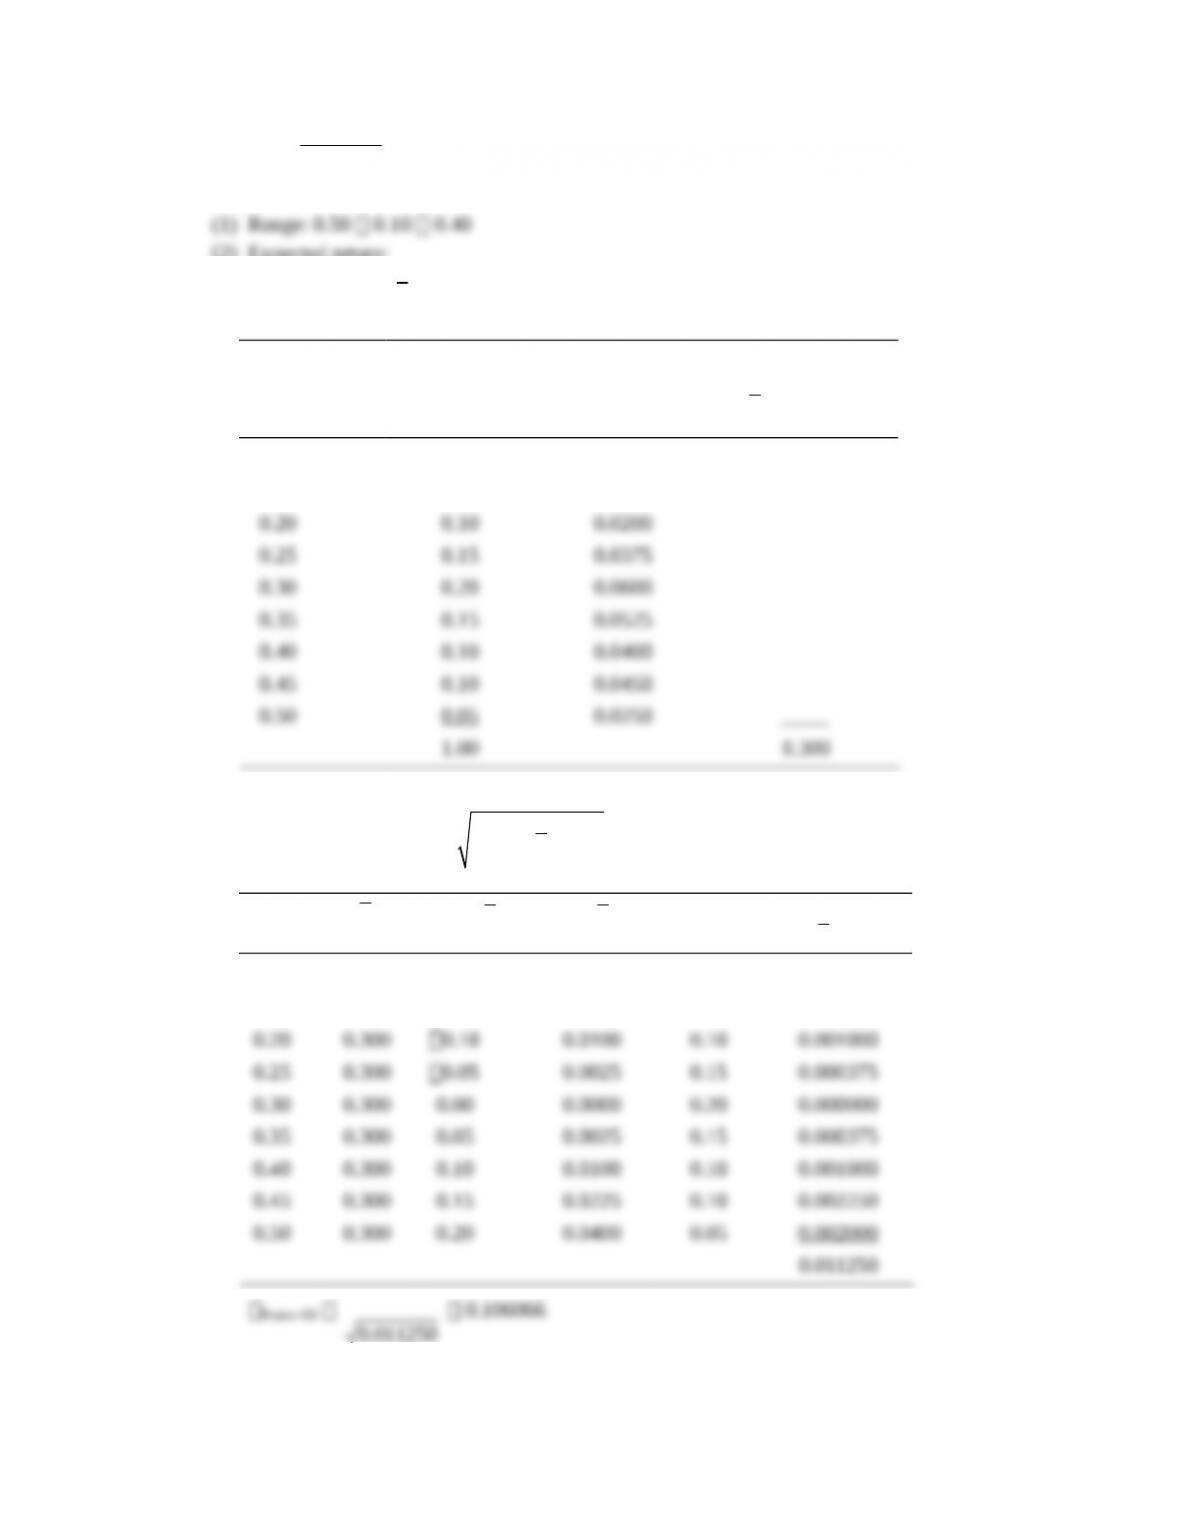
Project 432
(2) Expected return:
1
n
i ri
i
r r P
=
= ´
å
Rate of Return
ri
Probability
Pr i
Weighted Value
riPri
Expected Return
å
=1
= ´
n
i ri
i
r r P
0.10 0.05 0.0050
0.15 0.10 0.0150
(3) Standard deviation:
2
1
( )
n
i ri
i
r r Ps
=
= – ´
å
ri
r
–
i
r r
2
( )
i
r r–
Pri
P
2
( )
i ri
r r– ´
0.10 0.300 0.20 0.0400 0.05 0.002000
0.15 0.300 0.15 0.0225 0.10 0.002250
Project 432
0.011250
0.106066
(4)
0.106066 0.3536
0.300
CV = =
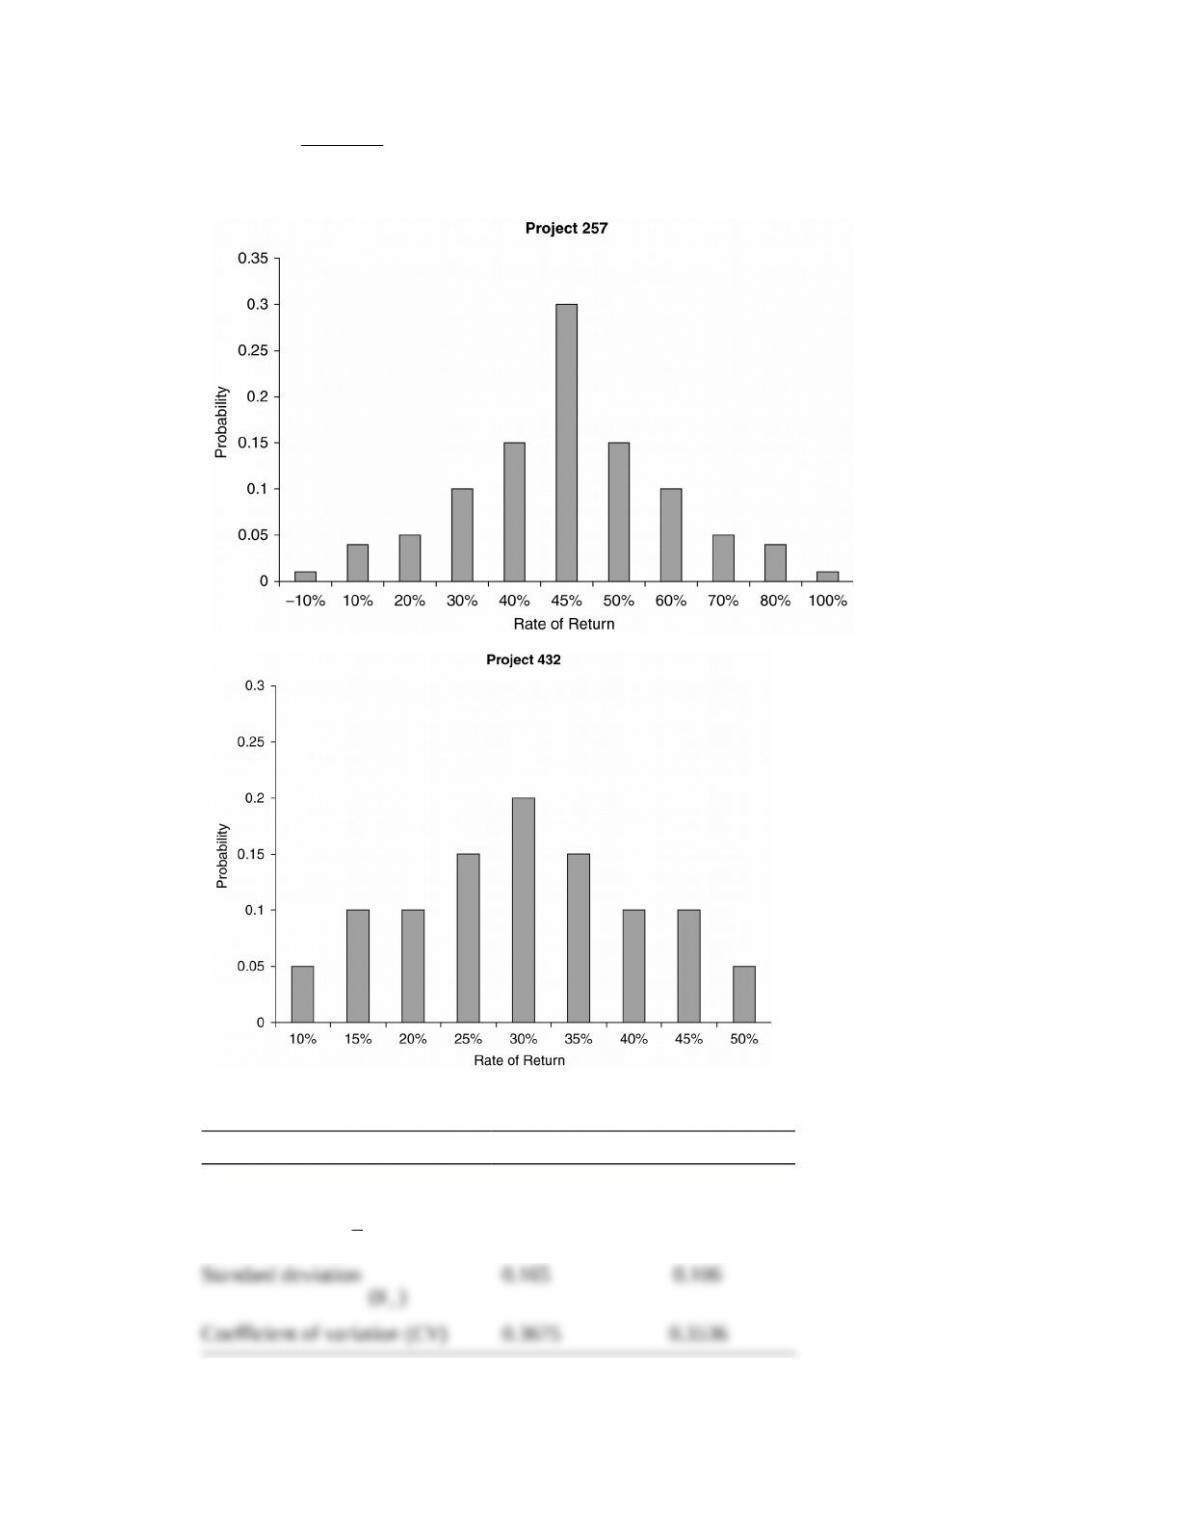
b. Bar Charts
c. Summary statistics
Project 257 Project 432
Range 1.100 0.400
Expected return
( )r
0.450 0.300
Standard deviation
( )
r
s
0.165 0.106
Coefficient of variation (CV) 0.3675 0.3536
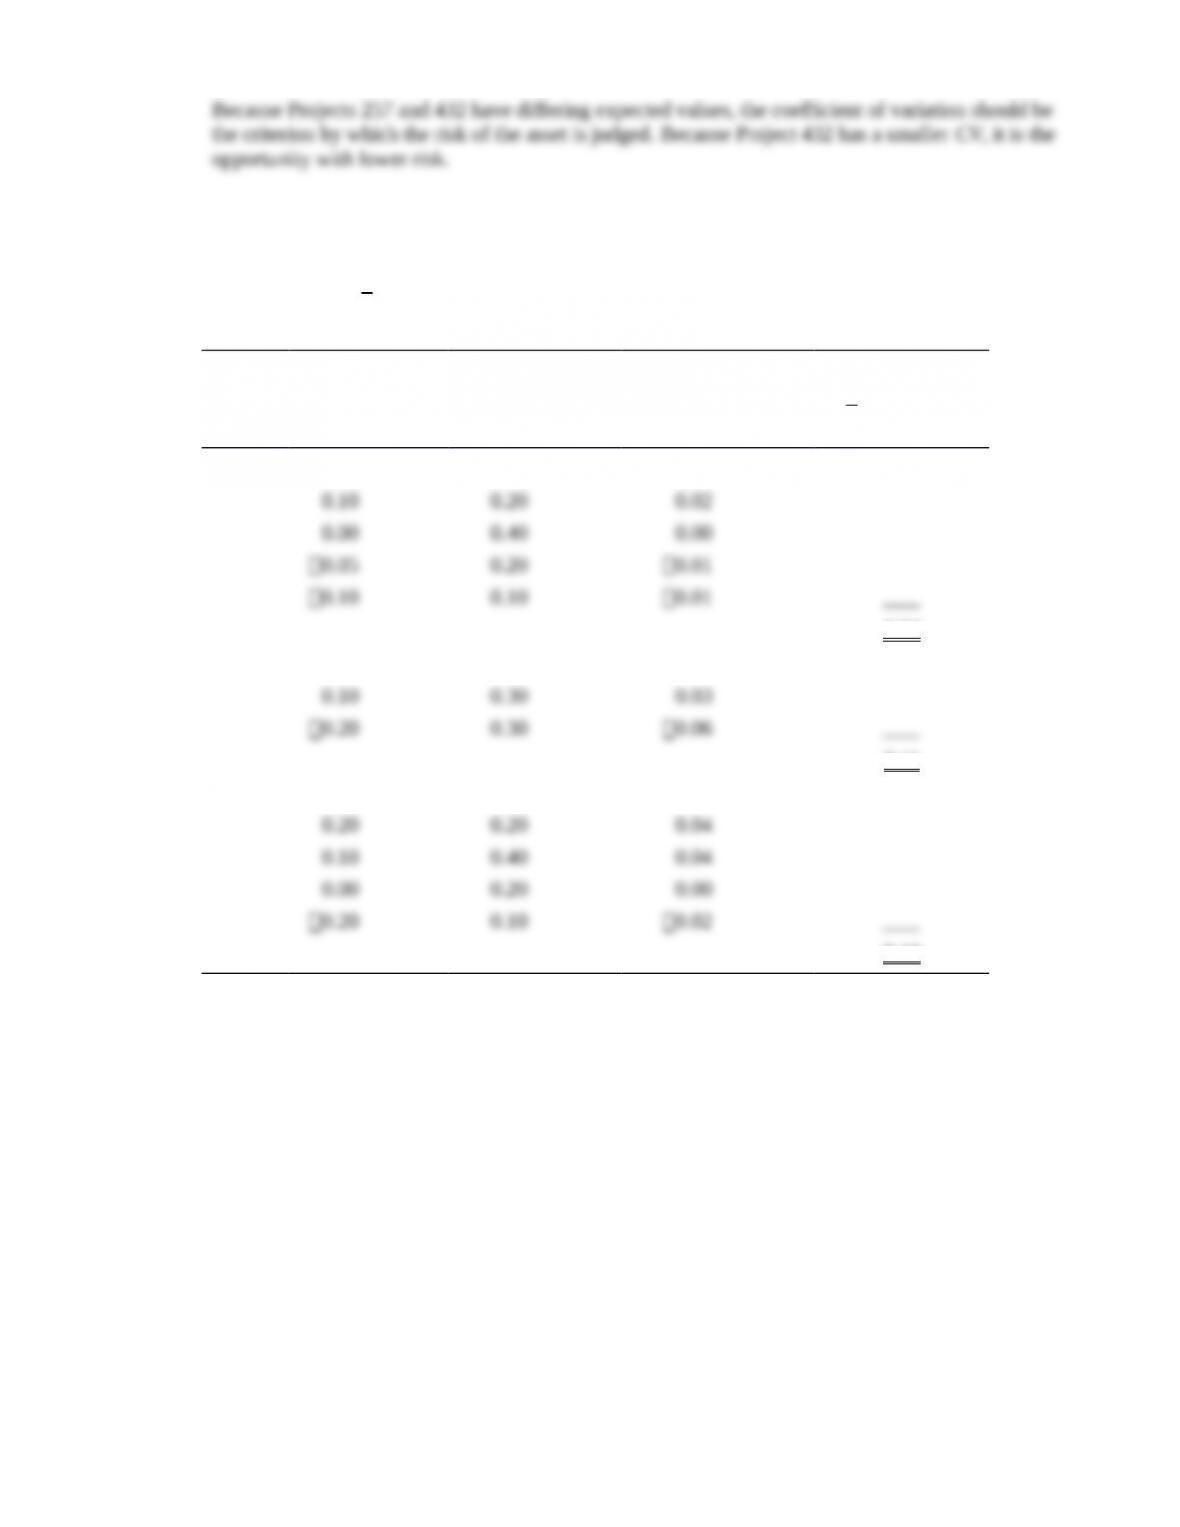
P8-11. Integrative—expected return, standard deviation, and coefficient of variation
LG 2; Challenge
a. Expected return:
1
n
i ri
i
r r P
=
= ´
å
Rate of Return
ri
Probability
Pr i
Weighted Value
riPri
Expected Return
å
1=
= ´
n
i ri
i
r r P
Asset F 0.40 0.10 0.04
0.04
Asset G 0.35 0.40 0.14
0.11
Asset H 0.40 0.10 0.04
0.10
Asset G provides the largest expected return.
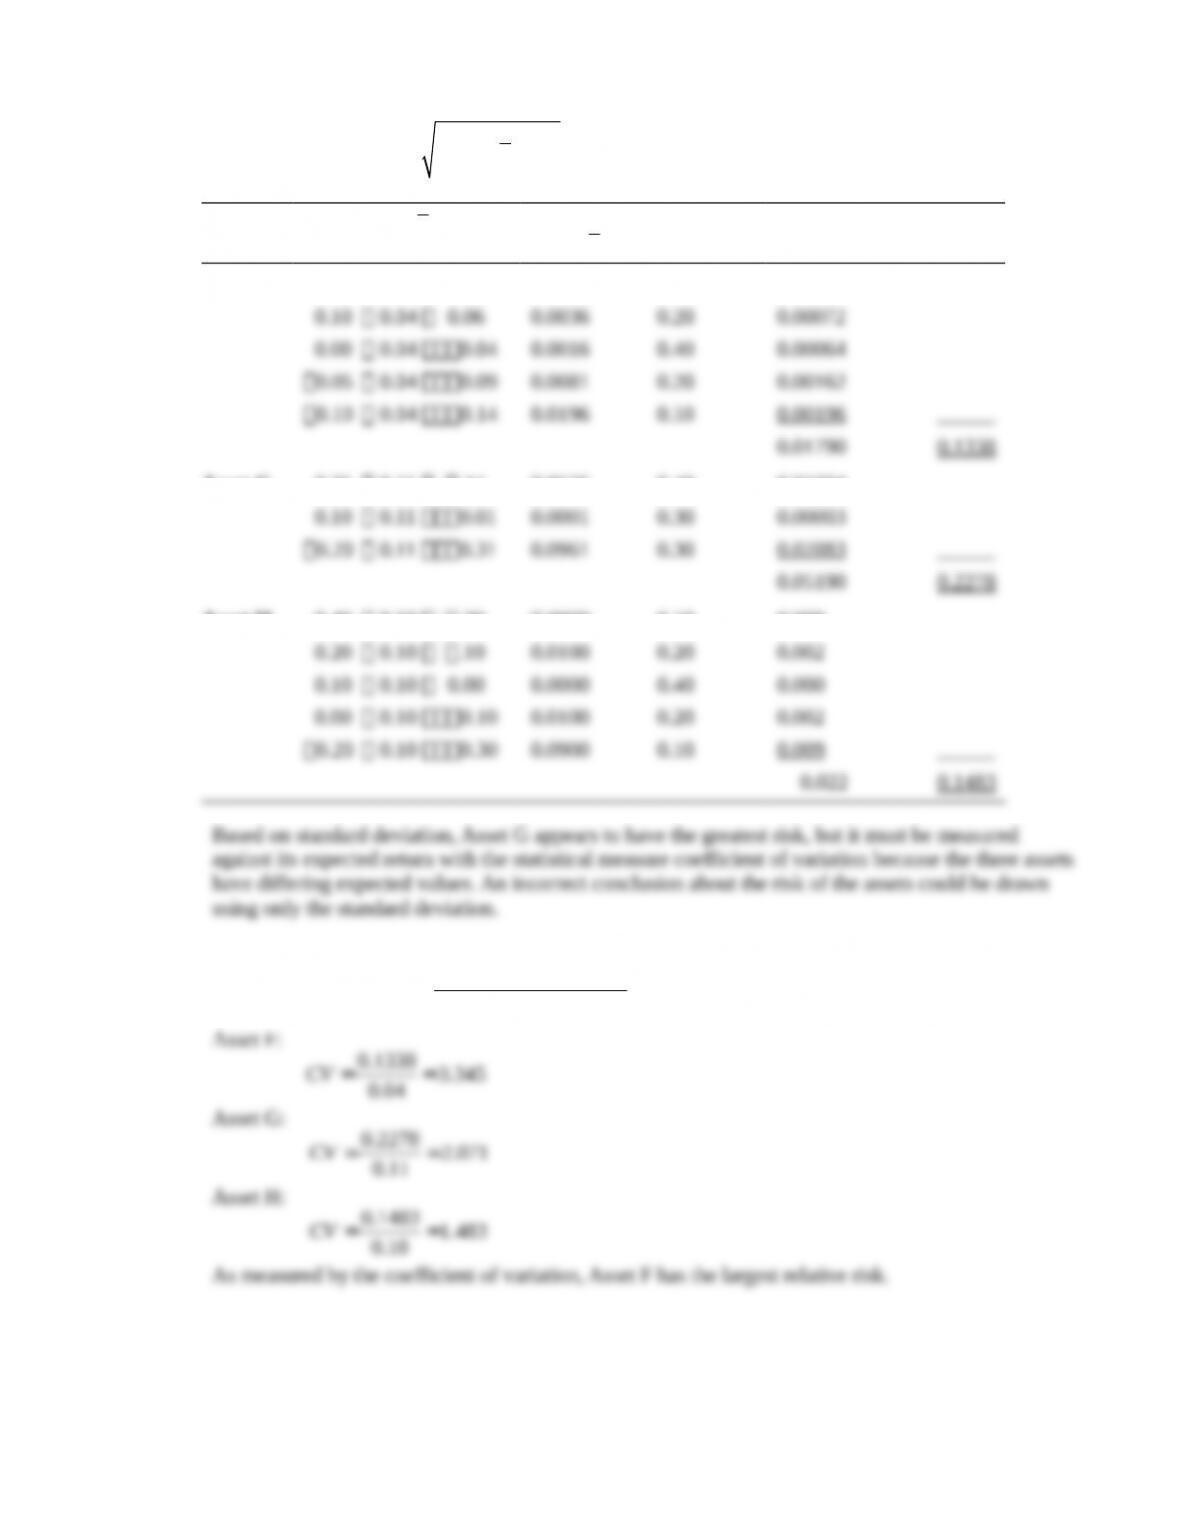
b. Standard deviation:
2
1
( )
n
i ri
i
r r xPs
=
= –
å
–
i
r r
( )–
i
r r
2Pr i 2r
Asset F 0.40 0.04 0.36 0.1296 0.10 0.01296
Asset G 0.35 0.11 .24 0.0576 0.40 0.02304
Asset H 0.40 0.10 .30 0.0900 0.10 0.009
c.
standard deviation ( )
Coefficient of variation = expected value
s
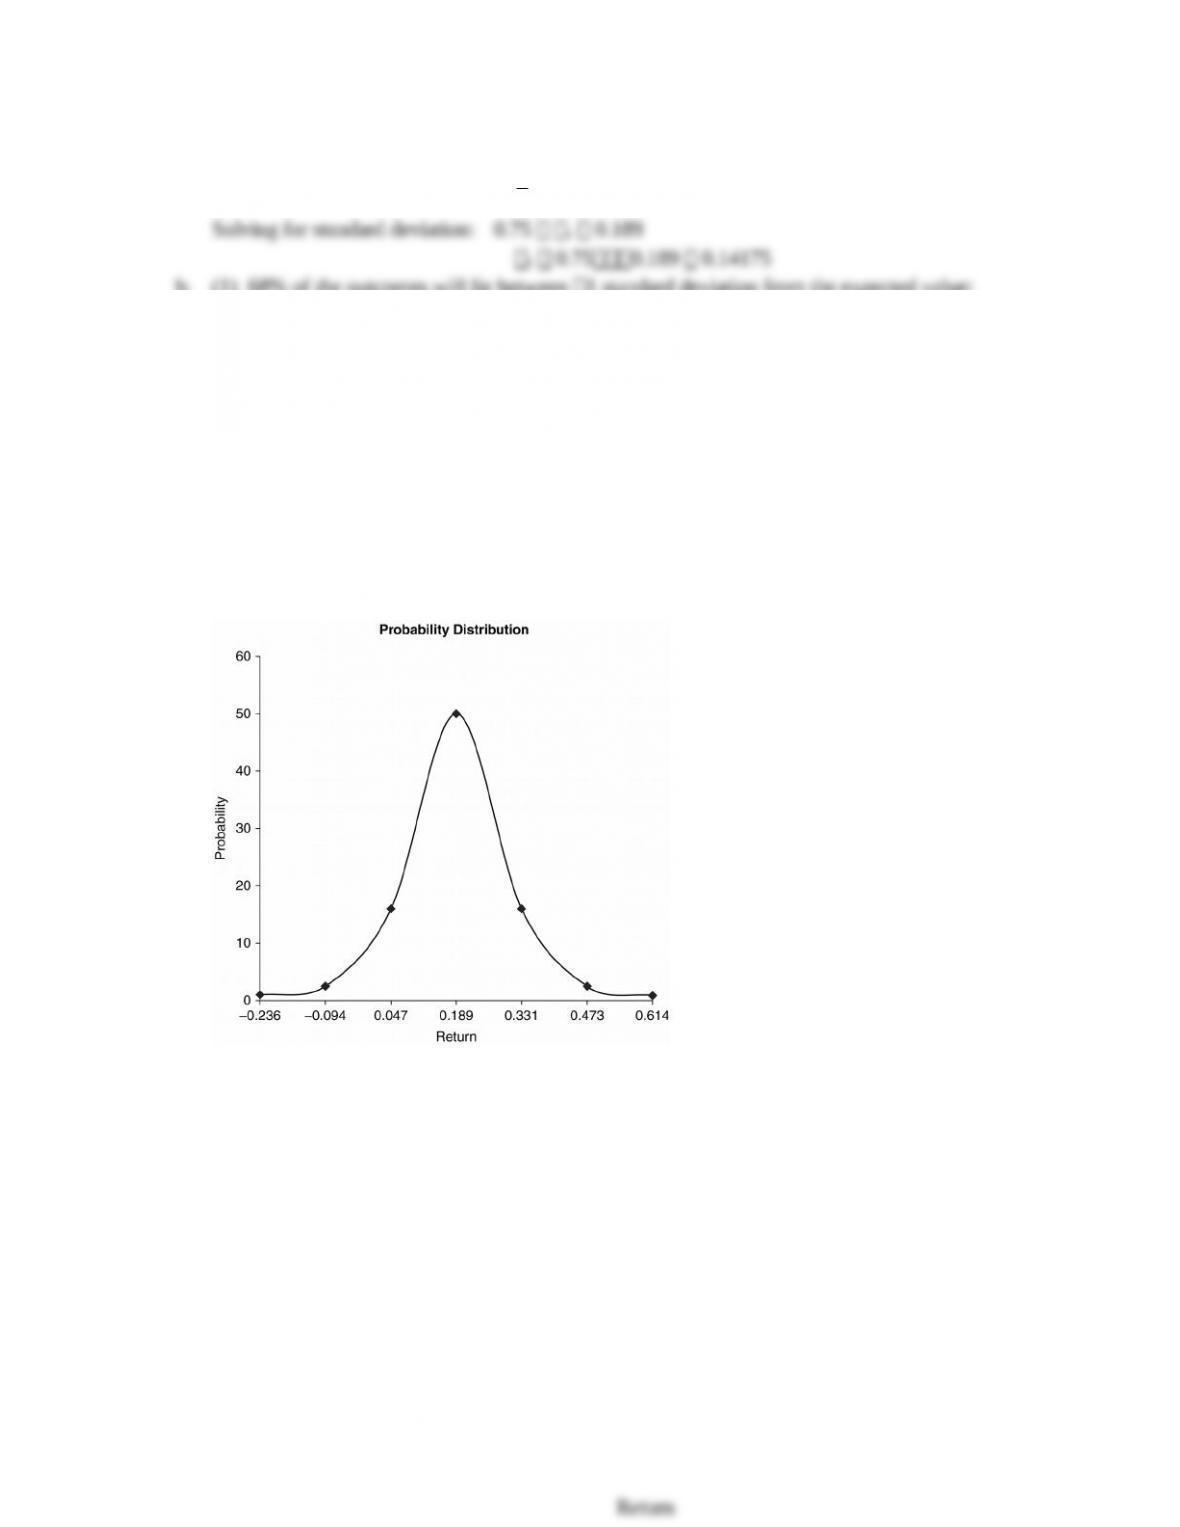
P8-12. Normal probability distribution
LG 2; Challenge
a. Coefficient of variation: CV
r
rs¸
Solving for standard deviation: 0.75 r 0.189
r 0.750.189 0.14175
b. (1) 68% of the outcomes will lie between 1 standard deviation from the expected value:
1 0.189 0.14175 0.33075
1 0.189 0.14175 0.04725
s
s
+ = + =
– = – =
(2) 95% of the outcomes will lie between 2 standard deviations from the expected value:
2 0.189 (2 0.14175) 0.4725
2 0.189 (2 0.14175) 0.0945
s
s
+ = + ´ =
– = – ´ =–
(3) 99% of the outcomes will lie between 3 standard deviations from the expected value:
3 0.189 (3 0.14175) 0.61425
3 0.189 (3 0.14175) 0.23625
s
s
+ = + ´ =
– = – ´ =–
c.
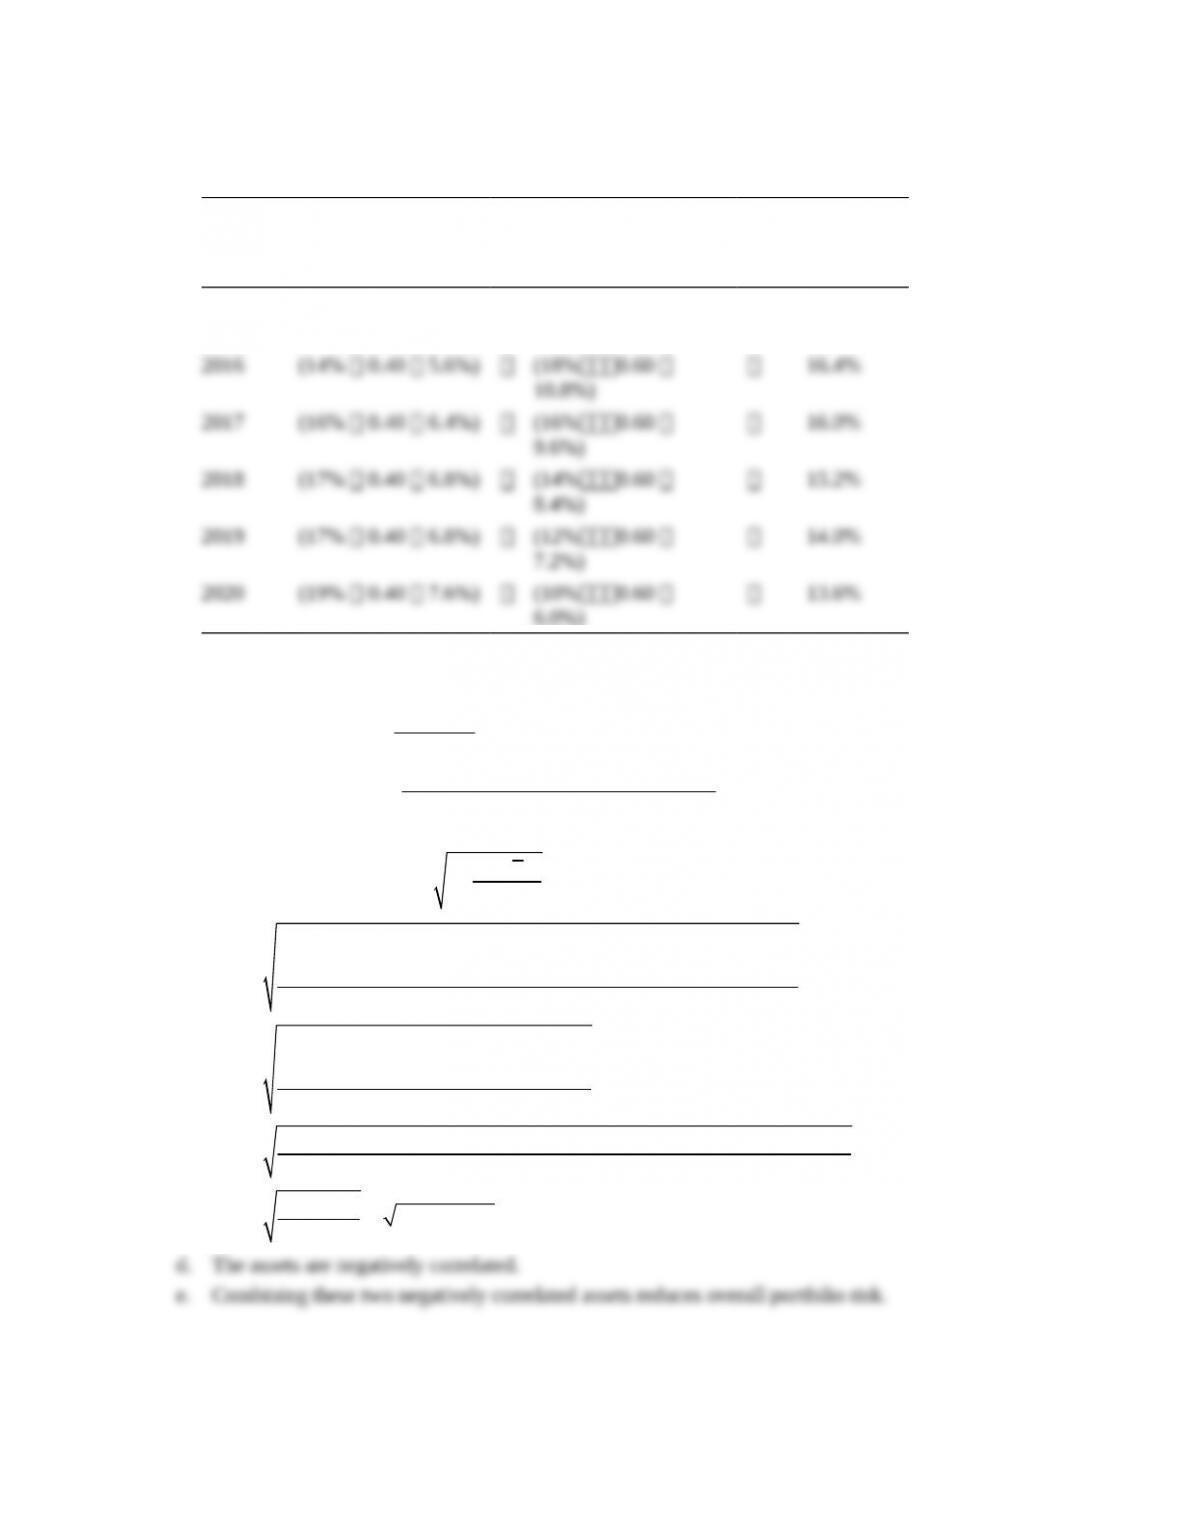
P8-13. Personal finance: Portfolio return and standard deviation
LG 3; Challenge
a. Expected portfolio return for each year: rp (wLrL) (wMrM)
Year
Asset L
(wLrL)
Asset M
(wMrM)
Expected
Portfolio Return
rp
2015 (14% 0.40 5.6%) (20%0.60
12.0%)
17.6%
6.0%)
b. Portfolio return:
1
n
j j
j
p
w r
rn
=
´
=
å
17.6 16.4 16.0 15.2 14.0 13.6 15.467 15.5%
6
p
r+ + + + +
= = =
c. Standard deviation:
2
1
( )
( 1)
n
i
rp
i
r r
n
s
=
–
=–
å
222
2 2 2
(17.6% 15.5%) (16.4% 15.5%) (16.0% 15.5%)
(15.2% 15.5%) (14.0% 15.5%) (13.6% 15.5%)
6 1
rp
s
– + – + –
é ù
ê ú
+ – + – + –
ë û
=–
2 2 2
222
(2.1%) (0.9%) (0.5%)
( 0.3%) ( 1.5%) ( 1.9%)
5
rp
s
+ +
é ù
ê ú
+ – + – + –
ë û
=
(.000441 0.000081 0.000025 0.000009 0.000225 0.000361)
5
rp
s+ + + + +
=
0.001142 0.000228% 0.0151 1.51%
5
rp
s= = = =
d. The assets are negatively correlated.
e. Combining these two negatively correlated assets reduces overall portfolio risk.
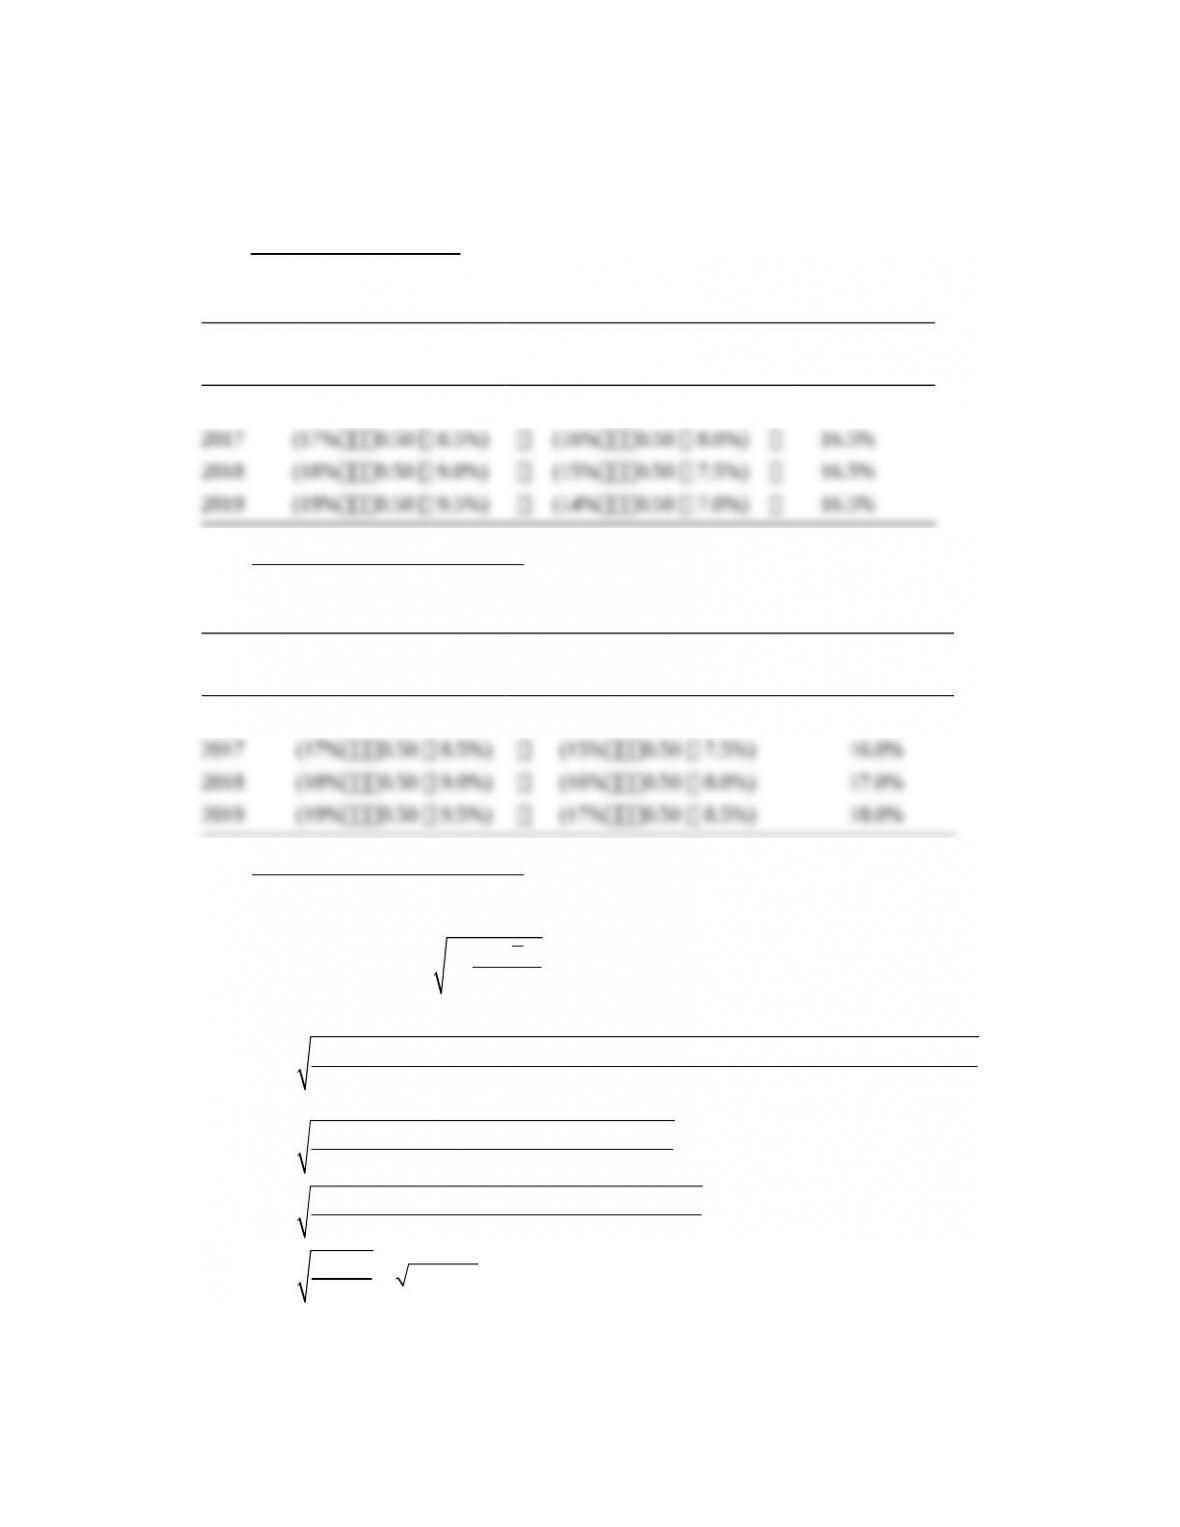
P8-14. Portfolio analysis
LG 3; Challenge
a. Expected portfolio return:
Alternative 1: 100% Asset F
16% 17% 18% 19% 17.5%
4
p
r+ + +
= =
Alternative 2: 50% Asset F 50% Asset G
Year
Asset F
(wFrF)
Asset G
(wGrG)
Portfolio Return
rp
2016 (16%0.50 8.0%) (17%0.50 8.5%) 16.5%
(2)
2 2 2 2
[(16.5% 16.5%) (16.5% 16.5%) (16.5% 16.5%) (16.5% 16.5%) ]
4 1
FG
s– + – + – + –
=–
2 2 2 2
[(0) (0) (0) (0) ]
3
FG
s+ + +
=
0
FG
s=
(3)
2 2 2 2
[(15.0% 16.5%) (16.0% 16.5%) (17.0% 16.5%) (18.0% 16.5%) ]
4 1
FH
s– + – + – + –
=–
2 2 2 2
[( 1.5%) ( 0.5%) (0.5%) (1.5%) ]
3
FH
s– + – + +
=
[(0.000225 0.000025 0.000025 0.000225)]
3
FH
s+ + +
=
0.0005 0.000167 0.012910 1.291%
3
FH
s= = = =
c. Coefficient of variation: CV
r
rs¸
1.291% 0.0738
17.5%
F
CV = =
00
16.5%
FG
CV = =
1.291% 0.0782
16.5%
FH
CV = =
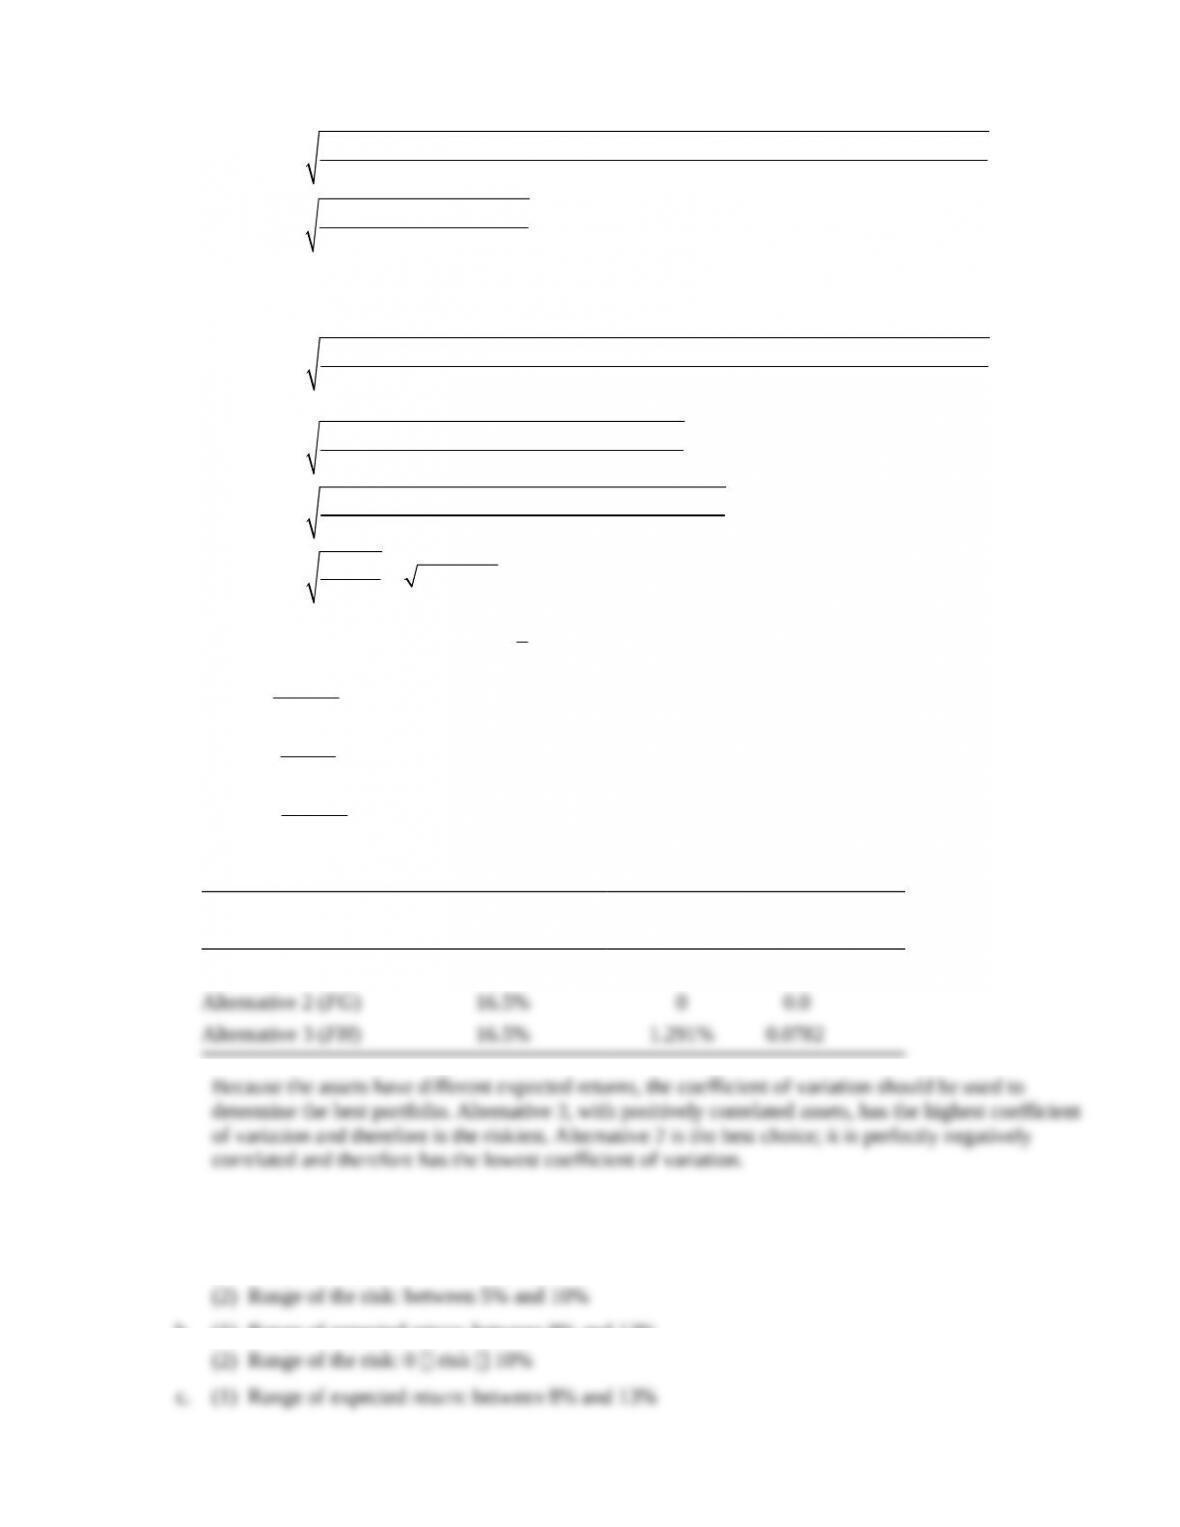
d. Summary:
rp: Expected Value
of Portfolio rp CVp
Alternative 1 (F) 17.5% 1.291% 0.0738
P8-15. Correlation, risk, and return
LG 4; Intermediate
a. (1) Range of expected return: between 8% and 13%
b. (1) Range of expected return: between 8% and 13%
P8-16. Personal finance: International investment returns
LG 1, 4; Intermediate
a. Returnpesos
24,750 20,500 4,250 0.20732 20.73%
20,500 20,500
–= = =
b.
Price in pesos 20.50
Purchase price= $2.22584 1,000 shares $2,225.84
Pesos per dollar 9.21
= = ´ =
Price in pesos 24.75
Sales price= $2.51269 1,000 shares $2,512.69
Pesos per dollar 9.85
= = ´ =
c. Returnus$
2,512.69 2,225.84 286.85 0.12887 12.89%
2,225.84 2,225.84
–= = =
d. The two returns differ due to the change in the exchange rate between the peso and the dollar. The
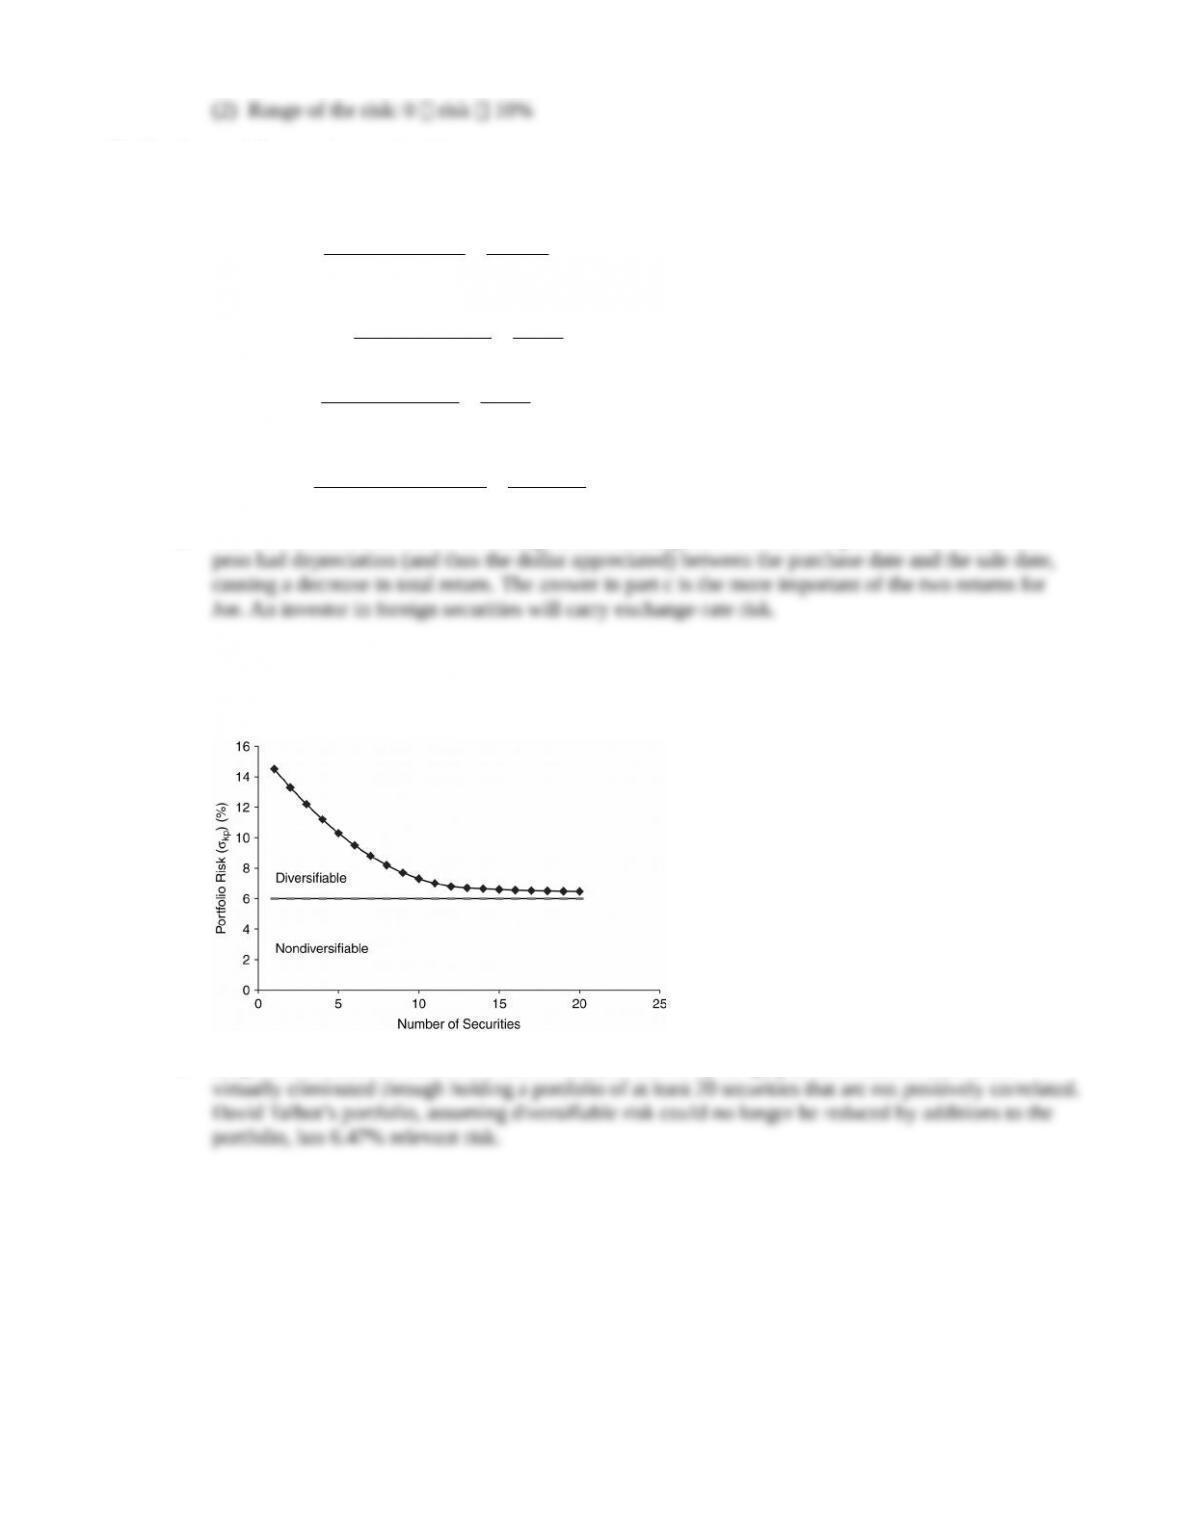
P8-17. Total, nondiversifiable, and diversifiable risk
LG 5; Intermediate
a. and b.
c. Only nondiversifiable risk is relevant because, as shown by the graph, diversifiable risk can be
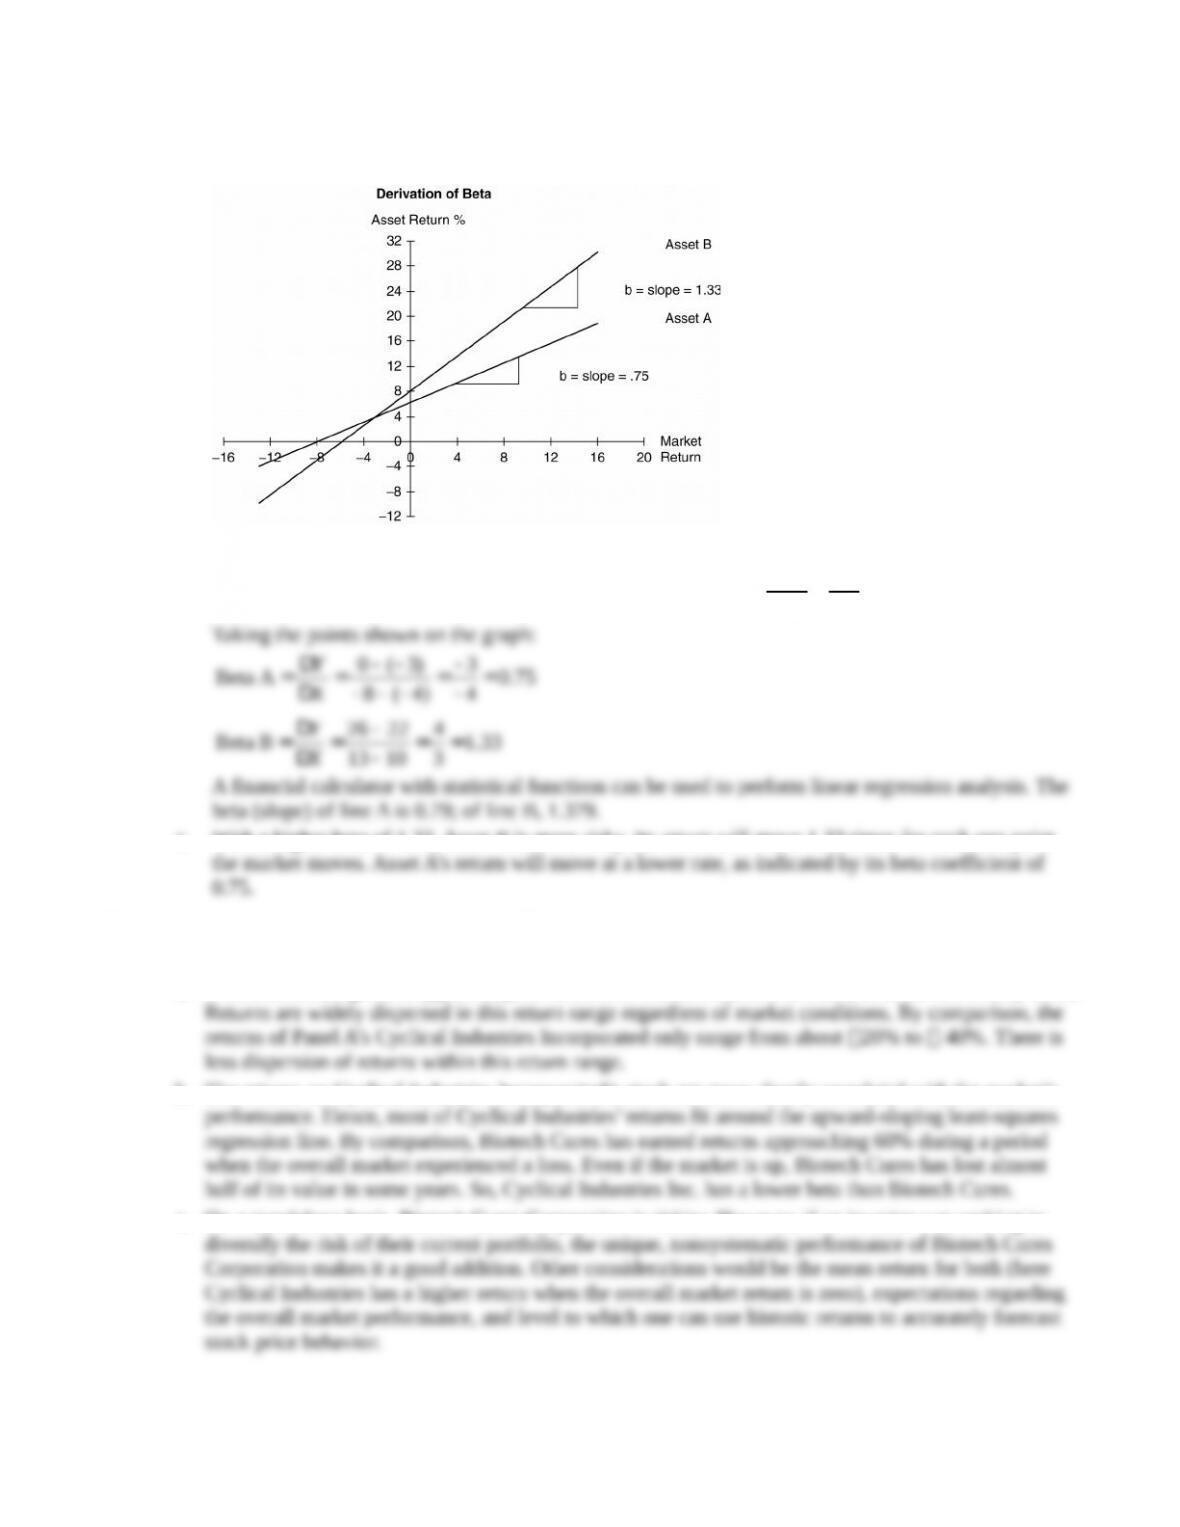
P8-18. Graphic derivation of beta
LG 5; Intermediate
a.
b. To estimate beta, the “rise over run” method can be used:
Rise
Beta Run
Y
X
D
= =D
c. With a higher beta of 1.33, Asset B is more risky. Its return will move 1.33 times for each one point
P8-19. Graphical derivation and interpretation of beta
LG 5; Intermediate
a. With a return range from 0% to 30%, Biotech Cures, exhibited in Panel B, is the more risky stock.
b. The returns on Cyclical Industries Incorporated’s stock are more closely correlated with the market’s
c. On a standalone basis, Biotech Cures Corporation is riskier. However, if an investor was seeking to