P3-20. Common-size statement analysis
LG 5; Intermediate
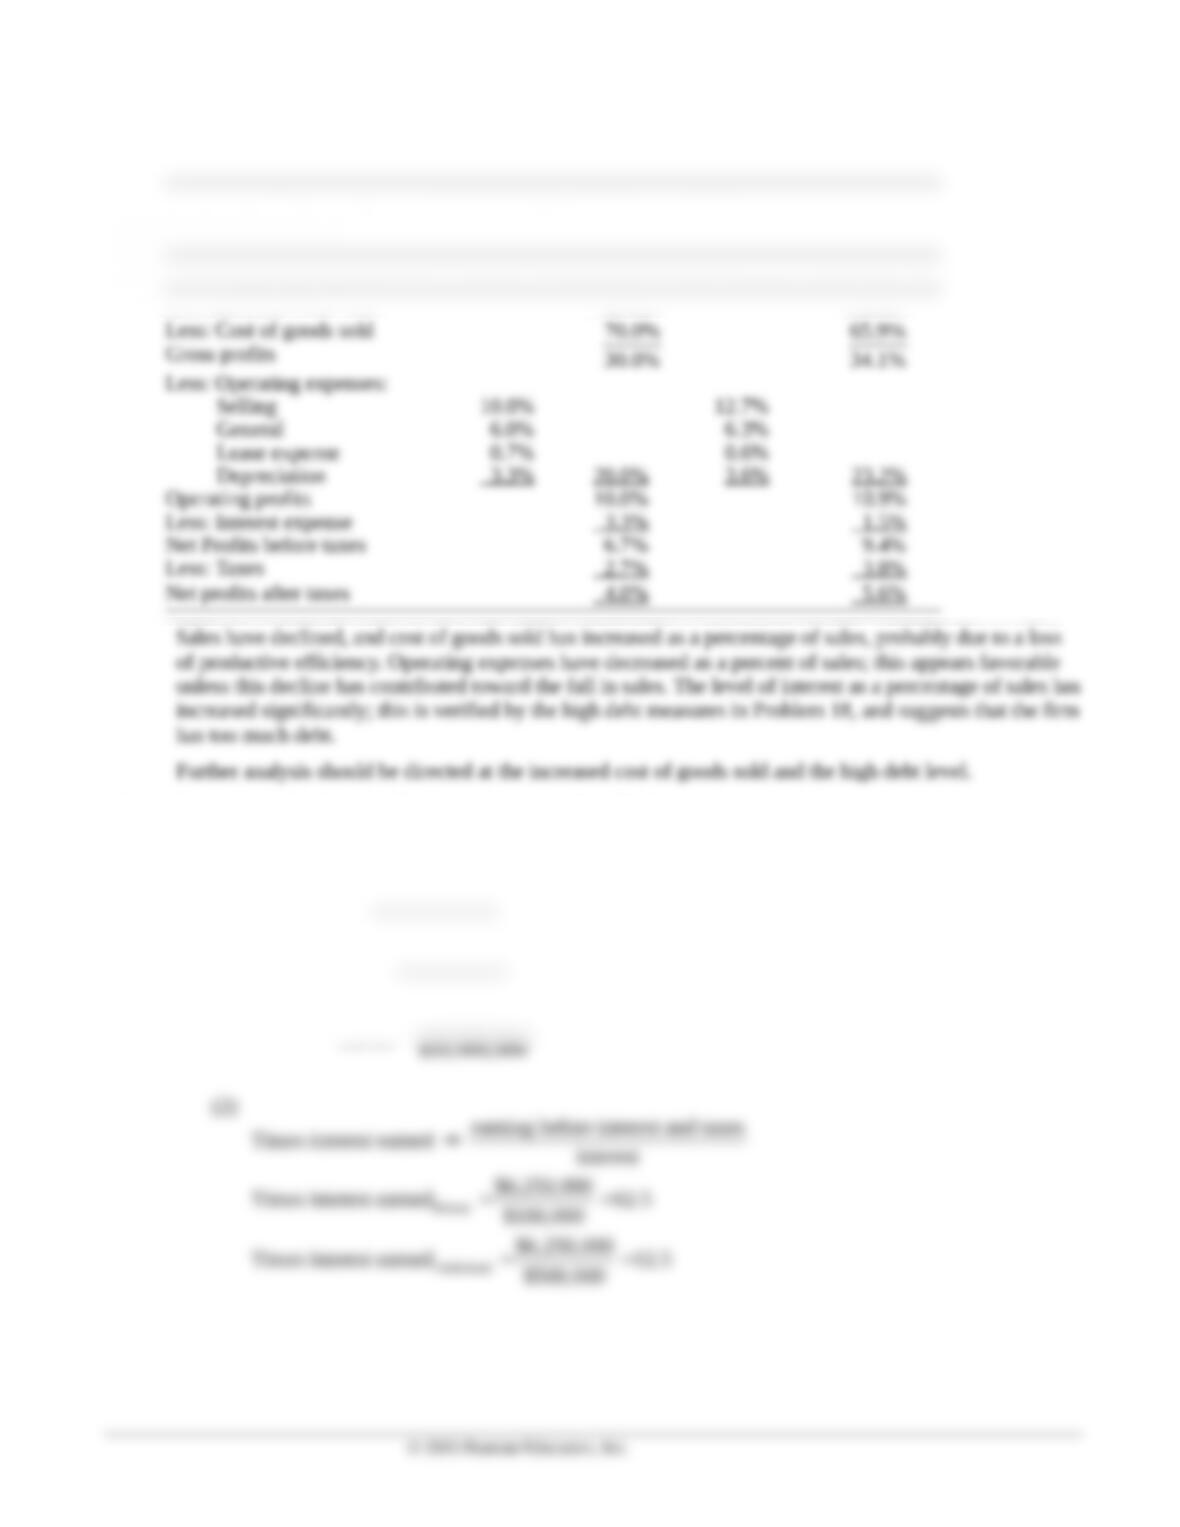
Creek Enterprises
Common-Size Income Statement
for the Years Ended December 31, 2014 and 2015
2015 2014
Sales revenue 100.0% 100.0%
P3-21. The relationship between financial leverage and profitability
LG 4, 5; Challenge
a. (1)
total liabilities
Debt ratio total assets
=
Pelican
Timberland
$1,000,000
Debt ratio 0.10 10%
$10,000,000
$5,000,000
Debt ratio 0.50 50%
$10,000,000
= = =
= = =
(2)
earning before interest and taxes
Times interest earned interest
=
Pelican
Timberland
$6,250,000
Times interest earned 62.5
$100,000
$6,250,000
Times interest earned 12.5
$500,000
= =
= =
© 2015 Pearson Education, Inc.
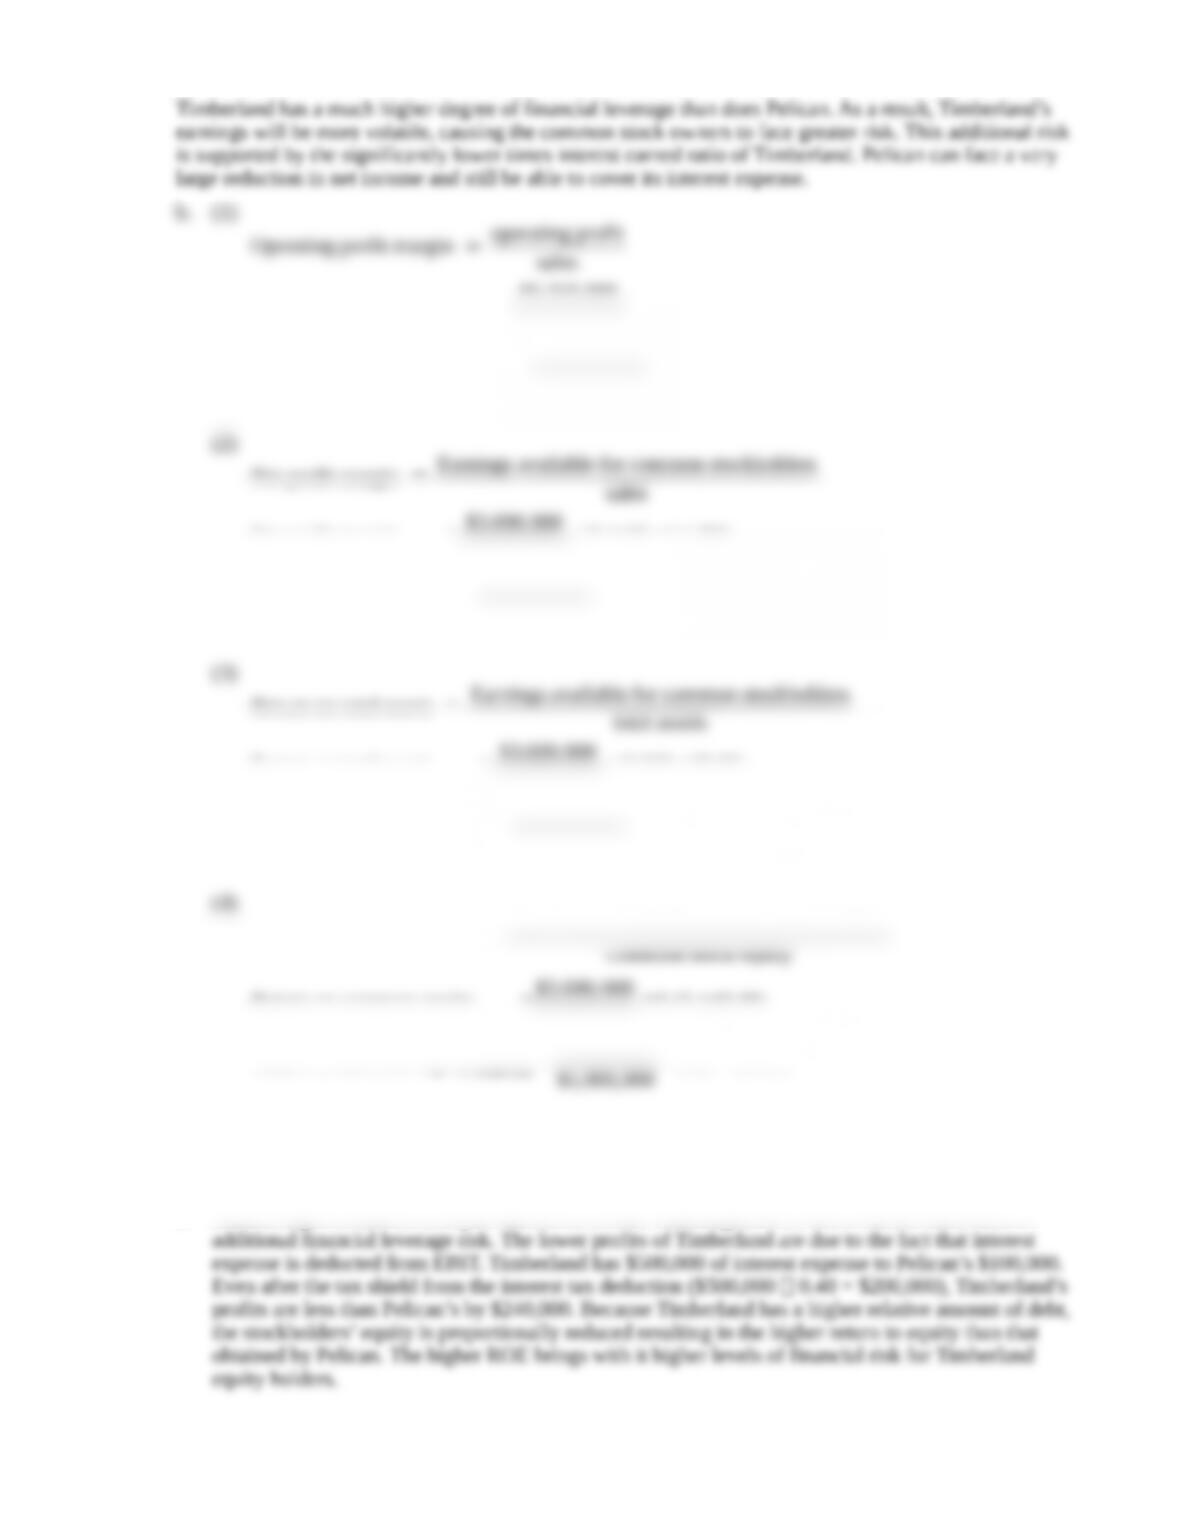
b. (1)
operating profit
Operating profit margin sales
=
Pelican
Timberland
$6,250,000
Operating profit margin 0.25 25%
$25,000,000
$6,250,000
Operating profit margin 0.25 25%
$25,000,000
= = =
= = =
(2)
Earnings available for common stockholders
Net profit margin sales
=
Pelican
Timberland
$3,690,000
Net profit margin 0.1476 14.76%
$25,000,000
$3,450,000
Net profit margin 0.138 13.80%
$25,000,000
= = =
= = =
(3)
Earnings available for common stockholders
Return on total assets total assets
=
Pelican
Timberland
$3,690,000
Return on total assets 0.369 36.9%
$10,000,000
$3,450,000
Return on total assets 0.345 34.5%
$10,000,000
= = =
= = =
(4)
Earnings available for common stockholders
Return on common equity Common stock equity
=
Pelican
Timberland
$3,690,000
Return on common equity 0.41 41.0%
$9,000,000
$3,450,000
Return on common equity 0.69 69.0%
$5,000,000
= = =
= = =
Pelican is more profitable than Timberland, as shown by the higher operating profit margin, net profit
margin, and return on assets. However, the return on common equity for Timberland is higher than
that of Pelican.
c. Even though Pelican is more profitable, Timberland has a higher ROE than Pelican due to the
P3-22. Ratio proficiency
LG 6; Basic
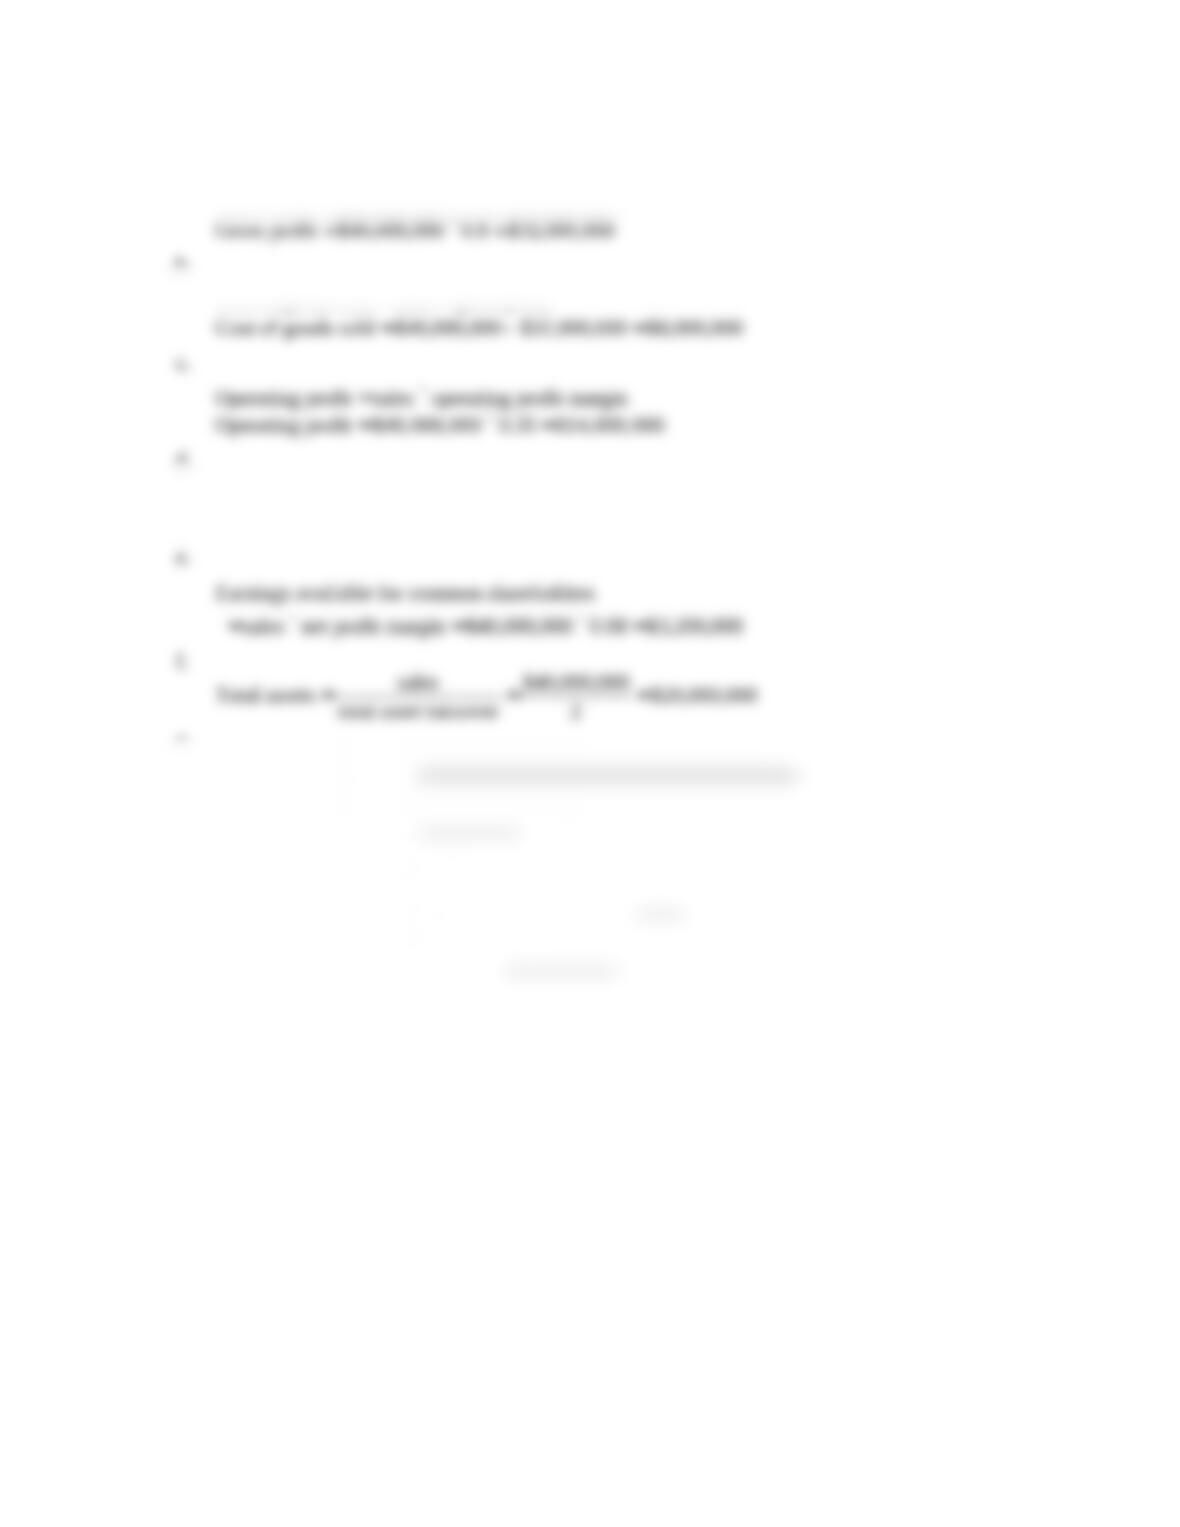
a.
Gross profit sales gross profit margin
Gross profit $40,000,000 0.8 $32,000,000
= ´
= ´ =
b.
Cost of goods sold sales gross profit
Cost of goods sold $40,000,000 $32,000,000 $8,000,000
= –
= – =
c.
Operating profit sales operating profit margin
Operating profit $40,000,000 0.35 $14,000,000
= ´
= ´ =
d.
Operating expenses gross profit operating profit
Operating expenses $32,000,000 $14,000,000 $18,000,000
= –
= – =
e.
Earnings available for common shareholders
sales net profit margin $40,000,000 0.08 $3,200,000= ´ = ´ =
f.
sales $40,000,000
Total assets $20,000,000
total asset turnover 2
= = =
g.
earnings available for common shareholders
Total common equity
ROE
$3,200,000
Total common equity $16,000,000
0.20
=
= =
h.
sales
Accounts receivable average collection period
365
$40,000,000
Accounts receivable 62.2 days 62.2 $109,589.041 $6,816,438.36
365
= ´
= ´ = ´ =
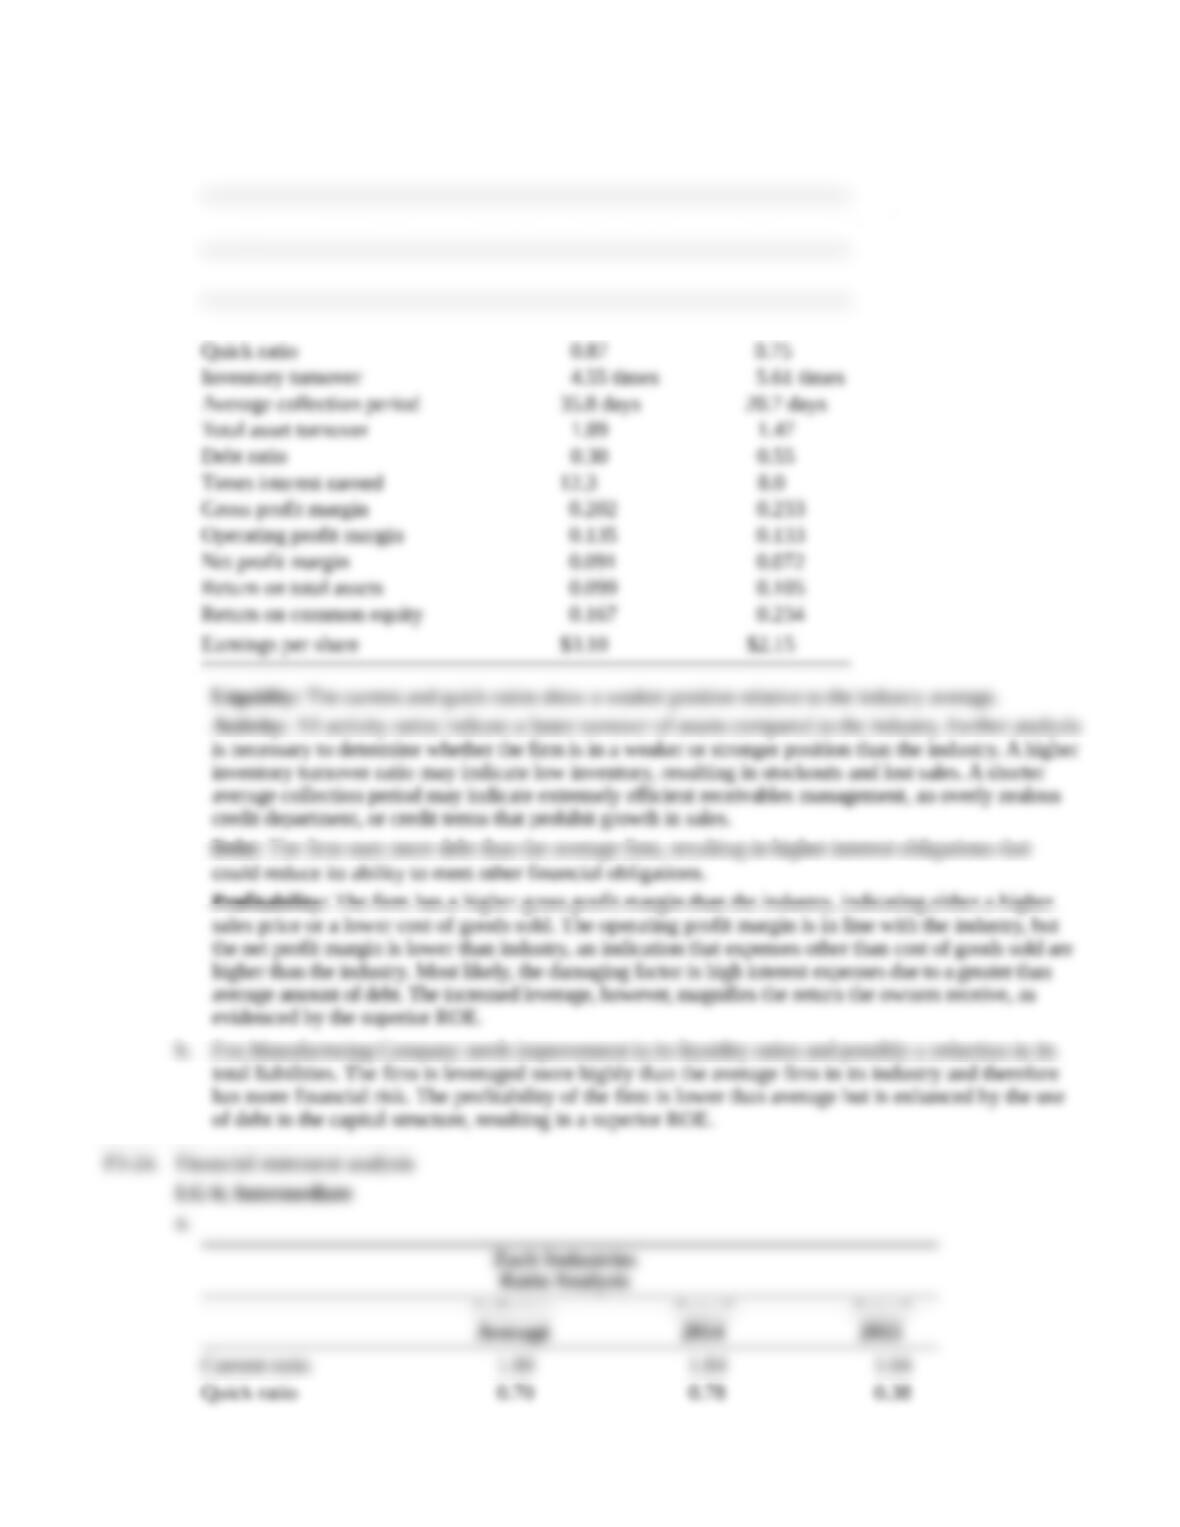
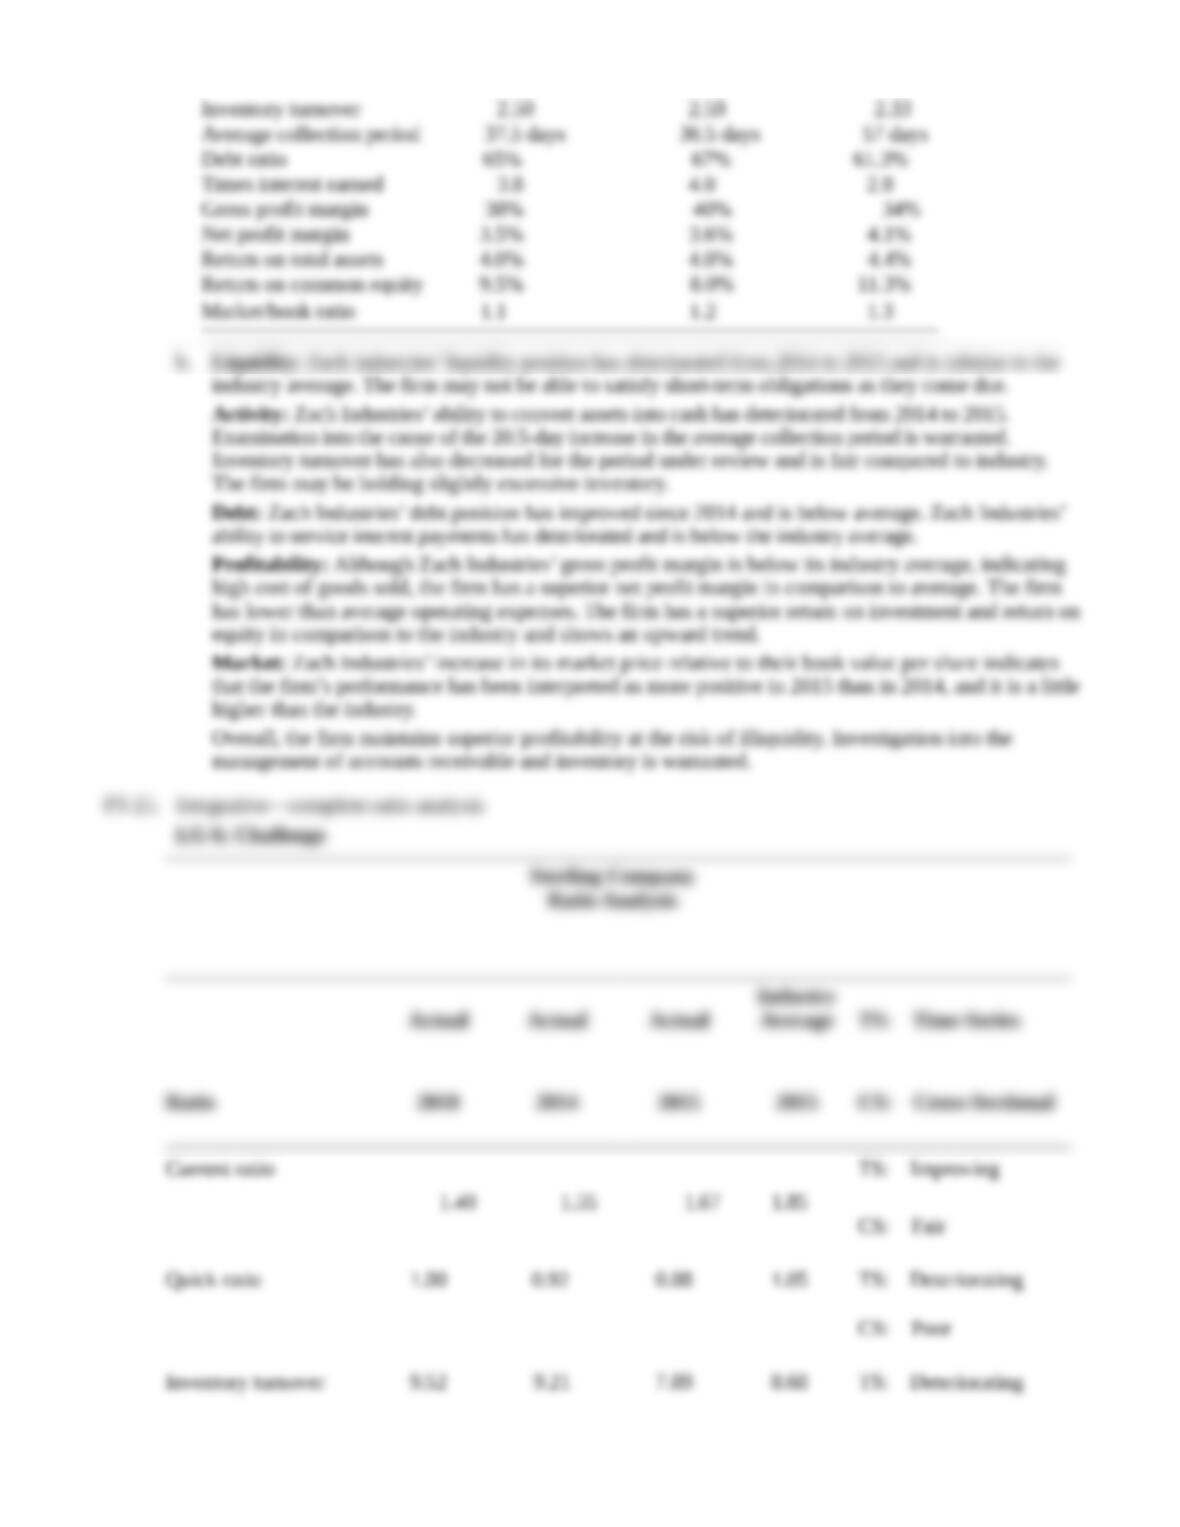
Liquidity: The current and quick ratios show a weaker position relative to the industry average.
Activity: All activity ratios indicate a faster turnover of assets compared to the industry. Further analysis
Debt: The firm uses more debt than the average firm, resulting in higher interest obligations that
Profitability: The firm has a higher gross profit margin than the industry, indicating either a higher
b. Fox Manufacturing Company needs improvement in its liquidity ratios and possibly a reduction in its
P3-24. Financial statement analysis
LG 6; Intermediate
a.
Zach Industries
Ratio Analysis
Industry
Average
Actual
2014
Actual
2015
Current ratio 1.80 1.84 1.04
b. Liquidity: Zach Industries’ liquidity position has deteriorated from 2014 to 2015 and is inferior to the
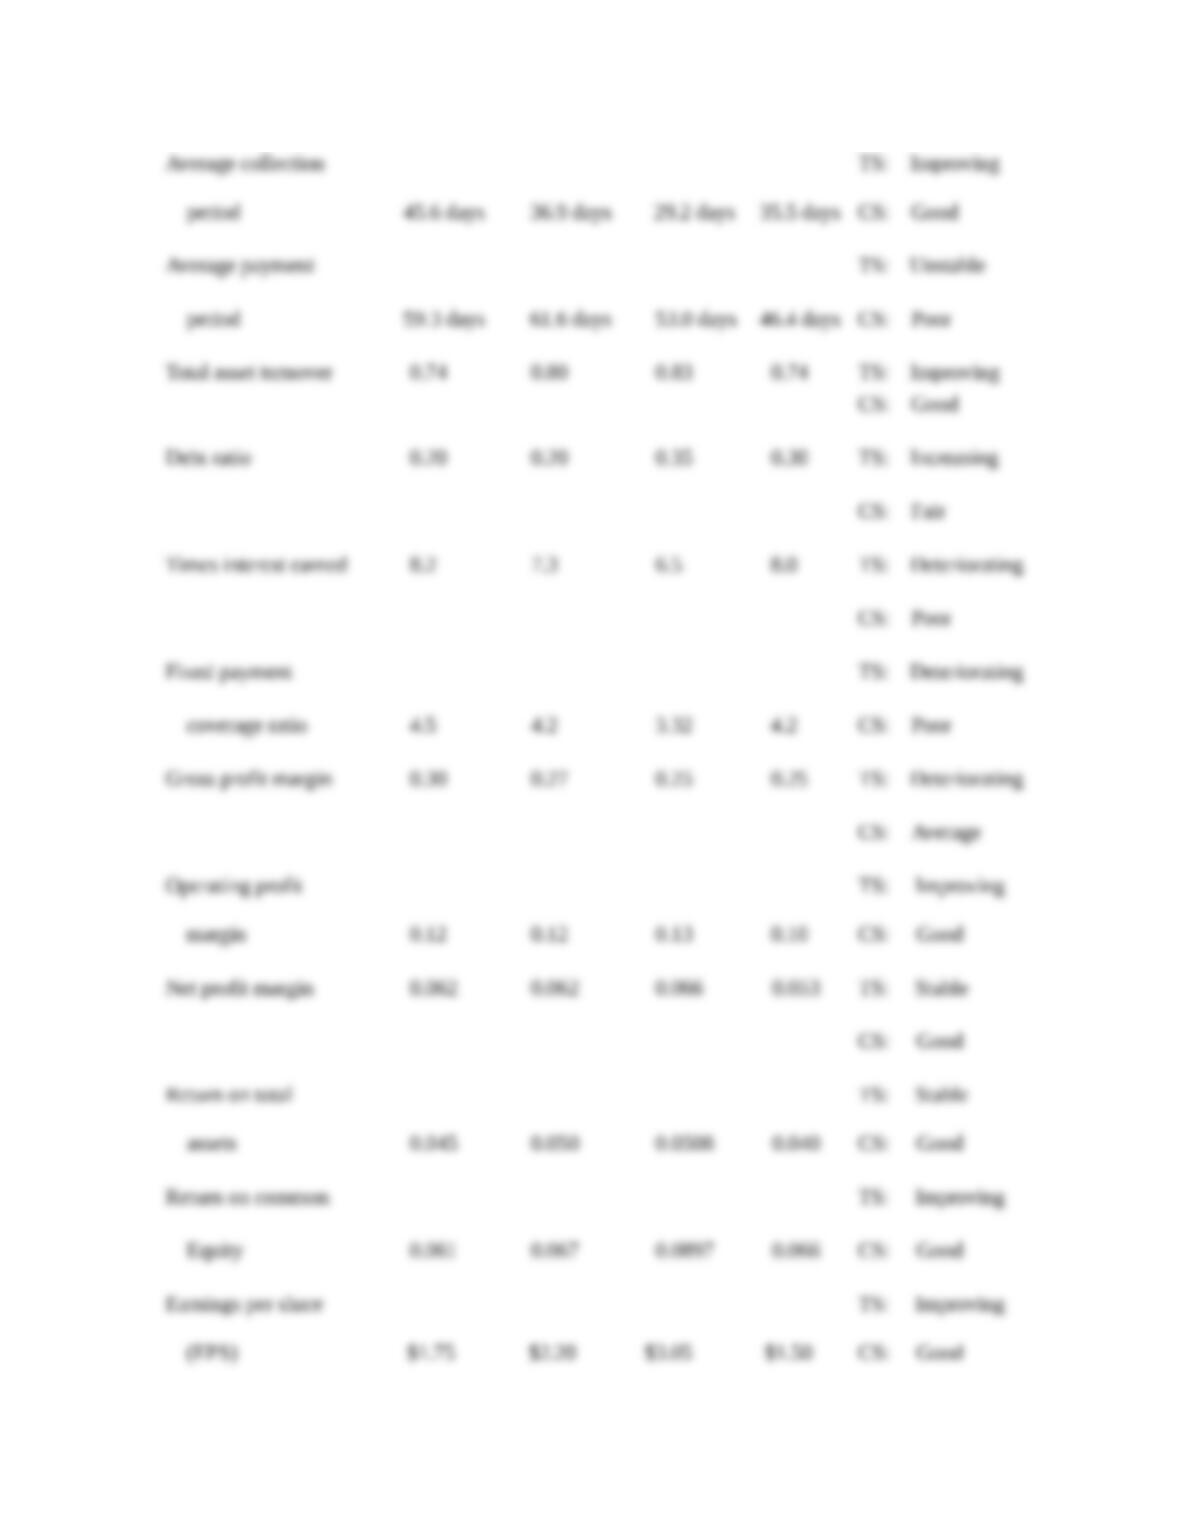
P3-25. Integrative—complete ratio analysis
LG 6; Challenge
Sterling Company
Ratio Analysis
Actual Actual Actual
Industry
Average TS: Time-Series
Ratio 2010 2014 2015 2015 CS: Cross-Sectional
CS: Fair
Equity 0.061 0.067 0.0897 0.066 CS: Good
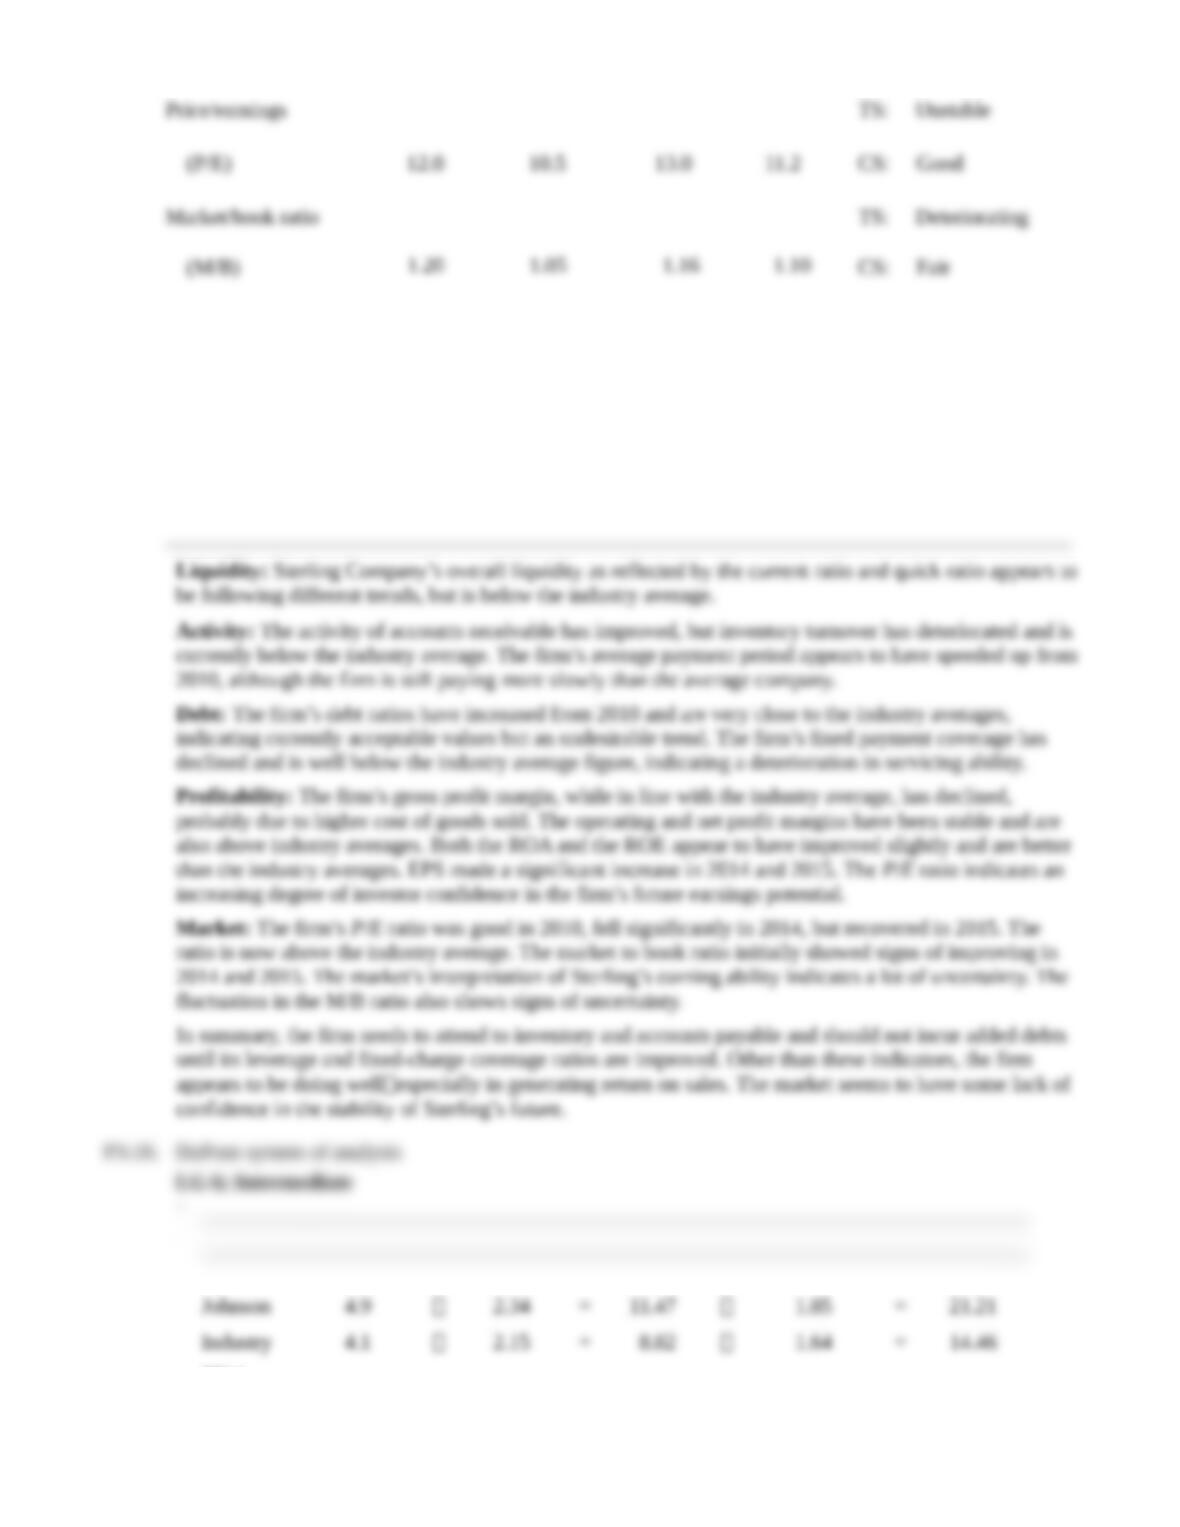
P3-26. DuPont system of analysis
LG 6; Intermediate
a.
Margin(%) Turnover = ROA(%) FL Multiple = ROE(%)
2015
2014
2013
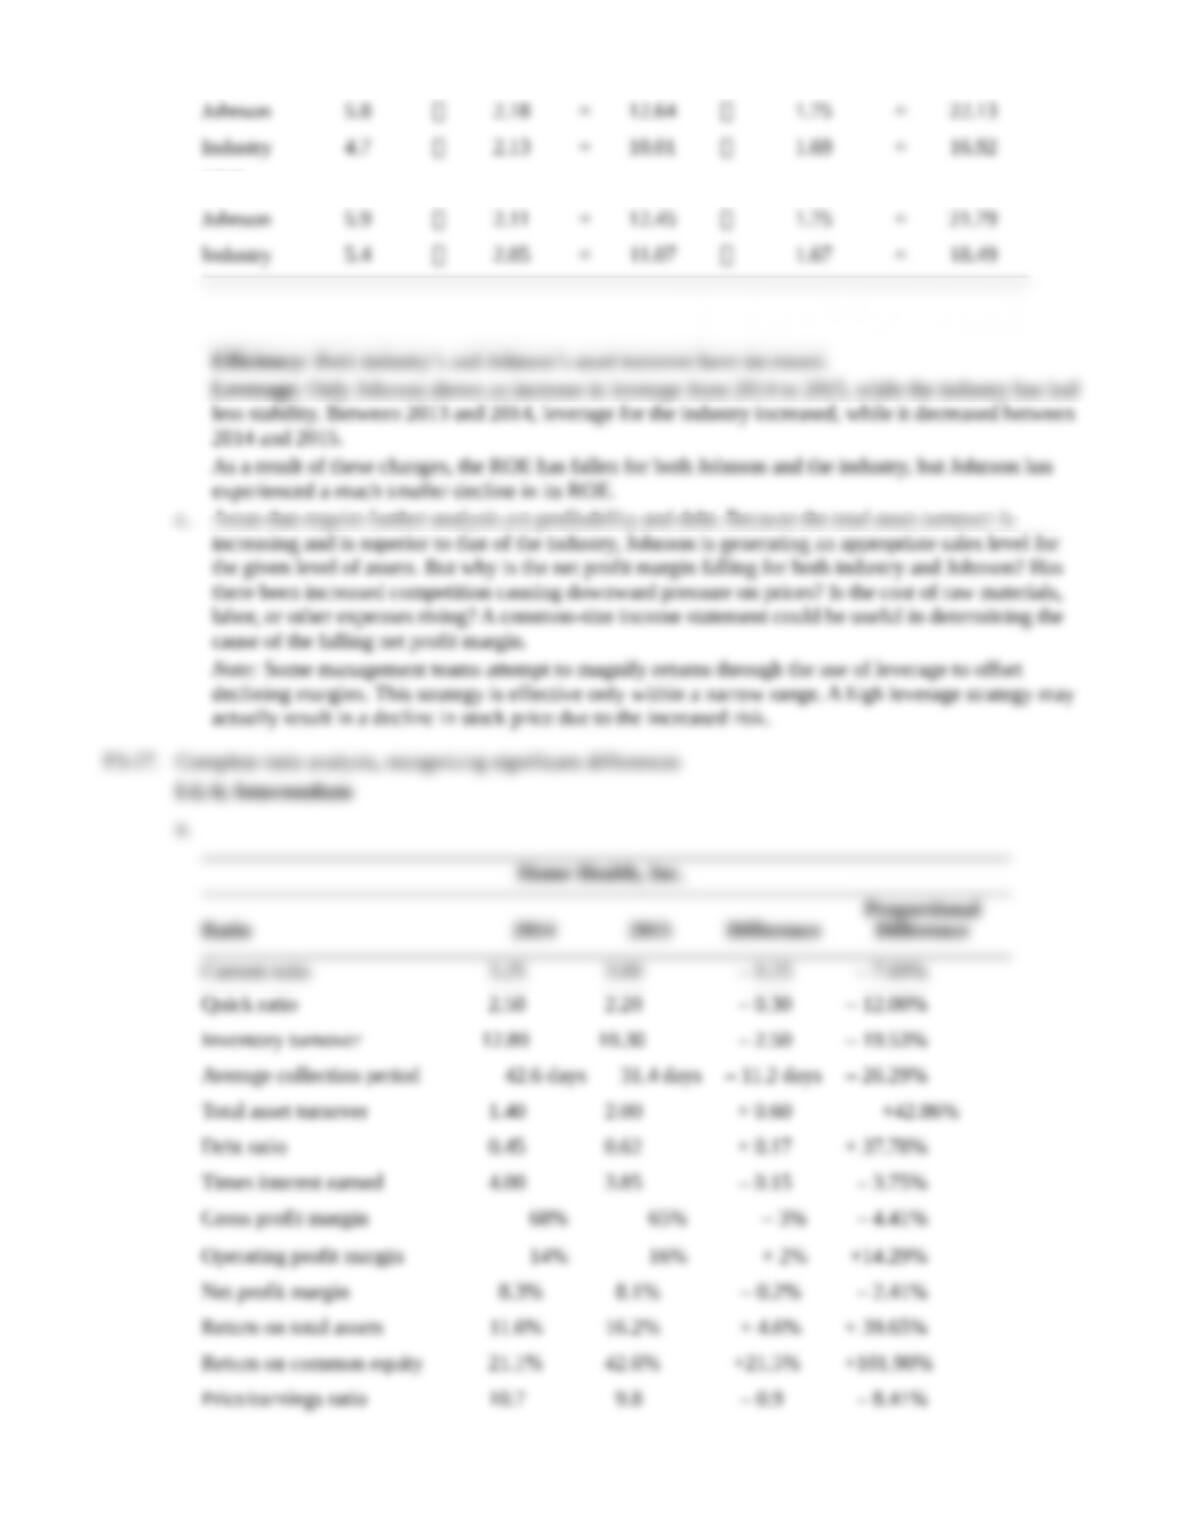
b. Profitability: Industry net profit margins are decreasing; Johnson’s net profit margins have fallen
less.
Efficiency: Both industry’s and Johnson’s asset turnover have increased.
Leverage: Only Johnson shows an increase in leverage from 2014 to 2015, while the industry has had
c. Areas that require further analysis are profitability and debt. Because the total asset turnover is
P3-27. Complete ratio analysis, recognizing significant differences
LG 6; Intermediate
a.
Home Health, Inc.
Ratio 2014 2015 Difference
Proportional
Difference
Current ratio 3.25 3.00 – 0.25 – 7.69%
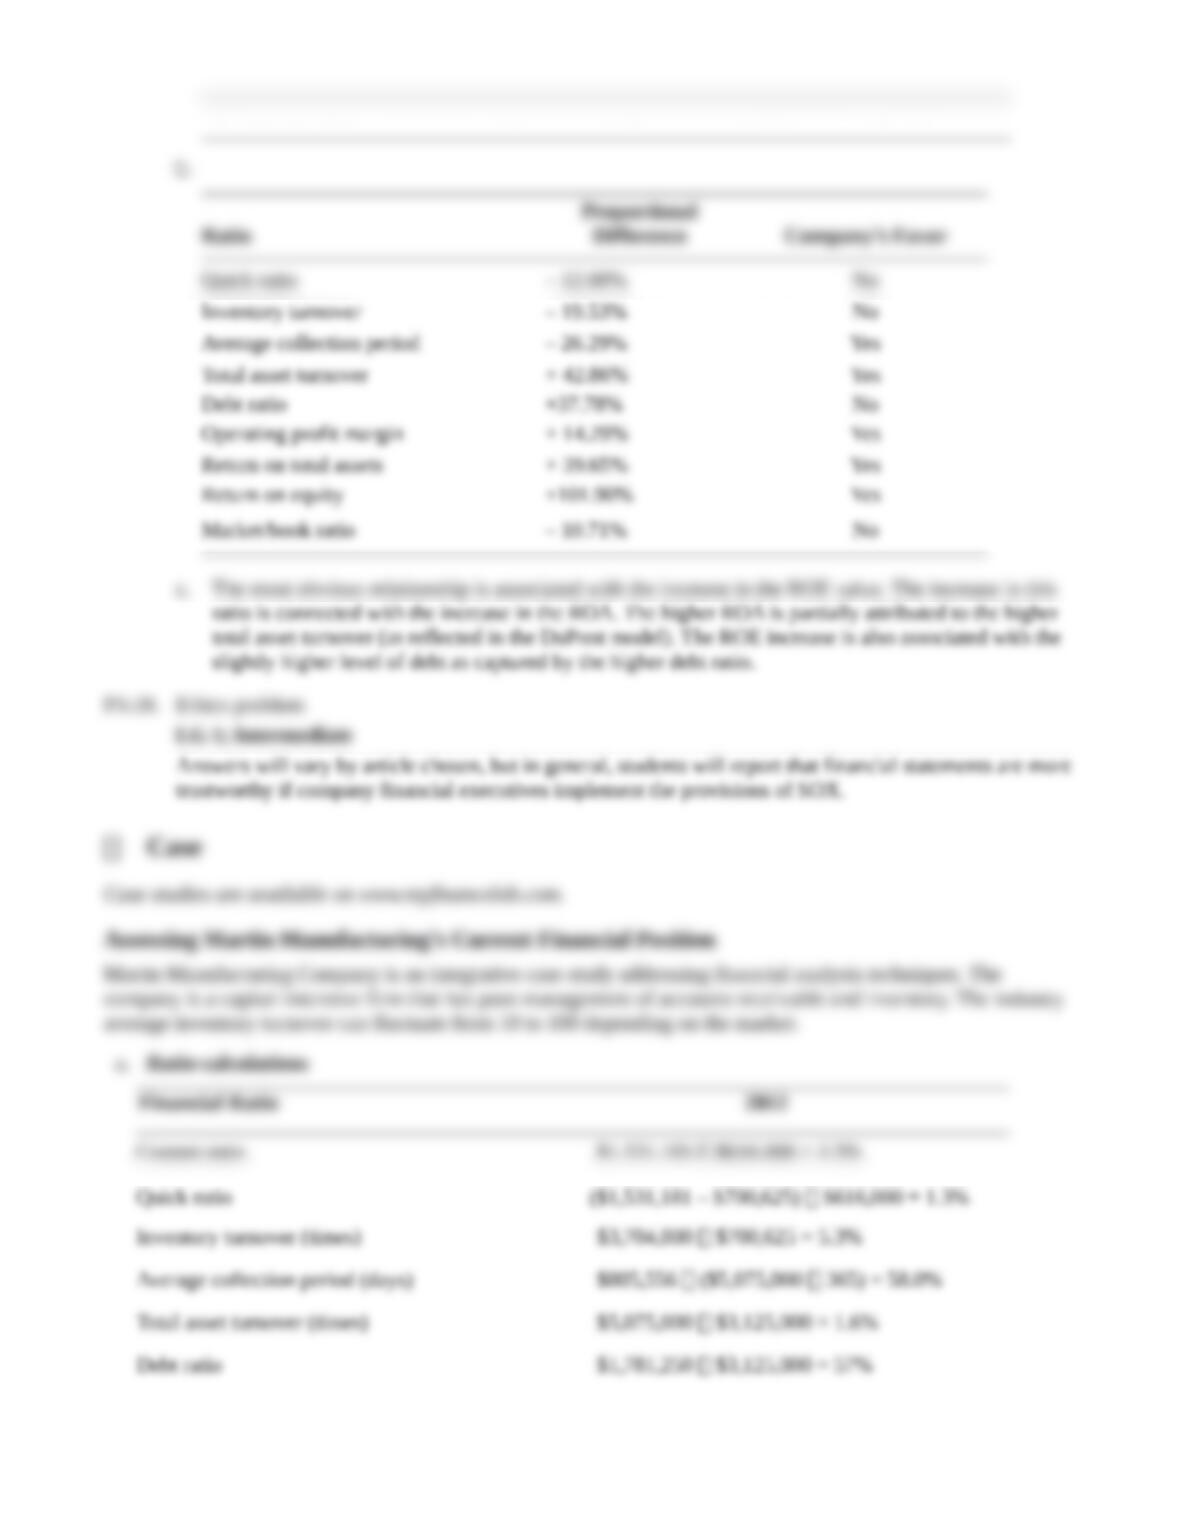
Market/book ratio 1.40 1.25 – 0.15 – 10.71%
b.
Ratio
Proportional
Difference Company’s Favor
Quick ratio – 12.00% No
c. The most obvious relationship is associated with the increase in the ROE value. The increase in this
P3-28. Ethics problem
LG 1; Intermediate
Case
Case studies are available on www.myfinancelab.com.
Assessing Martin Manufacturing’s Current Financial Position
Martin Manufacturing Company is an integrative case study addressing financial analysis techniques. The
company is a capital-intensive firm that has poor management of accounts receivable and inventory. The industry
average inventory turnover can fluctuate from 10 to 100 depending on the market.
a. Ratio calculations
Financial Ratio 2012
Current ratio $1,531,181 $616,000 = 2.5%
Times interest earned $153,000 $93,000 = 1.6%
Return on total assets $36,000 $3,125,000 = 1.2%
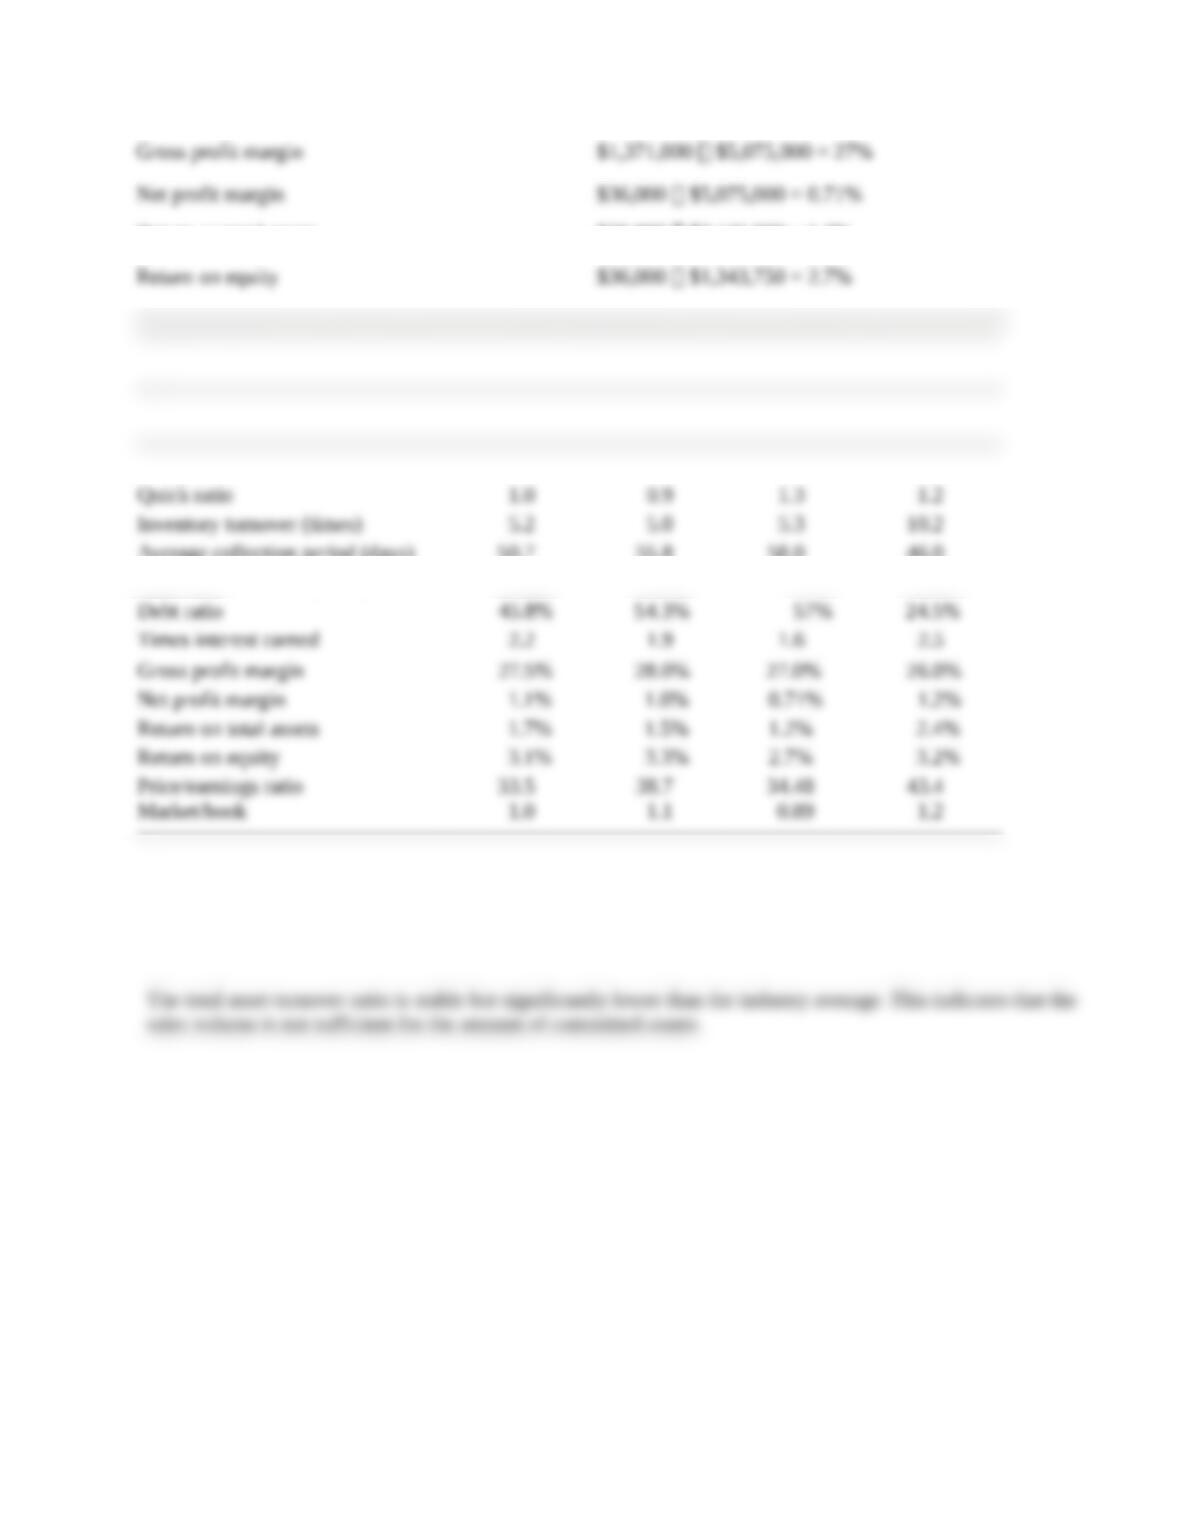
Historical Ratios
Martin Manufacturing Company
Ratio
Actual
2010
Actual
2011
Actual
2012
Industry
Average
Current ratio 1.7 1.8 2.5 1.5
Average collection period (days) 50.7 55.8 58.0 46.0
Total asset turnover (times) 1.5 1.5 1.6 2.0
b. Liquidity: The firm has sufficient current assets to cover current liabilities. The trend is upward and is much
higher than the industry average. This is an unfavorable position because it indicates too much inventory.
Activity: The inventory turnover is stable but much lower than the industry average. This indicates the firm is
holding too much inventory. The average collection period is increasing and much higher than the industry
average. These are both indicators of a problem in collecting payment.
The total asset turnover ratio is stable but significantly lower than the industry average. This indicates that the
sales volume is not sufficient for the amount of committed assets.
Debt: The debt ratio has increased and is substantially higher than the industry average. This places the
company at high risk. Typically industries with heavy capital investment and higher operating risk try to
minimize financial risk. Martin Manufacturing has positioned itself with both heavy operating and financial
risk. The times-interest-earned ratio also indicates a potential debt service problem. The ratio is decreasing
and is far below the industry average.
Profitability: The gross profit margin is stable and quite favorable when compared to the industry average.
The net profit margin, however, is deteriorating and far below the industry average. When the gross profit
margin is within expectations but the net profit margin is too low, high interest payments may be to blame.
The high financial leverage has caused the low profitability.
Market: The market price of the firm’s common stock shows weakness relative to both earnings and book
value. This result indicates a belief by the market that Martin’s ability to earn future profits faces increasing
uncertainty as perceived by the market.
c. Martin Manufacturing clearly has a problem with its inventory level, and sales are not at an appropriate level for
its capital investment. As a consequence, the firm has acquired a substantial amount of debt which, due to the
high interest payments associated with the large debt burden, is depressing profitability. These problems are
being picked up by investors as shown in their weak market ratios.
Spreadsheet Exercise
The answer to Chapter 3’s Dayton, Inc., financial statements spreadsheet problem is located on the Instructor’s
Resource Center at www.pearsonhighered.com/irc under the Instructor’s Manual.
Group Exercise
Group exercises are available on www.myfinancelab.com.
This chapter’s group focuses solely on the group’s shadow firm. Groups are asked to investigate and describe their
firm’s latest 10-K obtained from the Securities and Exchange website (www.sec.gov). From the filing, the groups
are asked to calculate the basic ratios as done in the text and discuss each ratio’s importance. This leads to a
comparison of these ratios over the most recent years. The number of years is up to the instructor’s discretion. A shorter
number of years is probably most desirable because this often can be accomplished from the single 10-K filing.
The conclusion of this assignment is calculation of the DuPont analysis for their shadow firm. This exercise
shouldn’t require much assistance, particularly if students have made a good choice for their firm in Chapter 1.
Modifications could include dropping the intertemporal analysis and focusing solely on the most recent year.
Alternatively, groups could be asked to compare the ratios from their shadow firm with the ratios from another
firm within the same industry.