P3-5. Calculation of EPS and retained earnings
LG 1; Intermediate
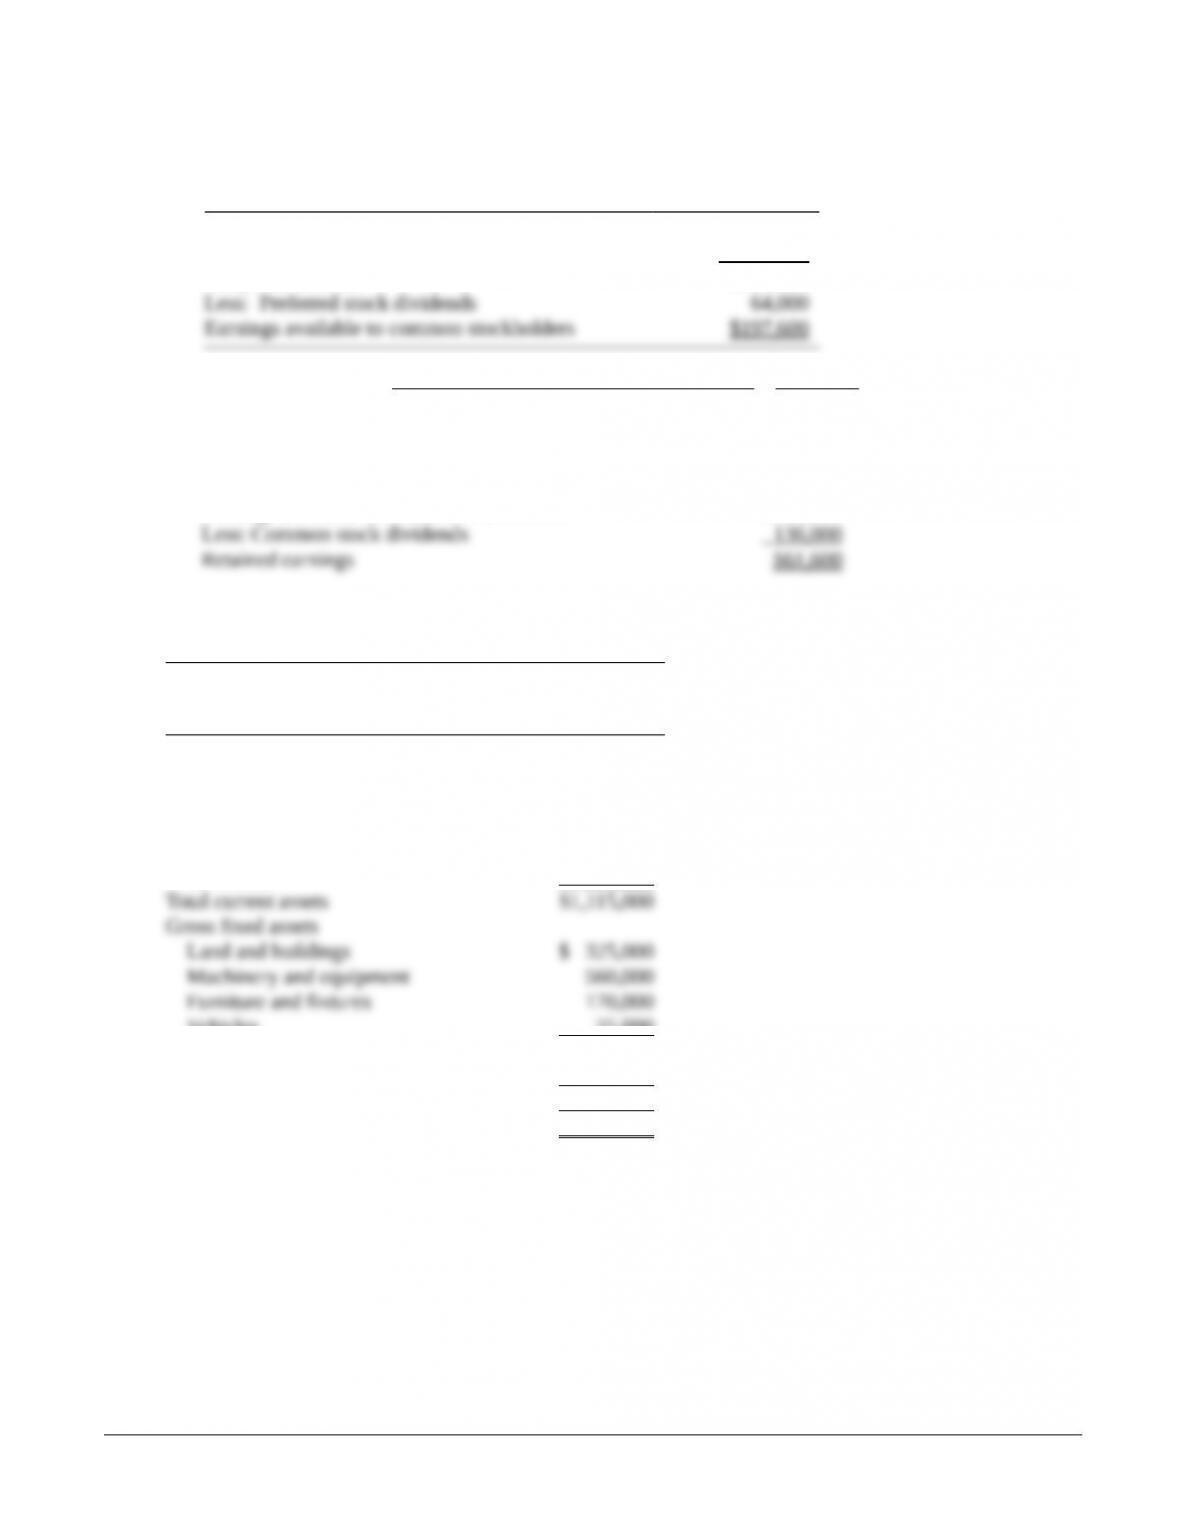
a. Earnings per share:
Net profit before taxes $436,000
Less: Taxes at 40% 174,400
Net profit after tax $261,600
Liabilities and stockholders’ equity
Current liabilities
Accounts payable $ 220,000
Notes payable 475,000
Accruals 55,000
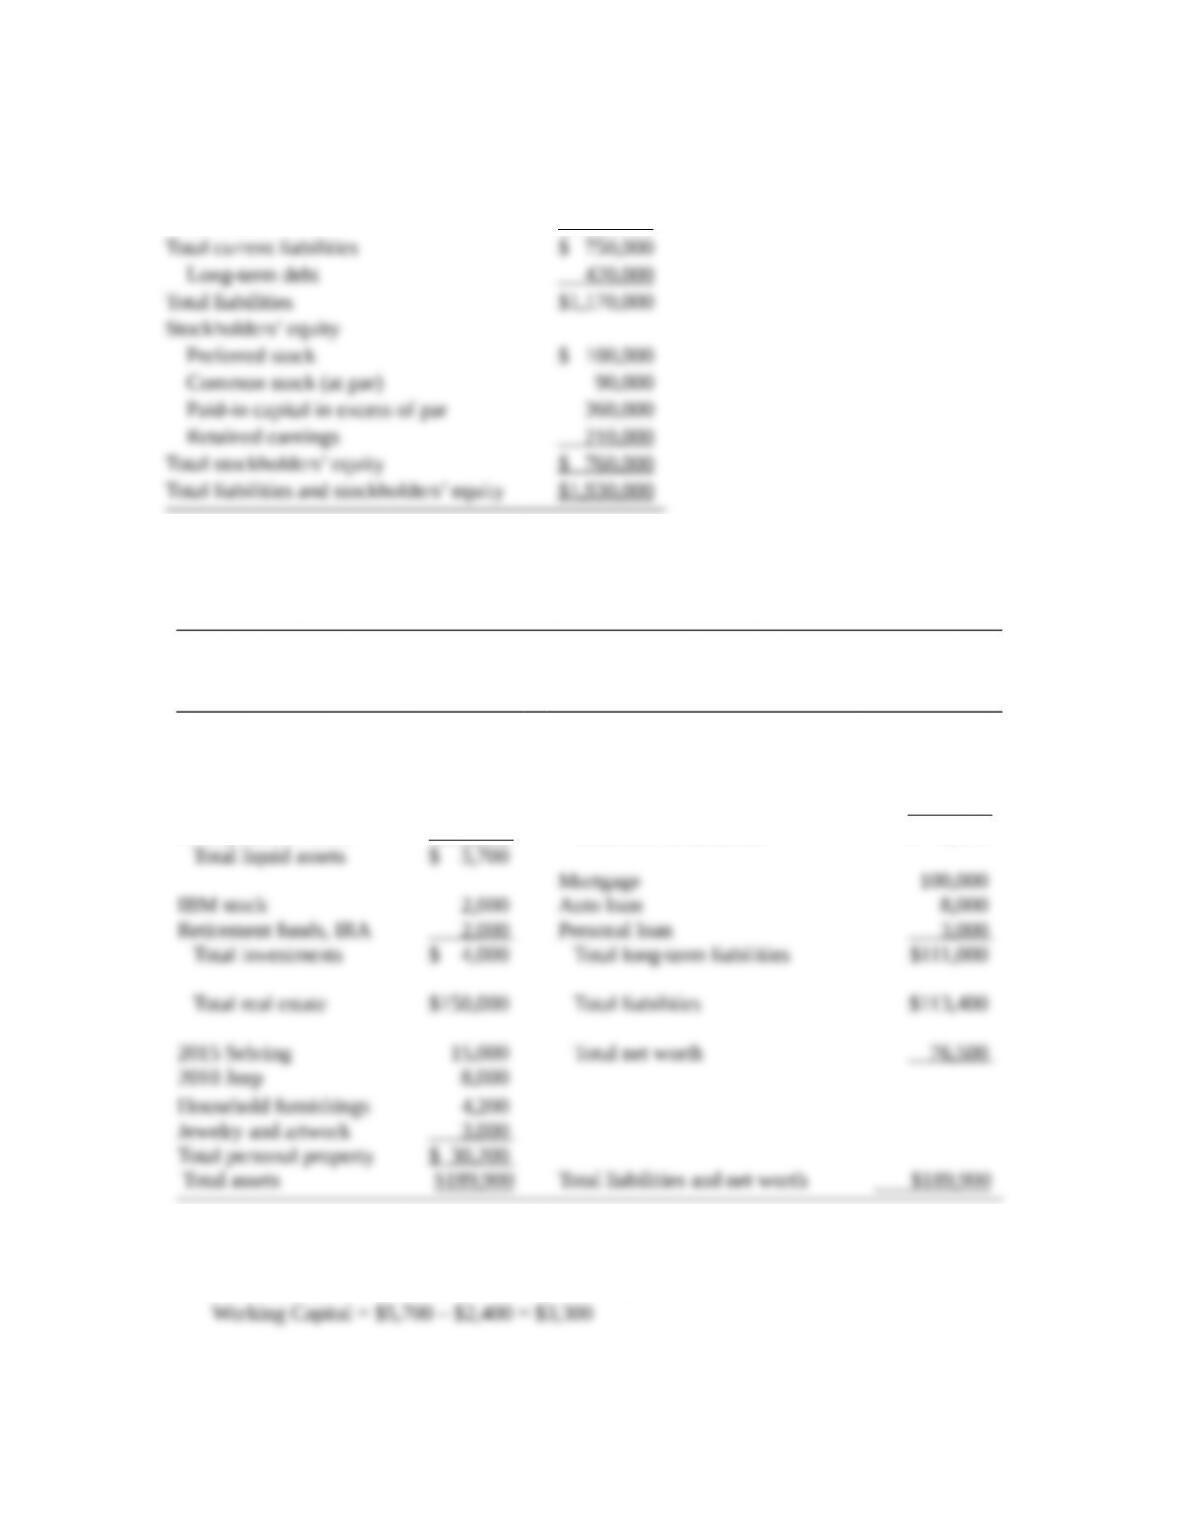
P3-7. Personal Finance: Balance sheet preparation
LG 1; Basic
a.
Adam and Arin Adams
Balance Sheet
December 31, 2015
Assets Liabilities and Net Worth
Cash $ 300 Utility bills $ 150
Checking 3,000 Medical bills 250
Savings 1,200 Credit card balance 2,000
Money market funds 1,200 Total current liabilities $ 2,400
b. Total assets of the Adams family must equal its debt plus the extent to which it has either experienced
a gain in value or paid the cost of an asset (its net worth).
c. Working Capital = Total liquid assets – Total current liabilities
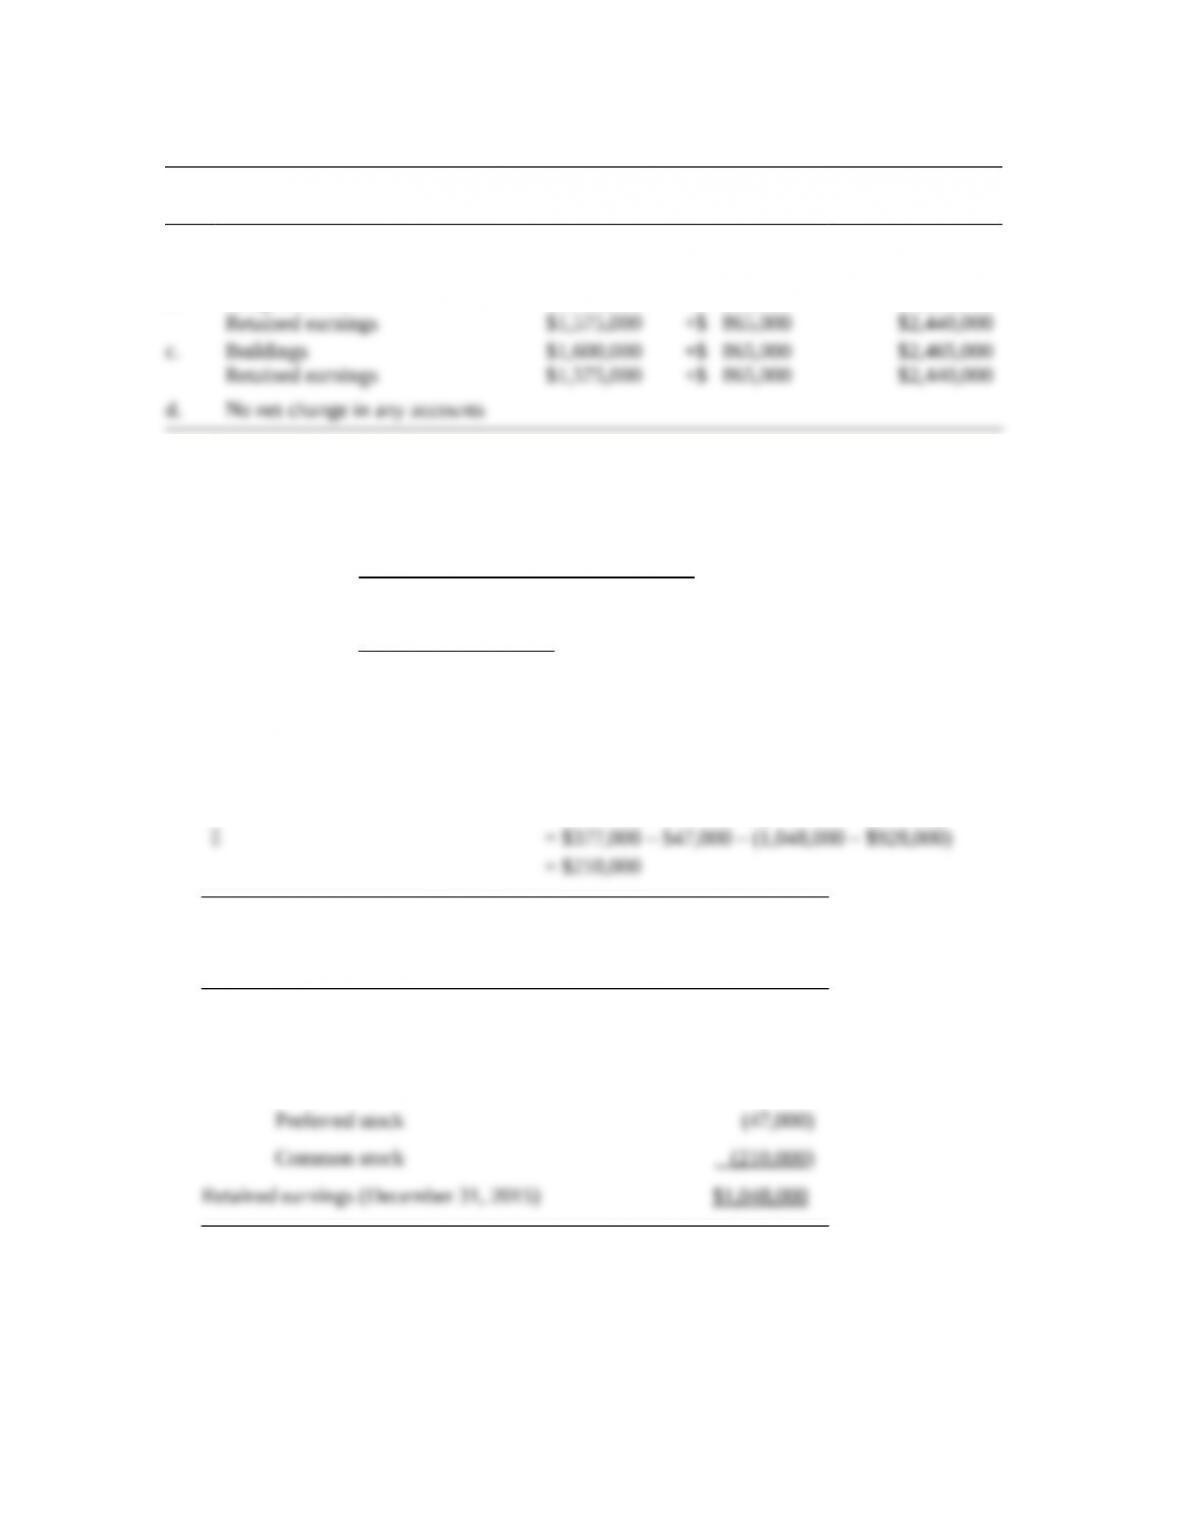
P3-8. Effect of net income on a firm’s balance sheet
LG 1; Basic
Account
Beginning
Value Change
Ending
Value
a. Marketable securities $ 35,000 +$1,365,000 $1,400,000
Retained earnings $1,575,000 +$1,365,000 $2,940,000
b. Long-term debt $2,700,000 –$ 865,000 $1,835,000
P3-9. Initial sale price of common stock
LG 1; Basic
(Par value of common stock
Paid in capital in excess of par)
Initial sales price Number of common shares outstanding
+
=
$200,000 $2,600,000
Initial sales price $7.00 per share
400,000
+
= =
P3-10. Statement of retained earnings
LG 1; Intermediate
a. Cash dividends paid on common stock = Net profits after taxes – preferred
dividends – change in retained earnings
Hayes Enterprises
Statement of Retained Earnings
for the Year Ended December 31, 2015
Retained earnings balance (January 1, 2015) $ 928,000
Plus: Net profits after taxes (for 2015) 377,000
Less: Cash dividends (paid during 2015)
b.
*
Net profit after tax Preferred dividends (EACS )
Earnings per share Number of common shares outstanding
–
=
$377,000 $47,000
Earnings per share $2.36
140,000
–
= =
*Earnings available to common stockholders
c.
Total cash dividend
Cash dividend per share # shares
=
$210,000 (from Part a)
Cash dividend per share $1.50
140,000
= =
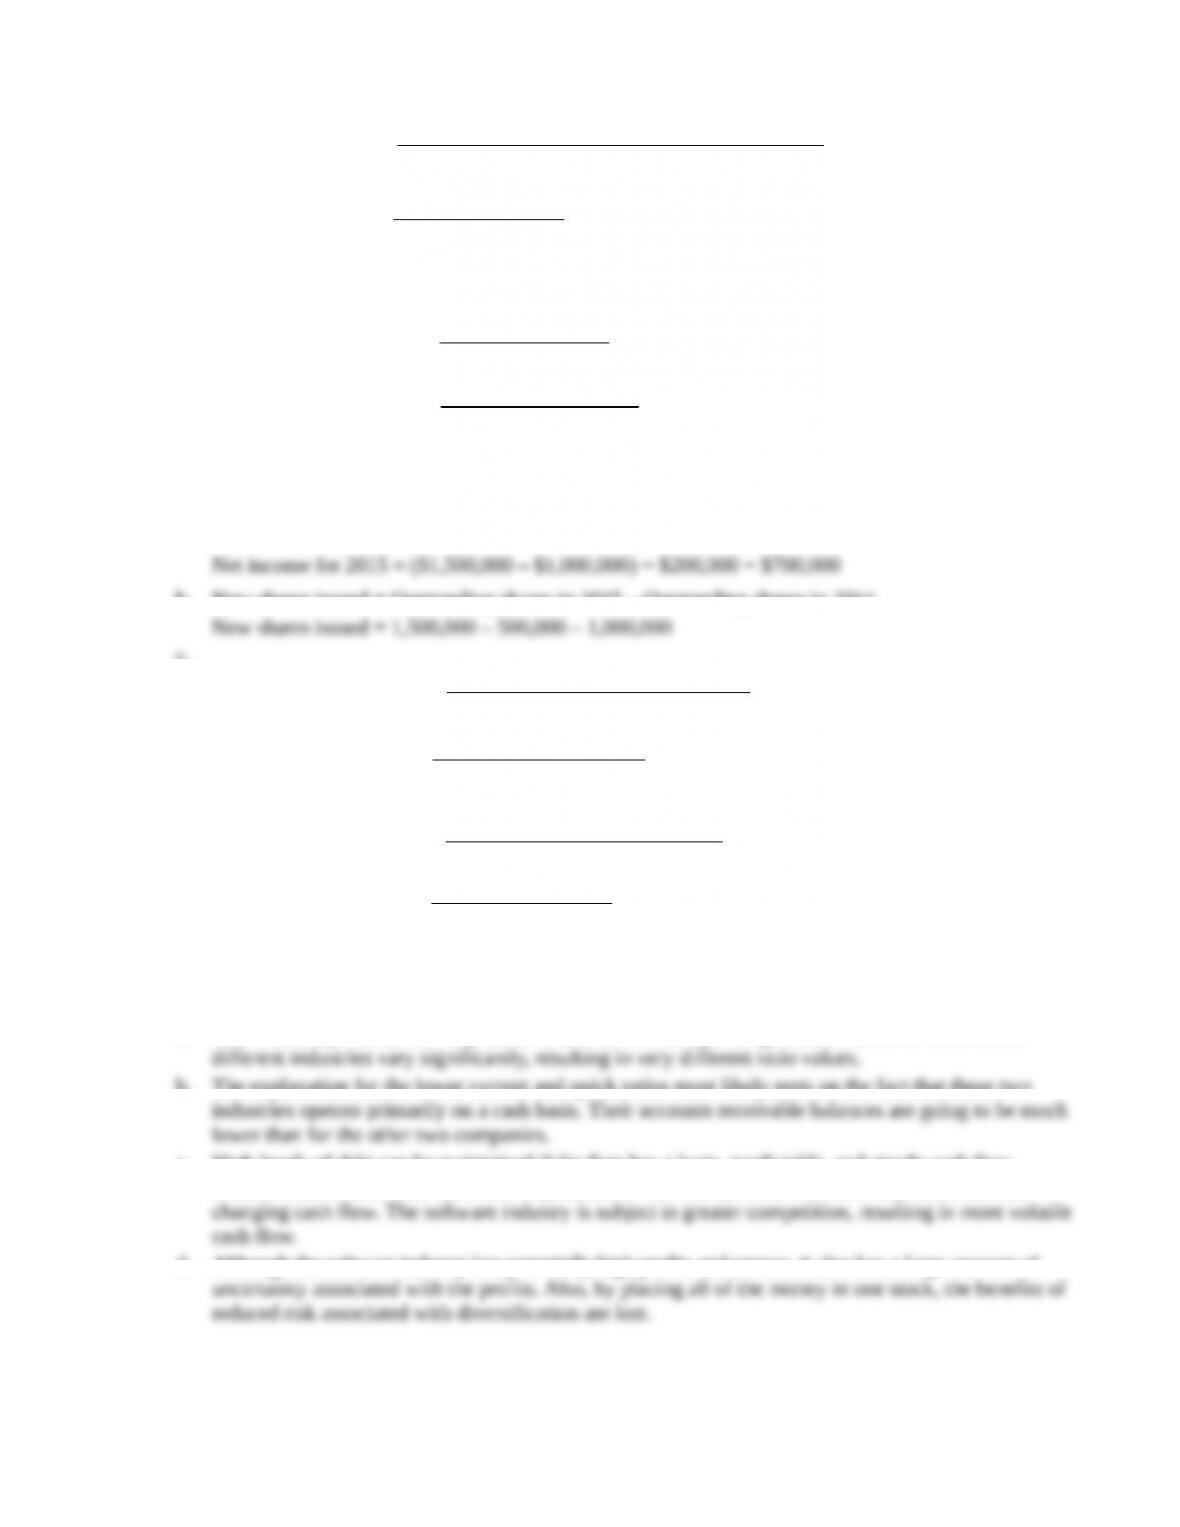
P3-11. Changes in stockholders’ equity
LG 1; Intermediate
a. Net income for 2015 = change in retained earnings − dividends paid
b. New shares issued = Outstanding shares in 2015 – Outstanding shares in 2014
c.
Paid-in-capital Common stock
Average issuance price shares outstanding
$4,000,000 $1,000,000
Average issuance price $5.00
1,000,000
D +D
=D
+
= =
d.
Paid-in-capital Common stock
Original issuance price Number of shares issued
$500,000 $500,000
Original issuance price $2.00
500,000
+
=
+
= =
P3-12. Ratio comparisons
LG 2, 3, 4, 5; Basic
a. The four companies are in very different industries. The operating characteristics of firms across
b. The explanation for the lower current and quick ratios most likely rests on the fact that these two
c. High levels of debt can be maintained if the firm has a large, predictable, and steady cash flow.
Utilities tend to meet these cash flow requirements. The software firm will have very uncertain and
d. Although the software industry has potentially high profits and returns, it also has a large amount of
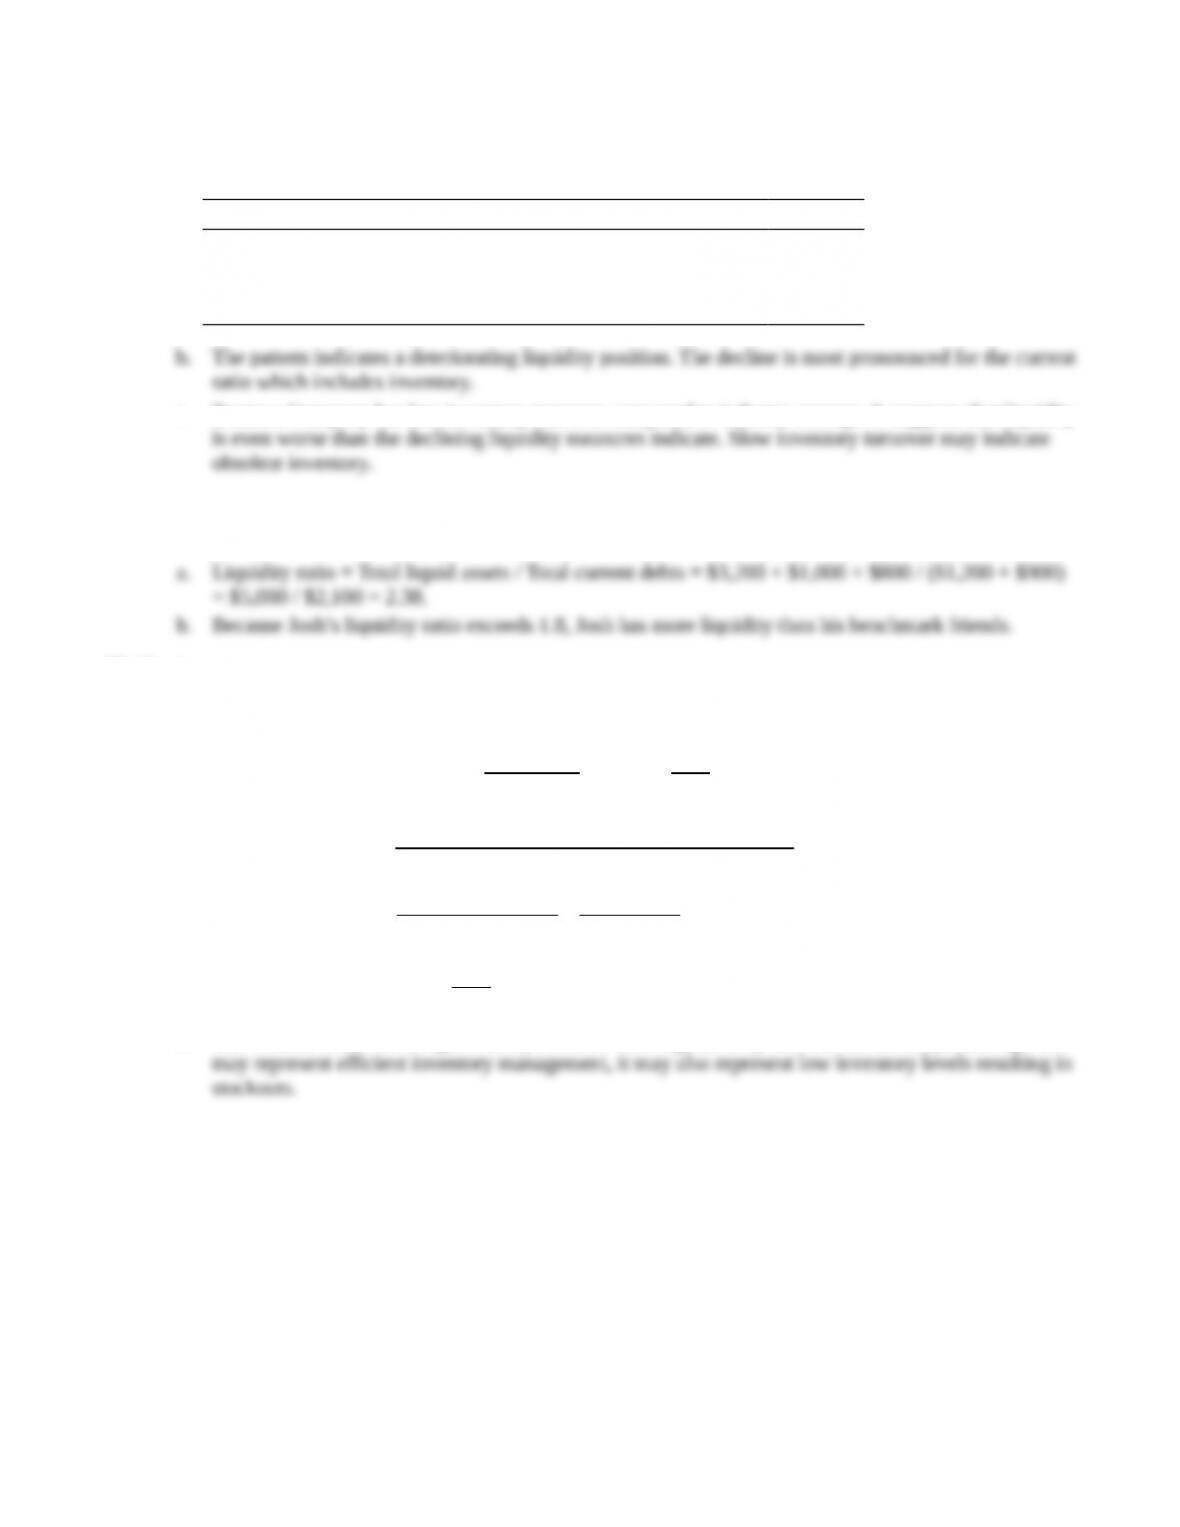
P3-13. Liquidity management
LG 3; Basic
a.
2012 2013 2014 2015
Current ratio 1.88 1.74 1.79 1.55
Quick ratio 1.22 1.19 1.24 1.14
Net working capital $7,950 $9,300 $9,900 $9,600
c. Bauman Company has low inventory turnover compared to industry average. It suggests that liquidity
P3-14. Personal finance: Liquidity ratio
LG 3; Basic
P3-15. Inventory management
LG 3; Basic
a. Sales $4,000,000 100%
Less: Gross profit $1,600,000 40%
Cost of goods sold $2,400,000 60%
$400,000 $800,000 $1,200,000 $200,000
Average inventory $650,000
4
+ + +
= =
Cost of goods sold $2, 400,000
Inventory turnover 3.69 times
Average inventory $650,000
= = =
365
Average age of inventory 98.9 days
3.69
= =
b. The Wilkins Manufacturing inventory turnover ratio significantly exceeds the industry. Although this
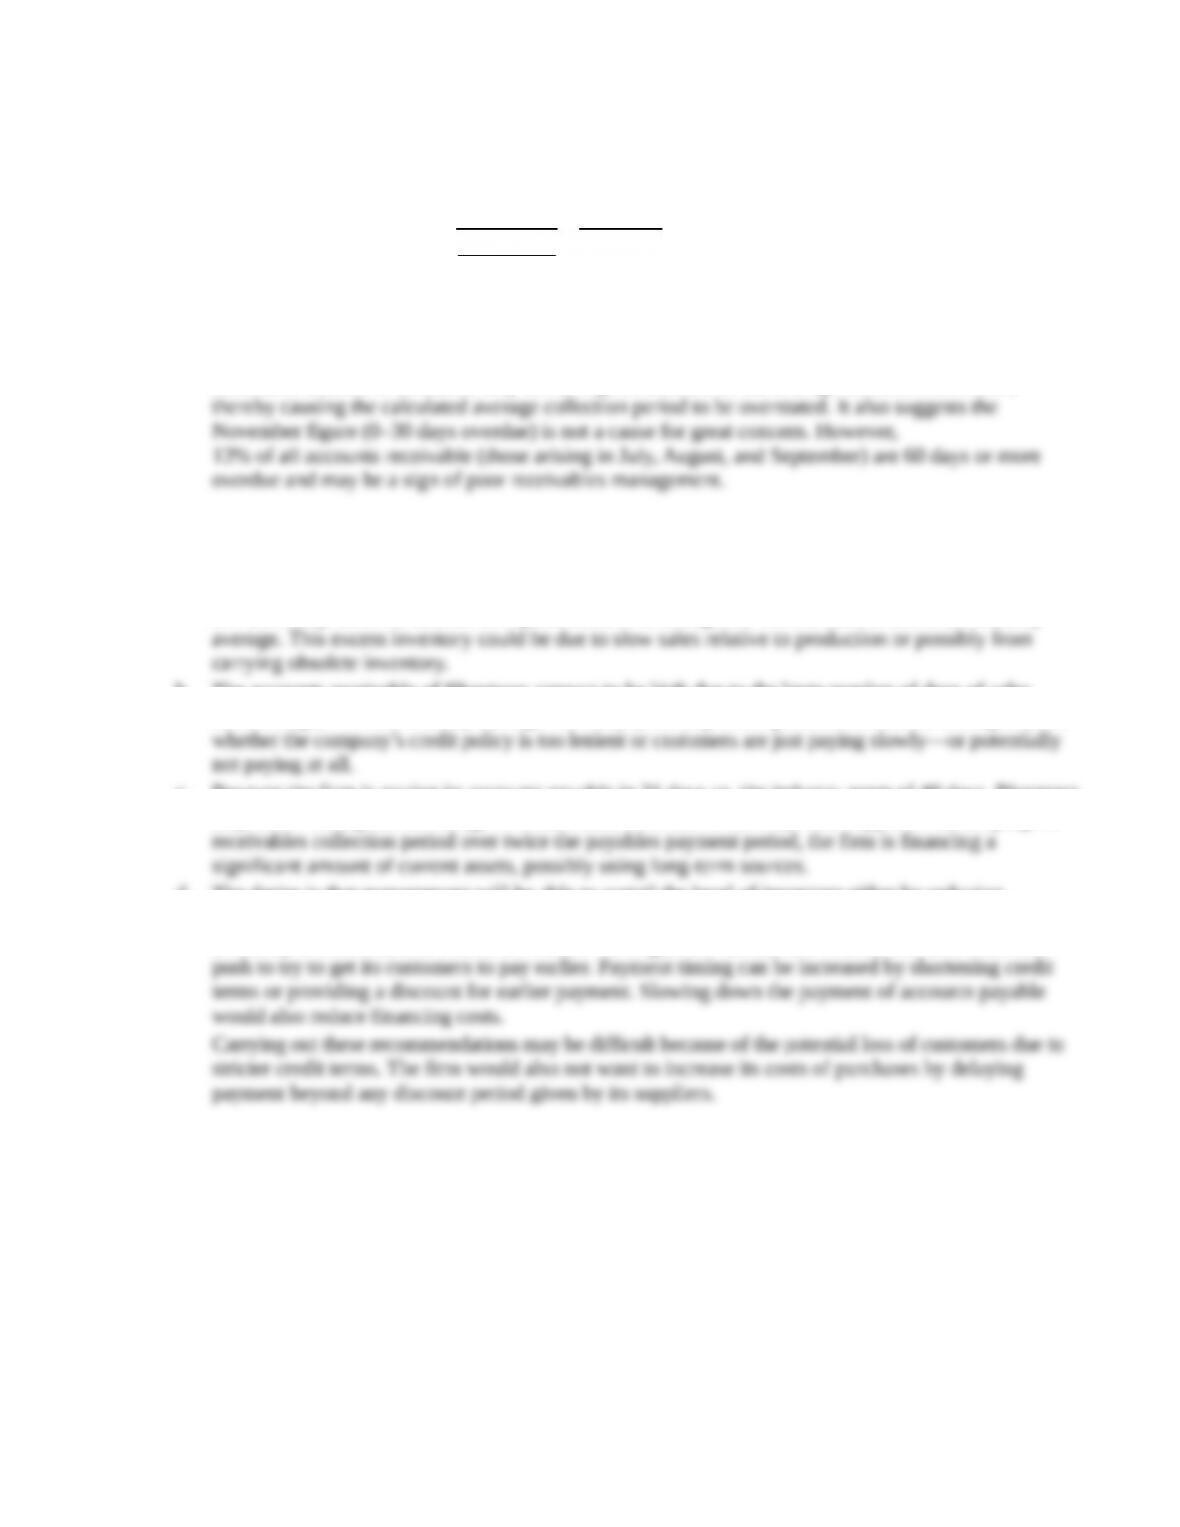
P3-16. Accounts receivable management
LG 3; Basic
a. Average collection period = Accounts receivable Average sales per day
$300,000 $300,000
Average collection period 45.62 days
$2,400,000 6,575.34
365
= = =
Because the average age of receivables is more than 15 days beyond the net date, attention should be
directed to accounts receivable management.
b. This may explain the lower turnover and higher average collection period. The December accounts
receivable balance of $300,000 may not be a good measure of the average accounts receivable,
P3-17. Interpreting liquidity and activity ratios
LG 3; Intermediate
a. Bluegrass appears to be holding excess inventory relative to the industry. This fact is supported by the
low inventory turnover and the low quick ratio, even though the current ratio is above the industry
b. The accounts receivable of Bluegrass appears to be high due to the large number of days of sales
outstanding (73 vs. the industry average of 52 days). An important question for internal management is
c. Because the firm is paying its accounts payable in 31 days vs. the industry norm of 40 days, Bluegrass
may not be taking full advantage of credit terms extended to them by their suppliers. By keeping the
d. The desire is that management will be able to curtail the level of inventory either by reducing
production or encouraging additional sales through a stronger sales program or discounts. If the
inventory is obsolete, then it must be written-off to gain the income tax benefit. The firm must also
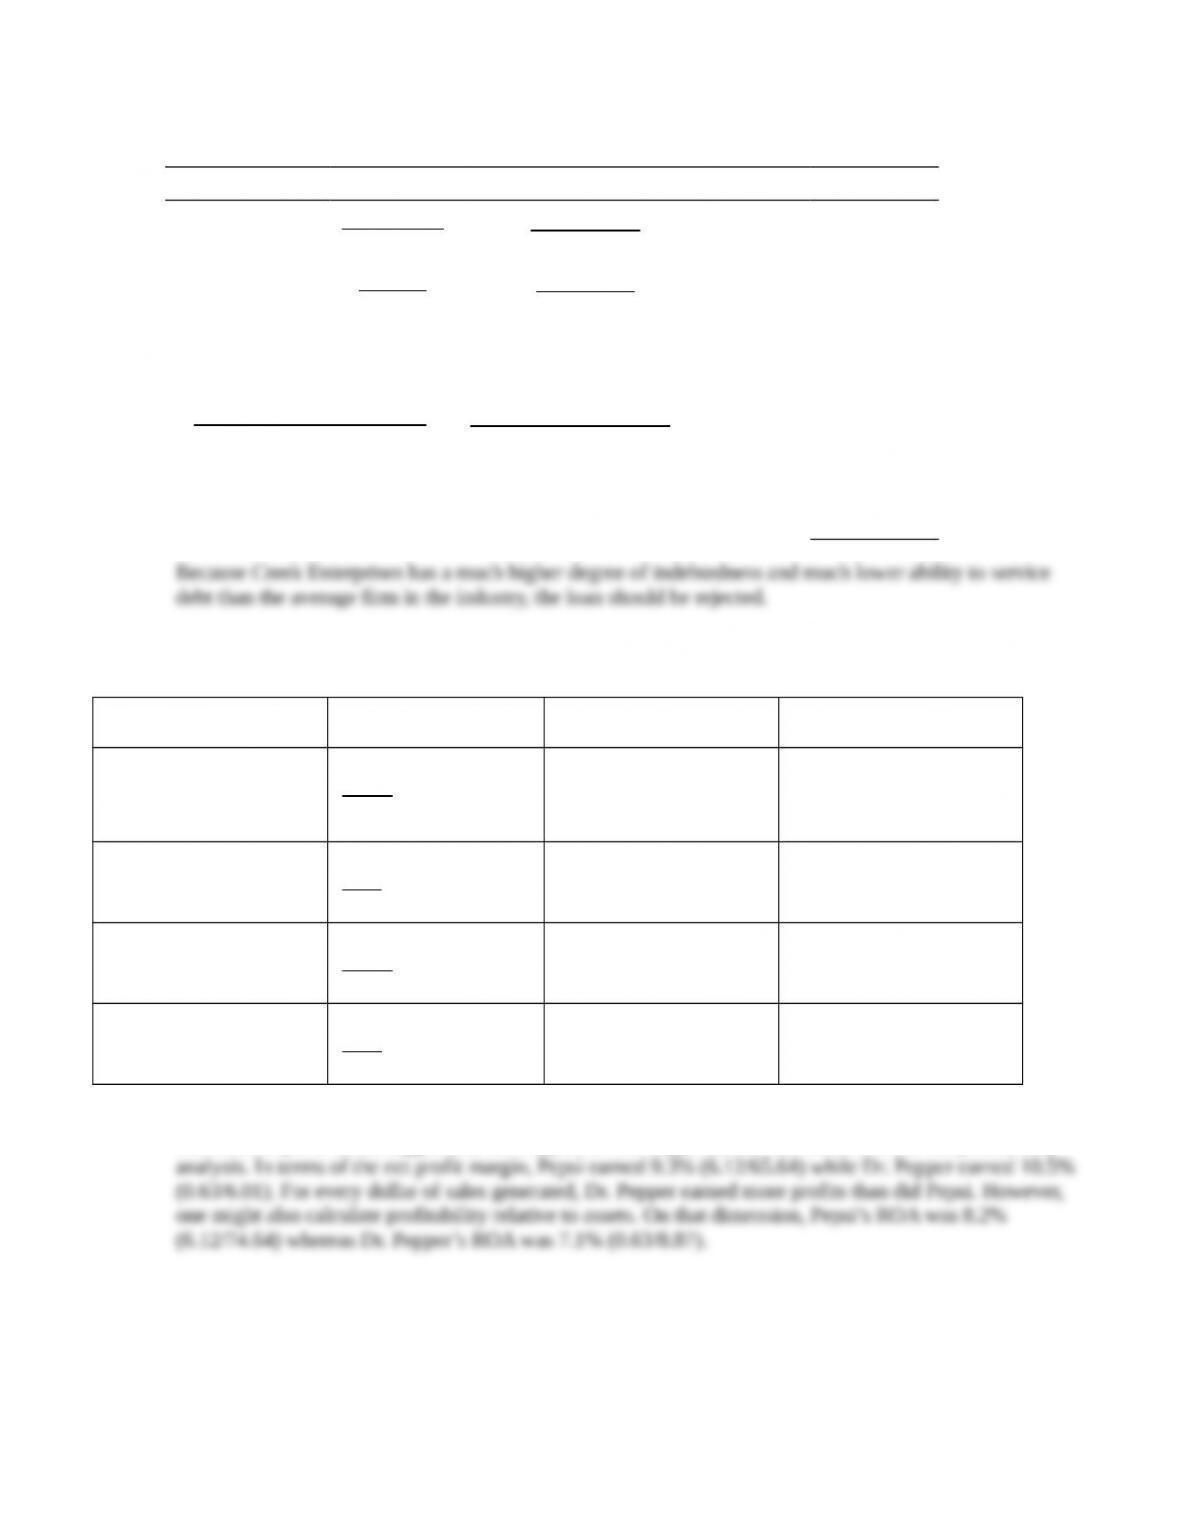
P3-18. Debt analysis
LG 4; Basic
Ratio Definition Calculation Creek Industry
Debt
Debt
Total assets
$36,500,000
$50,000,000
0.73 0.51
Times
Interest earned
EBIT
Interest
$3,000,000
$1,000,000
3.00 7.30
Fixed
Payment
Coverage
EBIT Lease payment
Interest Lease payments
+
+
+ {[(principal + preferred stock
Dividends)] [1 (1 – t)]}
$3,000,000 $200,000
$1,000,000 $200,000
+
+
+{[($800,000 +
$100,000)]
[1 (1 – 0.4)]}
1.19 1.85
P3-19.
LG 5; Intermediate
Calculation Pepsi Dr. Pepper
Net profit margin
6.12
65.64
9.3 %
0.63
6.01
10.5%
Return on assets
6.12
74.64
8.2%
0.63
8.87
7.1%
First, Pepsi made earned higher profits in absolute terms, so in that sense, they were more profitable.
However, Pepsi is much bigger than Dr. Pepper, so one might want to use ratios to scale the profitability