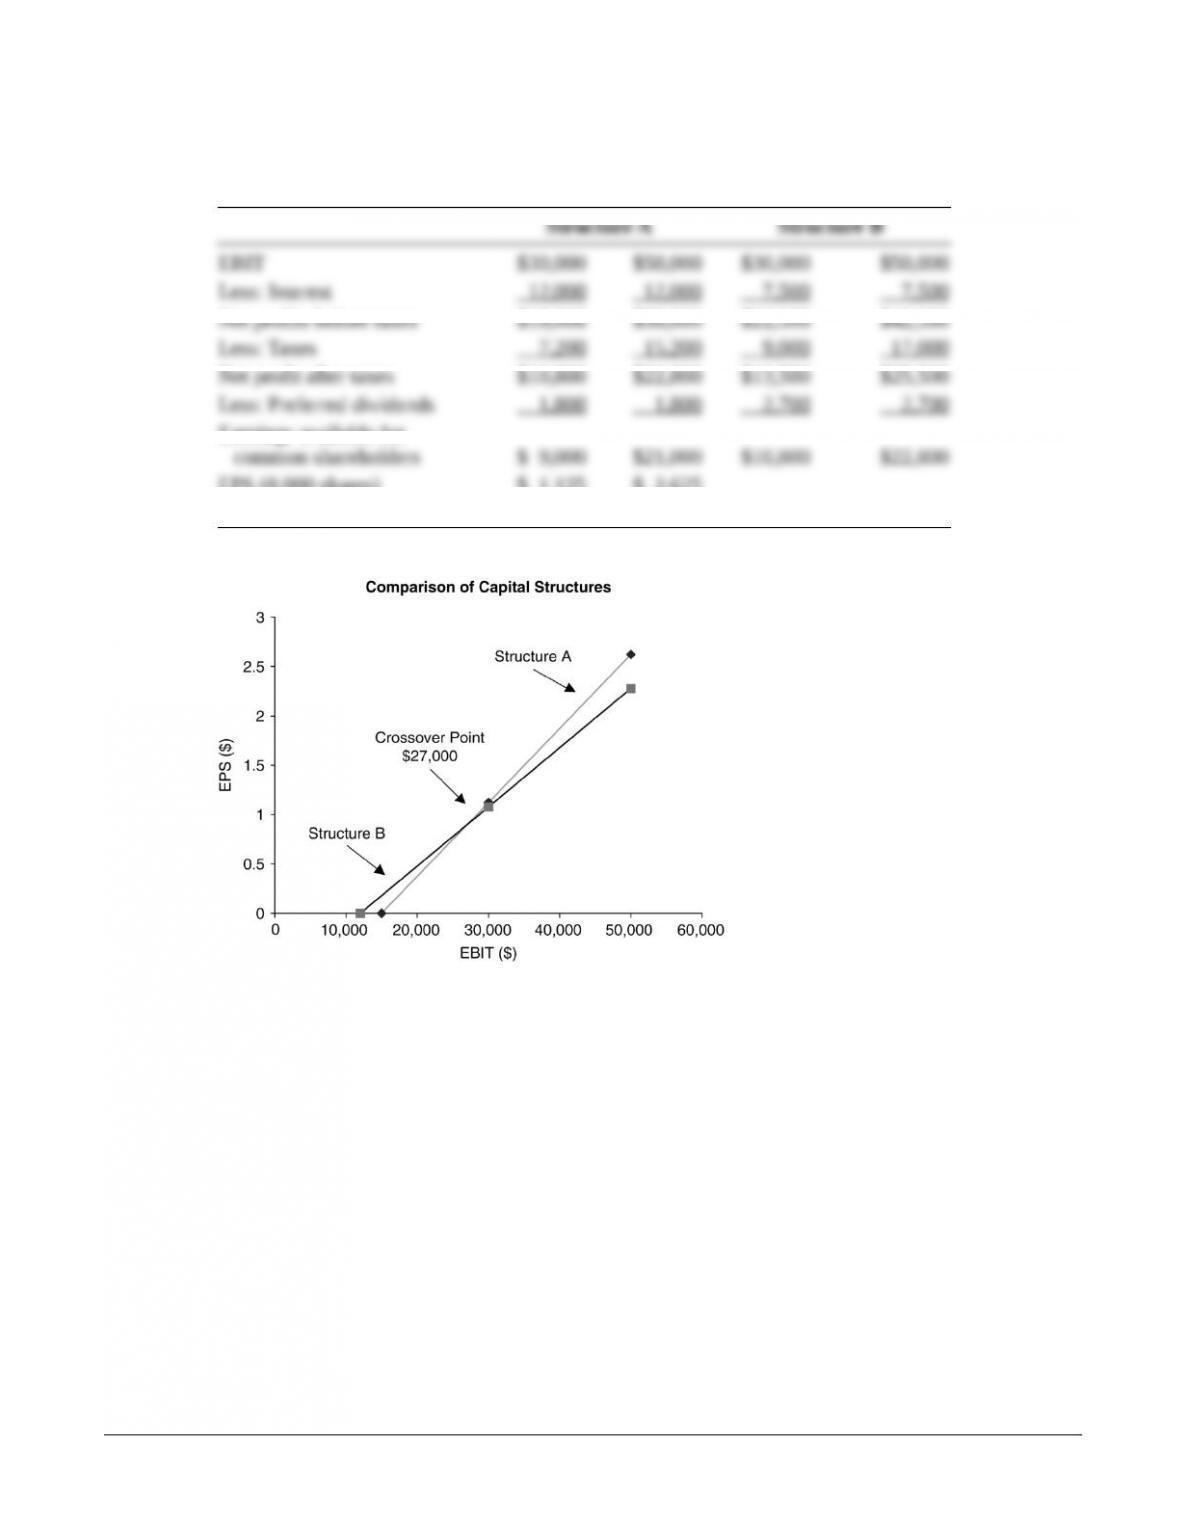
P13-23. EBIT-EPS and preferred stock
LG 5: Intermediate
a.
Structure A Structure B
EBIT $30,000 $50,000 $30,000 $50,000
Less: Interest 12,000 12,000 7,500 7,500
Net profits before taxes $18,000 $38,000 $22,500 $42,500
Less: Taxes 7,200 15,200 9,000 17,000
Net profit after taxes $10,800 $22,800 $13,500 $25,500
Less: Preferred dividends 1,800 1,800 2,700 2,700
Earnings available for
common shareholders $ 9,000 $21,000 $10,800 $22,800
EPS (8,000 shares) $ 1.125 $ 2.625
EPS (10,000 shares) $ 1.08 $ 2.28
b.
c. Structure A has greater financial leverage, hence greater financial risk.
d. If EBIT is expected to be below $27,000, Structure B is preferred. If EBIT is expected to be above
$27,000, Structure A is preferred.
e. If EBIT is expected to be $35,000, Structure A is recommended since changes in EPS are much
greater for given values of EBIT.
© 2015 Pearson Education, Inc.
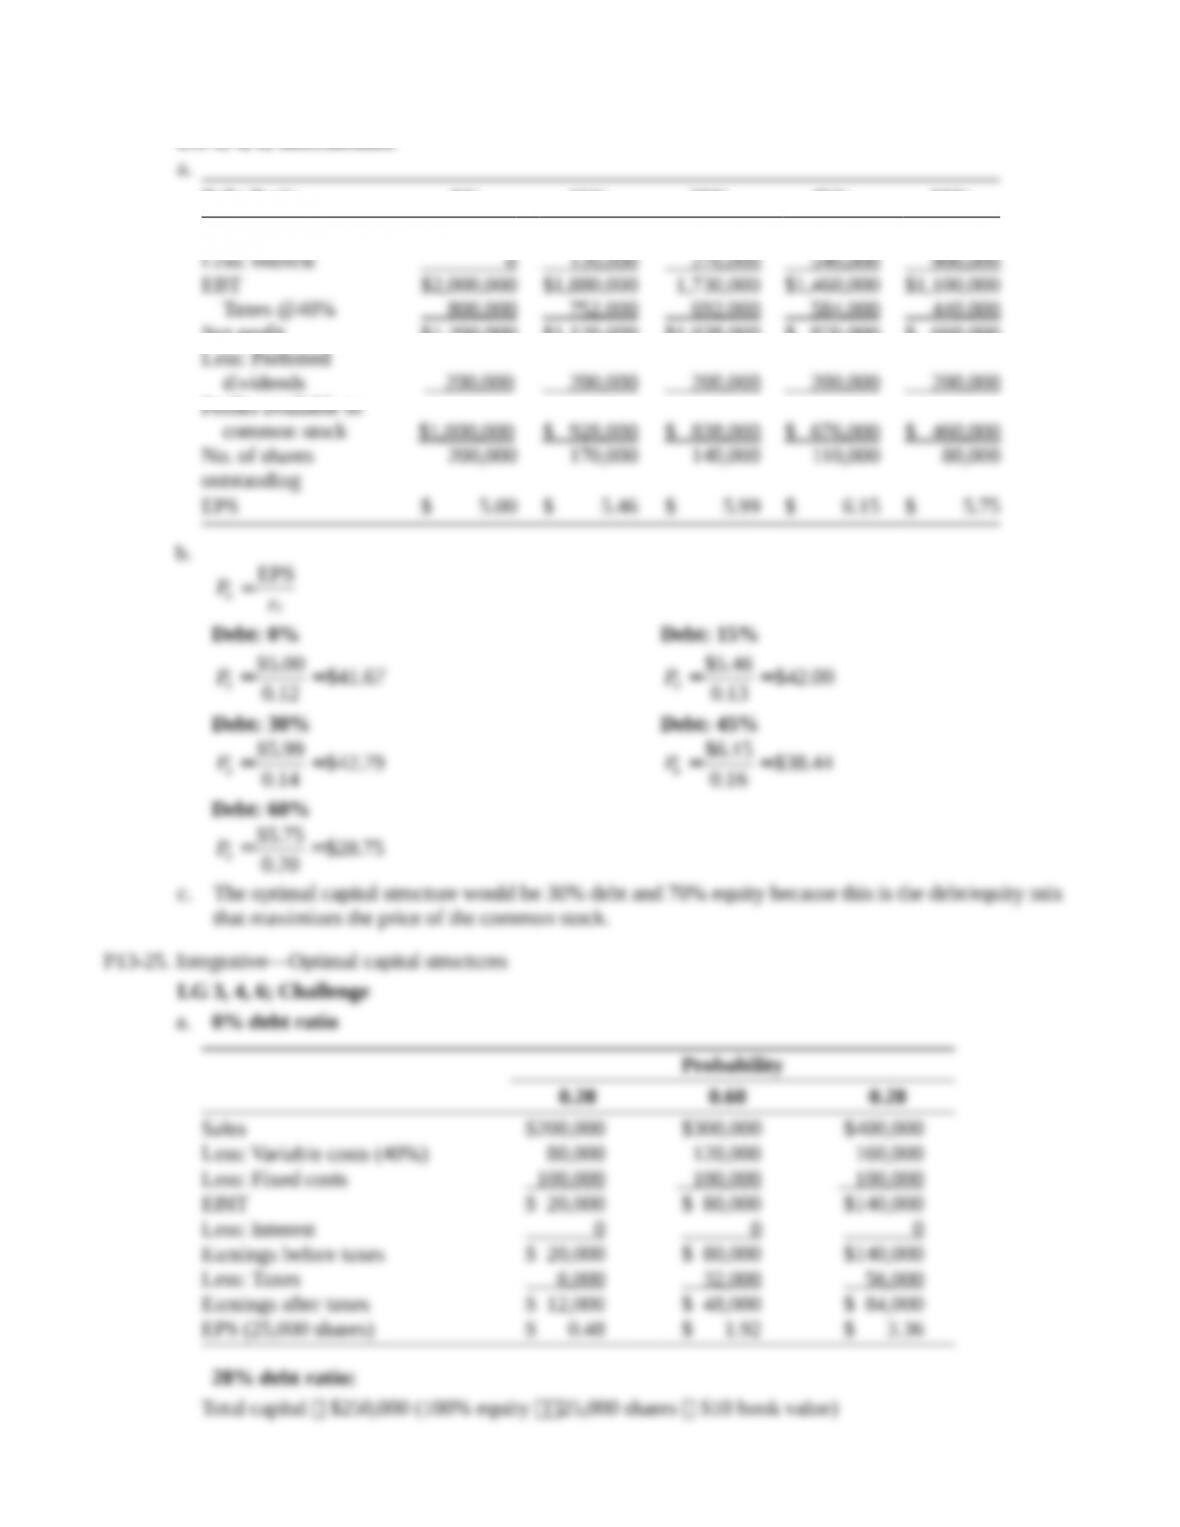
P13-24. Integrative—optimal capital structure
LG 3, 4, 6; Intermediate
a.
Debt Ratio 0% 15% 30% 45% 60%
EBIT $2,000,000 $2,000,000 $2,000,000 $2,000,000 $2,000,000
Less: Interest 0 120,000 270,000 540,000 900,000
EBT $2,000,000 $1,880,000 1,730,000 $1,460,000 $1,100,000
Taxes @40% 800,000 752,000 692,000 584,000 440,000
Net profit $1,200,000 $1,128,000 $1,038,000 $ 876,000 $ 660,000
Less: Preferred
dividends 200,000 200,000 200,000 200,000 200,000
Profits available to
common stock $1,000,000 $ 928,000 $ 838,000 $ 676,000 $ 460,000
No. of shares
outstanding
200,000 170,000 140,000 110,000 80,000
EPS $ 5.00 $ 5.46 $ 5.99 $ 6.15 $ 5.75
b.
=
0
EPS
s
Pr
Debt: 0% Debt: 15%
= =
0
$5.00 $41.67
0.12
P
= =
0
$5.46 $42.00
0.13
P
Debt: 30% Debt: 45%
= =
0
$5.99 $42.79
0.14
P
= =
0
$6.15 $38.44
0.16
P
Debt: 60%
= =
0
$5.75 $28.75
0.20
P
c. The optimal capital structure would be 30% debt and 70% equity because this is the debt/equity mix
that maximizes the price of the common stock.
P13-25. Integrative—Optimal capital structures
LG 3, 4, 6; Challenge
a. 0% debt ratio
Probability
0.20 0.60 0.20
Sales $200,000 $300,000 $400,000
Less: Variable costs (40%) 80,000 120,000 160,000
Less: Fixed costs 100,000 100,000 100,000
EBIT $ 20,000 $ 80,000 $140,000
Less: Interest 0 0 0
Earnings before taxes $ 20,000 $ 80,000 $140,000
Less: Taxes 8,000 32,000 56,000
Earnings after taxes $ 12,000 $ 48,000 $ 84,000
EPS (25,000 shares) $ 0.48 $ 1.92 $ 3.36
20% debt ratio:
Total capital $250,000 (100% equity 25,000 shares $10 book value)
Amount of debt 20% $250,000 $50,000
Amount of equity 80% 250,000 $200,000
Number of shares $200,000 $10 book value 20,000 shares
Probability
0.20 0.60 0.20
EBIT $20,000 $80,000 $140,000
Less: Interest 5,000 5,000 5,000
Earnings before taxes $15,000 $75,000 $135,000
Less: Taxes 6,000 30,000 54,000
Earnings after taxes $ 9,000 $45,000 $ 81,000
EPS (20,000 shares) $ 0.45 $ 2.25 $ 4.05
40% debt ratio:
Amount of debt 40% $250,000 total debt capital $100,000
Number of shares $150,000 equity $10 book value 15,000 shares
Probability
0.20 0.60 0.20
EBIT $20,000 $80,000 $140,000
Less: Interest 12,000 12,000 12,000
Earnings before taxes $ 8,000 $68,000 $128,000
Less: Taxes 3,200 27,200 51,200
Earnings after taxes $ 4,800 $40,800 $ 76,800
EPS (15,000 shares) $ 0.32 $ 2.72 $ 5.12
60% debt ratio:
Amount of debt 60% $250,000 total debt capital $150,000
Number of shares $100,000 equity $10 book value 10,000 shares
Probability
0.20 0.60 0.20
EBIT $20,000 $80,000 $140,000
Less: Interest 21,000 21,000 21,000
Earnings before taxes $ (1,000) $59,000 $119,000
Less: Taxes (400) 23,600 47,600
Earnings after taxes $ (600) $35,400 $ 71,400
EPS (10,000 shares) $ (0.06) $ 3.54 $ 7.14
Debt
Ratio E(EPS) EP
S)
CV
(EPS)
Number
of
Common
Shares
Dollar
Amount
of Debt Share Price*
0% $1.92 0.9107 0.4743 25,000 0 $1.92/0.16 $12.00
20% $2.25 1.1384 0.5060 20,000 $ 50,000 $2.25/0.17 $13.24
40% $2.72 1.5179 0.5581 15,000 $100,000 $2.72/0.18 $15.11
60% $3.54 2.2768 0.6432 10,000 $150,000 $3.54/0.24 $14.75
*Share price: E(EPS) required return for CV for E(EPS), from table in problem.
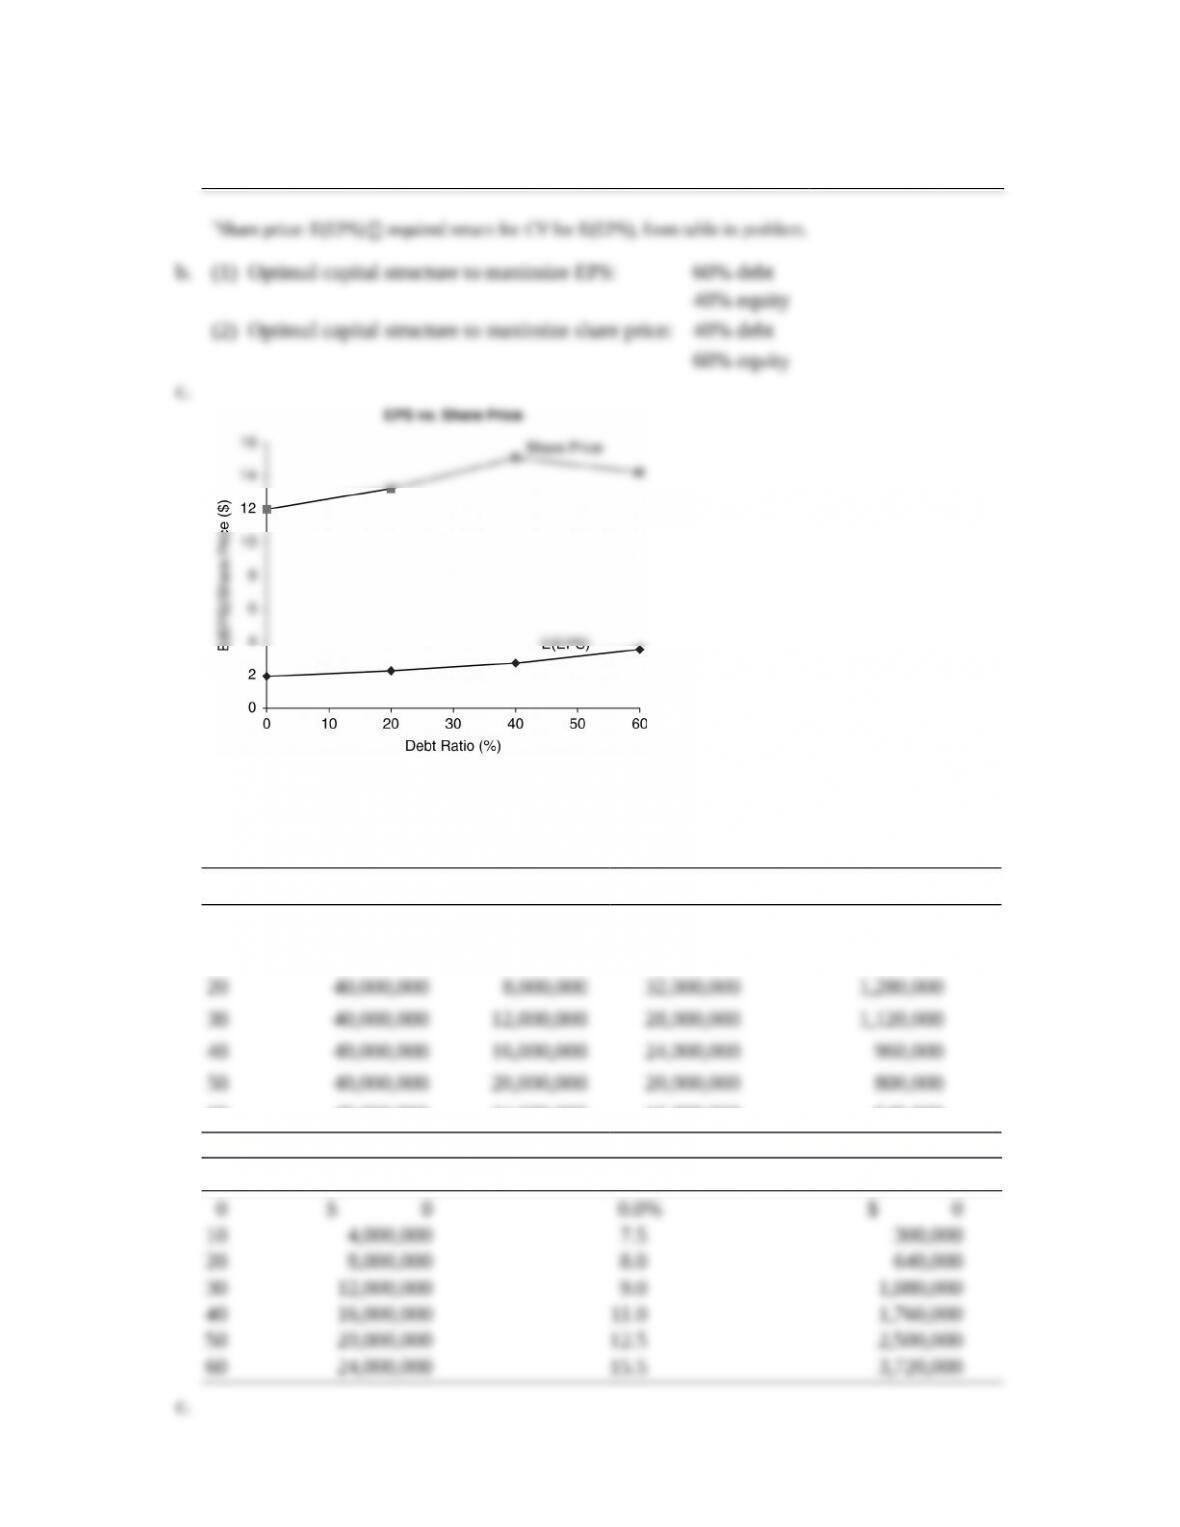
b. (1) Optimal capital structure to maximize EPS: 60% debt
40% equity
(2) Optimal capital structure to maximize share price: 40% debt
60% equity
c.
P13-26. Integrative—optimal capital structure
LG 3, 4, 5, 6; Challenge
a.
% Debt Total Assets $ Debt $ Equity No. of Shares @ $25
0 $40,000,000 $ 0 $40,000,000 1,600,000
10 40,000,000 4,000,000 36,000,000 1,440,000
20 40,000,000 8,000,000 32,000,000 1,280,000
30 40,000,000 12,000,000 28,000,000 1,120,000
40 40,000,000 16,000,000 24,000,000 960,000
50 40,000,000 20,000,000 20,000,000 800,000
60 40,000,000 24,000,000 16,000,000 640,000
b.
% Debt $ Total Debt Before Tax Cost of Debt, kd$ Interest Expense
0 $ 0 0.0% $ 0
10 4,000,000 7.5 300,000
20 8,000,000 8.0 640,000
30 12,000,000 9.0 1,080,000
40 16,000,000 11.0 1,760,000
50 20,000,000 12.5 2,500,000
60 24,000,000 15.5 3,720,000
c.
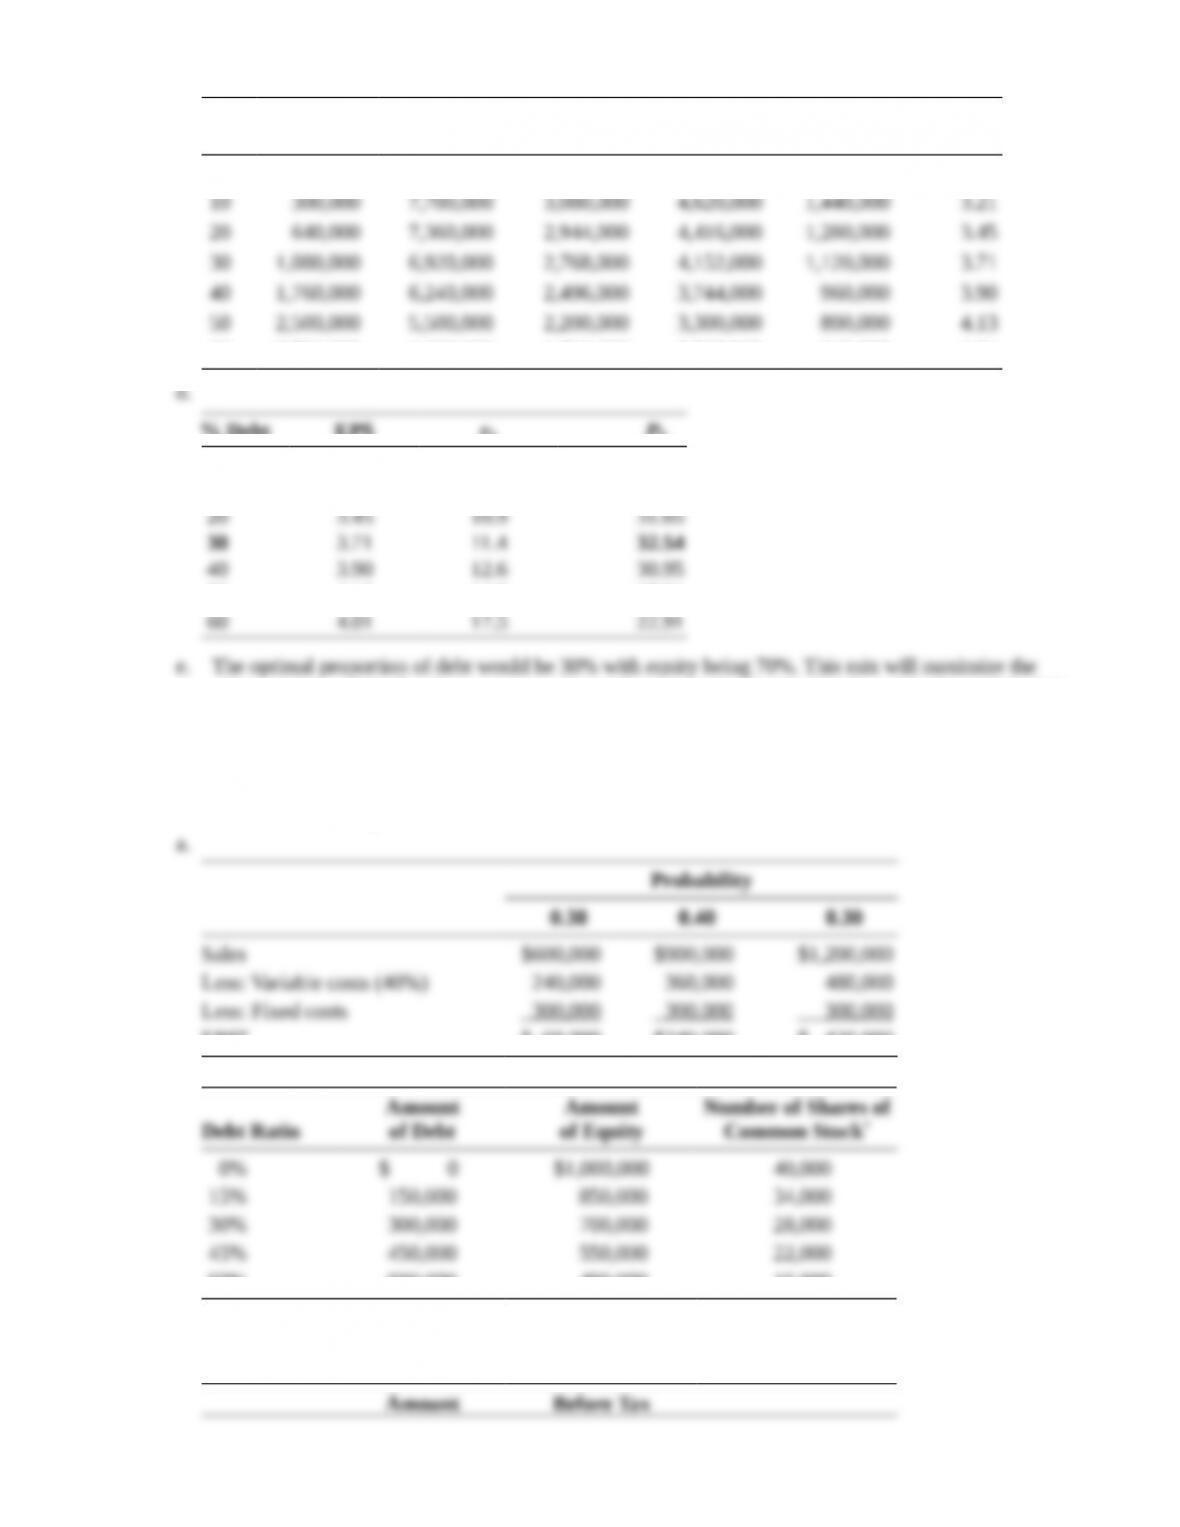
%
Debt
$ Interest
Expense EBT
Taxes
@40% Net Income
# of
Shares EPS
0 $ 0 $8,000,000 $3,200,000 $4,800,000 1,600,000 $3.00
10 300,000 7,700,000 3,080,000 4,620,000 1,440,000 3.21
20 640,000 7,360,000 2,944,000 4,416,000 1,280,000 3.45
30 1,080,000 6,920,000 2,768,000 4,152,000 1,120,000 3.71
40 1,760,000 6,240,000 2,496,000 3,744,000 960,000 3.90
50 2,500,000 5,500,000 2,200,000 3,300,000 800,000 4.13
60 3,720,000 4,280,000 1,712,000 2,568,000 640,000 4.01
d.
% Debt EPS rSP0
0 $3.00 10.0% $30.00
10 3.21 10.3 31.17
20 3.45 10.9 31.65
30 3.71 11.4 32.54
40 3.90 12.6 30.95
50 4.13 14.8 27.91
60 4.01 17.5 22.91
e. The optimal proportion of debt would be 30% with equity being 70%. This mix will maximize the
price per share of the firm’s common stock and thus maximize shareholders’ wealth. Beyond the 30%
level, the cost of capital increases to the point that it offsets the gain from the lower-costing debt
financing.
P13-27. Integrative—optimal capital structure
LG 3, 4, 5, 6; Challenge
a.
Probability
0.30 0.40 0.30
Sales $600,000 $900,000 $1,200,000
Less: Variable costs (40%) 240,000 360,000 480,000
Less: Fixed costs 300,000 300,000 300,000
EBIT $ 60,000 $240,000 $ 420,000
b.
Debt Ratio
Amount
of Debt
Amount
of Equity
Number of Shares of
Common Stock*
0% $ 0 $1,000,000 40,000
15% 150,000 850,000 34,000
30% 300,000 700,000 28,000
45% 450,000 550,000 22,000
60% 600,000 400,000 16,000
* Dollar amount of equity $25 per share Number of shares of common stock.
c
Amount Before Tax
Debt Ratio of Debt Cost of Debt Annual Interest
0% $ 0 0.0% $ 0
15% 150,000 8.0 12,000
30% 300,000 10.0 30,000
45% 450,000 13.0 58,500
60% 600,000 17.0 102,000
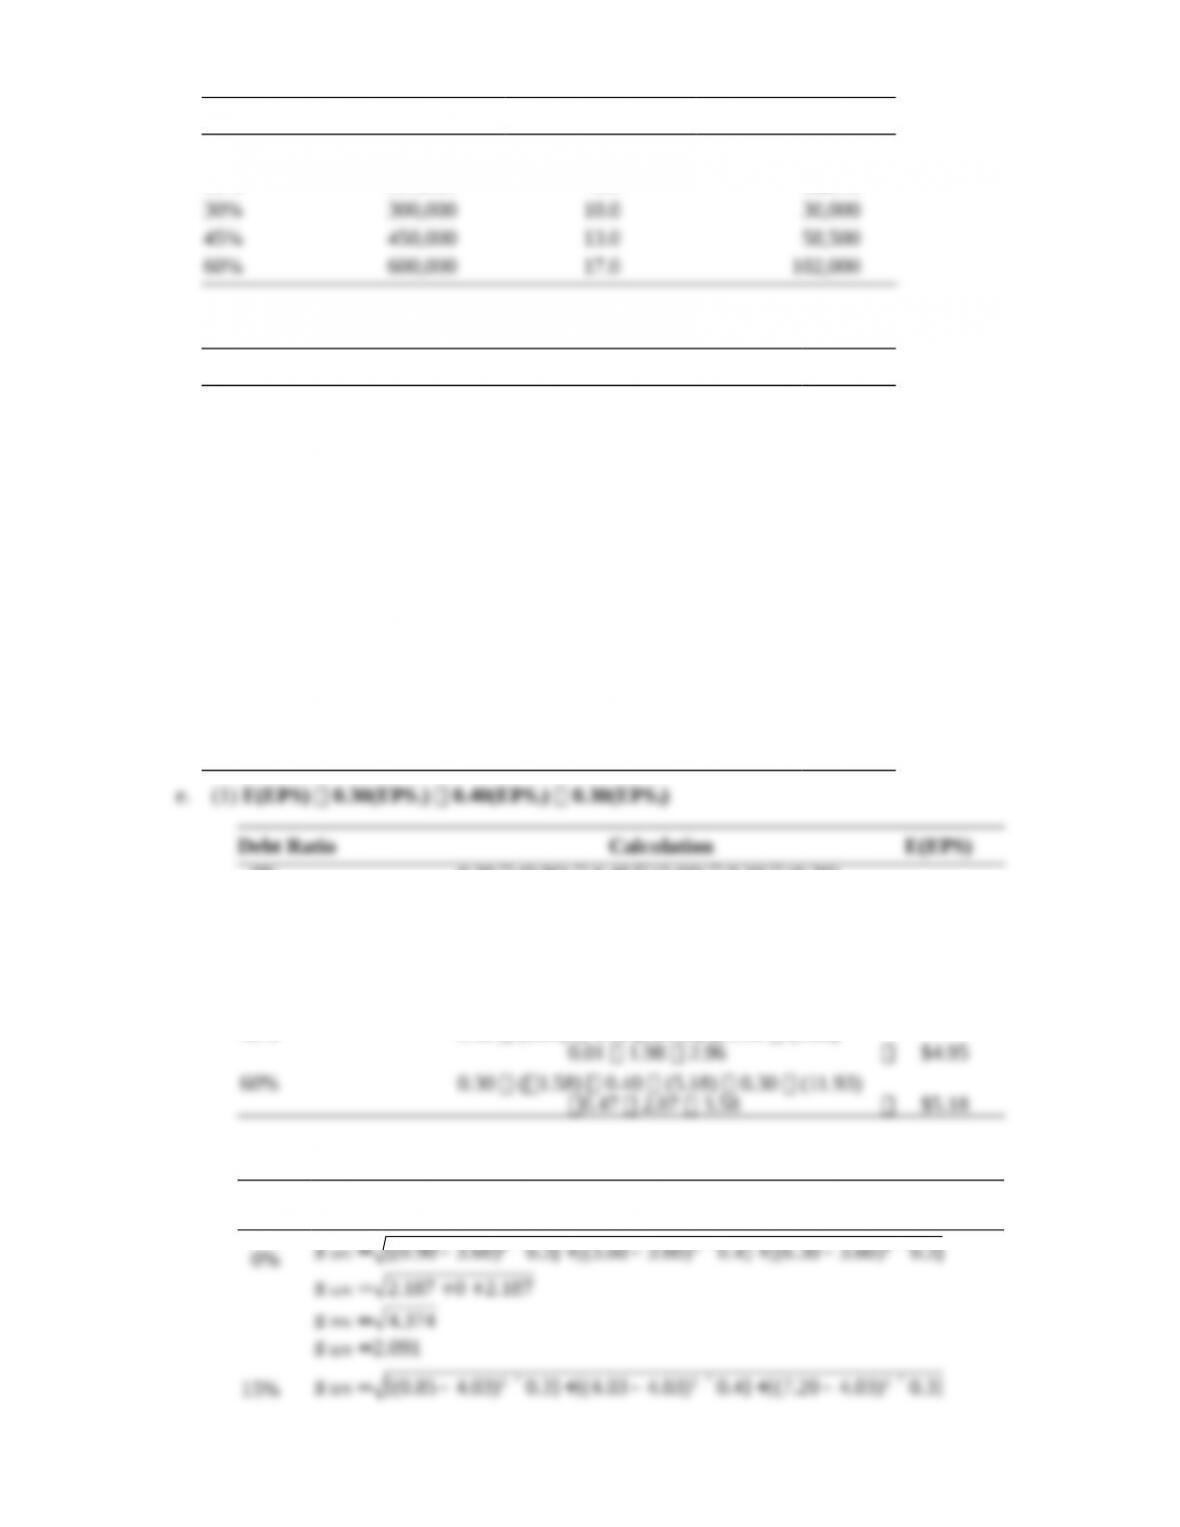
d. EPS [(EBIT interest) (1 T)] number of common shares outstanding
Debt Ratio Calculation EPS
0% ($60,000 $0) (0.6) 40,000 shares $0.90
($240,000 $0) (0.6) 40,000 shares 3.60
($420,000 $0) (0.6) 40,000 shares 6.30
15% ($60,000 $12,000) (0.6) 34,000 shares $0.85
($240,000 $12,000) (0.6) 34,000 shares 4.02
($420,000 $12,000) (0.6) 34,000 shares 7.20
30% ($60,000 $30,000) (0.6) 28,000 shares $0.64
($240,000 $30,000) (0.6) 28,000 shares 4.50
($420,000 $30,000) (0.6) 28,000 shares 8.36
45% ($60,000 $58,500) (0.6) 22,000 shares $0.04
($240,000 $58,500) (0.6) 22,000 shares 4.95
($420,000 $58,500) (0.6) 22,000 shares 9.86
60% ($60,000 $102,000) (0.6) 16,000 shares $1.58
($240,000 $102,000) (0.6) 16,000 shares 5.18
($420,000 $102,000) (0.6) 16,000 shares 11.93
e. (1) E(EPS) 0.30(EPS1) 0.40(EPS2) 0.30(EPS3)
Debt Ratio Calculation E(EPS)
0% 0.30 (0.90) 0.40 (3.60) 0.30 (6.30)
0.27 1.44 1.89 $3.60
15% 0.30 (0.85) 0.40 (4.02) 0.30 (7.20)
0.26 1.61 2.16 $4.03
30% 0.30 (0.64) 0.40 (4.50) 0.30 (8.36)
0.19 1.80 2.51 $4.50
45% 0.30 (0.04) 0.40 (4.95) 0.30 (9.86)
0.01 1.98 2.96 $4.95
60% 0.30 (1.58) 0.40 (5.18) 0.30 (11.93)
0.47 2.07 3.58 $5.18
(2) EPS
Debt
Ratio Calculation
0%
s= – ´ + – ´ + – ´
2 2 2
EPS
[(0.90 3.60) 0.3] [(3.60 3.60) 0.4] [(6.30 3.60) 0.3]
s= + +
EPS
2.187 0 2.187
s=
EPS
4.374
s=
EPS
2.091
15%
s= – ´ + – ´ + – ´
2 2 2
EPS
[(0.85 4.03) 0.3] [(4.03 4.03) 0.4] [(7.20 4.03) 0.3]
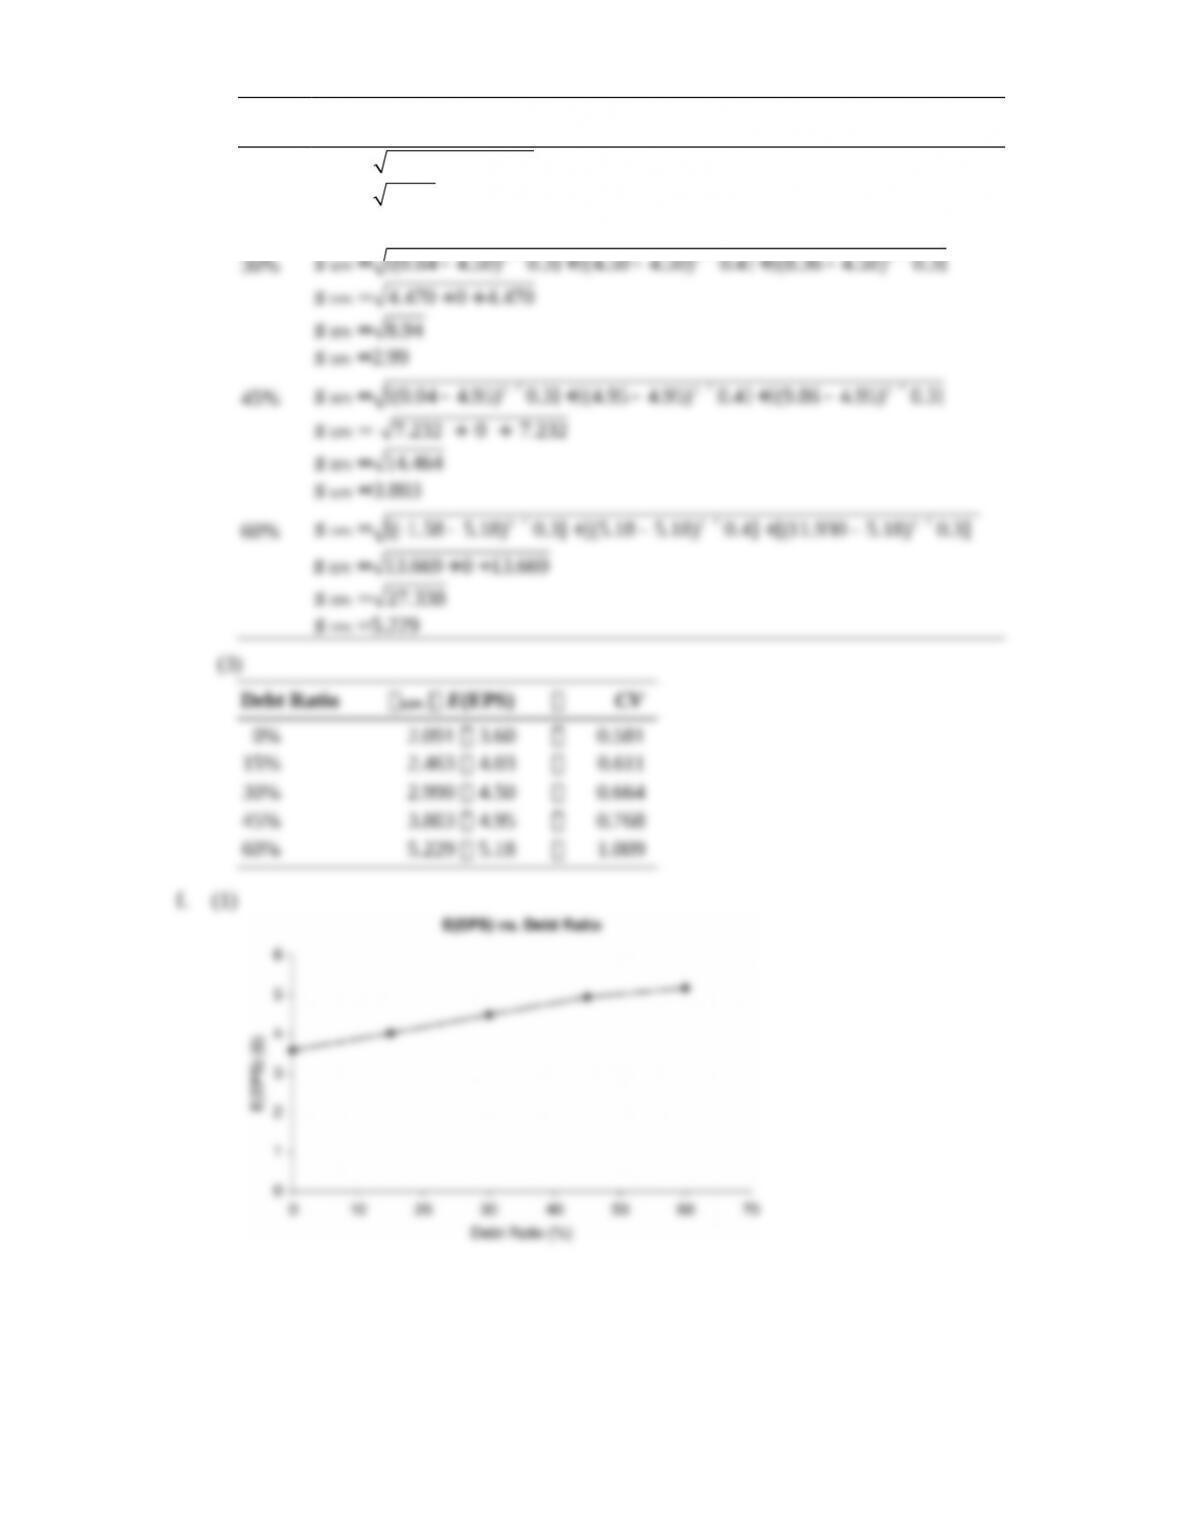
Debt
Ratio Calculation
s= + +
EPS
3.034 0 3.034
s=
EPS
6.068
s=
EPS
2.463
30%
s= – ´ + – ´ + – ´
2 2 2
EPS
[(0.64 4.50) 0.3] [(4.50 4.50) 0.4] [(8.36 4.50) 0.3]
s= + +
EPS
4.470 0 4.470
s=
EPS
8.94
s=
EPS
2.99
45%
s= – ´ + – ´ + – ´
2 2 2
EPS
[(0.04 4.95) 0.3] [(4.95 4.95) 0.4] [(9.86 4.95) 0.3]
EPS
7.232 0 7.232s= + +
s=
EPS
14.464
s=
EPS
3.803
60%
s= – – ´ + – ´ + – ´
2 2 2
EPS
[( 1.58 5.18) 0.3] [(5.18 5.18) 0.4] [(11.930 5.18) 0.3]
s= + +
EPS
13.669 0 13.669
s=
EPS
27.338
EPS
5.229s=
(3)
Debt Ratio EPS E(EPS) CV
0% 2.091 3.60 0.581
15% 2.463 4.03 0.611
30% 2.990 4.50 0.664
45% 3.803 4.95 0.768
60% 5.229 5.18 1.009
f. (1)
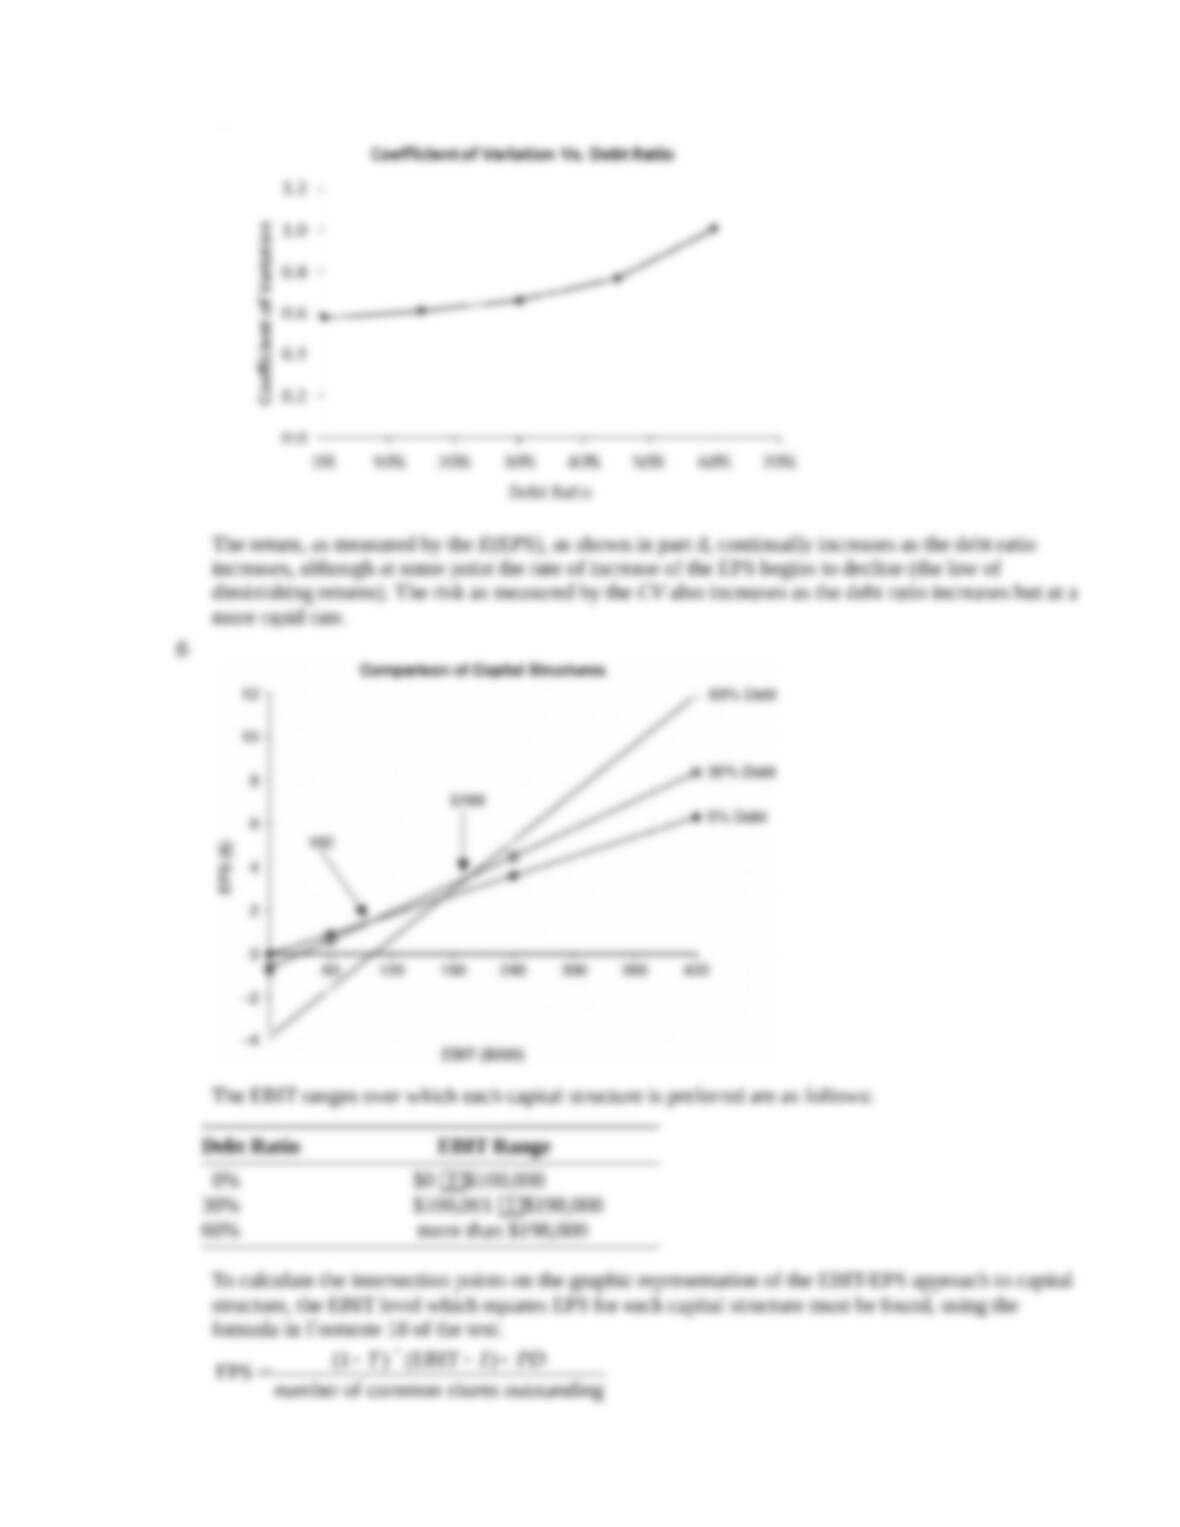
(2)
The return, as measured by the E(EPS), as shown in part d, continually increases as the debt ratio
increases, although at some point the rate of increase of the EPS begins to decline (the law of
diminishing returns). The risk as measured by the CV also increases as the debt ratio increases but at a
more rapid rate.
g.
The EBIT ranges over which each capital structure is preferred are as follows:
Debt Ratio EBIT Range
0% $0 $100,000
30% $100,001 $198,000
60% more than $198,000
To calculate the intersection points on the graphic representation of the EBIT-EPS approach to capital
structure, the EBIT level which equates EPS for each capital structure must be found, using the
formula in Footnote 18 of the text.
– ´ – –
=(1 ) (EBIT )
EPS number of common shares outstanding
T I PD
Set EPS 0% EPS 30%
EPS 30% EPS 60%
The first calculation, EPS 0% EPS 30%, is illustrated:
– – –
=
0%
[(1 0.4)(EBIT $0) 0]
EPS 40,000 shares
– – –
=
30%
[(1 0.4)(EBIT $30,000) 0]
EPS 28,000 shares
16,800 EBIT 24,000 EBIT 720,000,000= –
720,000,000
EBIT= $100,000
7,200 =
The major problem with this approach is that is does not consider maximization of shareholder wealth
(i.e., share price).
h.
Debt Ratio EPS rsShare Price
0% $3.60 0.100 $36.00
15% $4.03 0.105 $38.38
30% $4.50 0.116 $38.79
45% $4.95 0.140 $35.36
60% $5.18 0.200 $25.90
i. To maximize EPS, the 60% debt structure is preferred.
To maximize share value, the 30% debt structure is preferred.
A capital structure with 30% debt is recommended because it maximizes share value and satisfies the
goal of maximization of shareholder wealth.
P13-28. Ethics problem
LG 3; Intermediate
Informaon asymmetry applies to situaons in which one party has more and beer informaon than the other
interested party(ies). This appears to be exactly the situaon in which managers overleverage or lead a buyout of
the company. Exisng bondholders and possibly stockholders are harmed by the !nancial risk of overleveraging,
and exisng stockholders are harmed if they accept a buyout price less than that warranted by accurate and
complete informaon.
The board of directors has a !duciary duty toward stockholders and, hopefully, bears an ethical concern toward
bondholders as well. The board can and should insist that management divulge all informaon it possesses on the
future plans and risks the company faces (although cauon to keep this out of the hands of competors is
warranted). The board should be cauous to select and retain chief execuve o#cers (CEOs) with high integrity and
connue to emphasize an ethical tone “at the top.” (Students will no doubt think of other creave mechanisms to
deal with this situaon.)
Case
Case studies are available on www.myfinancelab.com.
Evaluating Tampa Manufacturing’s Capital Structure
This case asks the student to evaluate Tampa Manufacturing’s current and proposed capital structures in terms of
maximization of EPS and financial risk before recommending one. It challenges the student to go beyond just the
numbers and consider the overall impact of his or her choices on the firm’s financial policies.
a. Times interest earned calculaons
Current
10% Debt
Alternative A
30% Debt
Alternative B
50% Debt
Debt $1,000,000 $3,000,000 $5,000,000
Coupon rate 0.09 0.10 0.12
Interest $ 90,000 $ 300,000 $ 600,000
EBIT $1,200,000 $1,200,000 $1,200,000
Interest $ 90,000 $ 300,000 $ 600,000
Times interest earned 13.33 4 2
As the debt rao increases from 10% to 50%, so do both !nancial leverage and risk. At 10% debt
and $1,200,000 EBIT, the !rm has more than 13 mes coverage of interest payments; at 30%, it sll has
4 mes coverage. At 50% debt, the highest !nancial leverage, coverage drops to 2 mes, which may not provide
enough cushion. Both the mes interest earned and debt raos should be compared to those of the prinng equipment
industry.
b. EBIT-EPS calculaons (using any two EBIT levels)
Current 10% Debt
100,000 Shares
Alternative A: 30% Debt
70,000 Shares
Alternative B: 50% Debt
40,000 Shares
EBIT $600,000 $1,200,000 $600,000 $1,200,000 $600,000 $1,200,000
Interest 90,000 90,000 300,000 300,000 600,000 600,000
PBT $510,000 $1,110,000 $300,000 $ 900,000 $ 0 $ 600,000
Taxes 204,000 444,000 120,000 360,000 0 240,000
PAT $306,000 $ 666,000 $180,000 $ 540,000 $ 0 $ 360,000
EPS $3.06 $ 6.66 $ 2.57 $ 7.71 0 $ 9.00
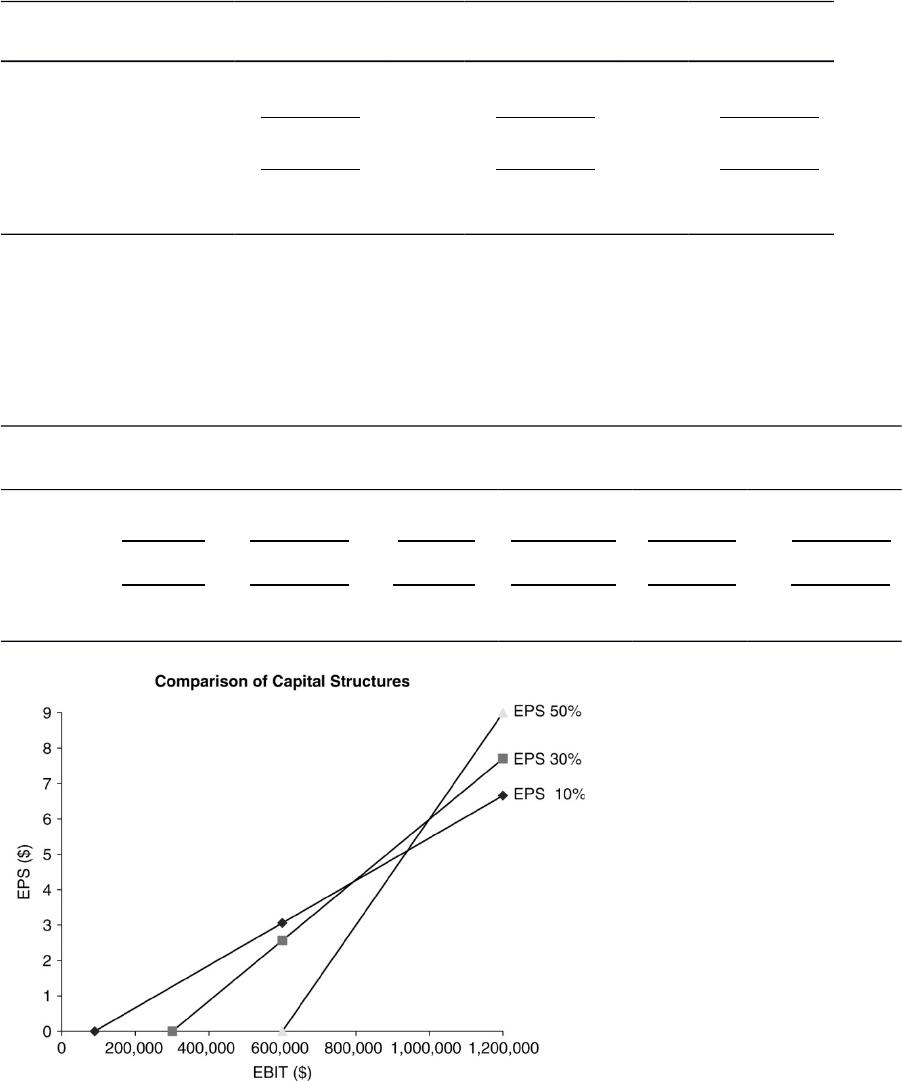
c. If Tampa Manufacturing’s EBIT is $1,200,000, EPS is highest with the 50% debt rao. The steeper slope of the lines
represenng higher debt levels demonstrates that !nancial leverage increases as the debt rao increases. Although EPS
is highest at 50%, the company must also take into consideraon the !nancial risk of each alternave. The drawback to
the EBIT-EPS approach is its emphasis on maximizing EPS rather than owner’s wealth. It does not take risk into account.
Also, if EBIT falls below about $750,000 (intersecon of 10% and 30% debt), EPS is higher with a capital structure of
10%.
d. Market value: P0 EPS rs
Current: $6.66 0.12 $55.50
Alternative A—30%: $7.71 0.13 $59.31
Alternative B—50%: $9.00 0.18 $50.00
e. Alternave A, 30% debt, appears to be the best alternave. Although EPS is higher with Alternave B, the !nancial risk
is high; mes interest earned is only 2 mes. Alternave A has a moderate risk level, with 4 mes coverage of interest
earned, and provides increased market value. Choosing this capital structure allows the !rm to bene!t from !nancial
leverage while not taking on too much !nancial risk.
Spreadsheet Exercise
The answer to Chapter 13’s determination of the optimal capital structure at Starstruck Company spreadsheet
problem is located on the Instructor’s Resource Center at www pearsonhighered.com/irc under the Instructor’s
Manual.
Group Exercise
Group exercises are available on www.myfinancelab.com.
This chapter links with the previous chapter to continue the valuation process of the firm. The first step is to
retrieve the most recent income statement of their shadow firm. The most important measures from the income
statement include measures of leverage such as EBIT, and fixed and variable operating costs. Using this
information, a similar income statement is designed for the fictitious firm.
After assigning a per-unit price for their product the groups, calculate the operating breakeven point of their
fictitious firm. This should be done using a simple graph of sales revenue and total operating costs, highlighting
the breakeven sales unit level. Next, the groups are required to calculate the DOL at a base sales level.
Returning to their shadow firm, the groups are required to calculate the firm’s DFL at its current levels of EPS and
EBIT. Likewise, the groups are asked to calculate the shadow firm’s DTL at current sales and EPS levels. Equation
13.11 is then used to value the shadow firm and the group’s fictitious firm, using information previously estimated
in earlier assignments. The complexity of this assignment can be mitigated through use of a real-world example.