P13-6. Breakeven point—changing costs/revenues
LG 1; Intermediate
a. Q F (P VC)Q $40,000 ($10 $8.00) 20,000 books
b. Q $44,000 ($10 − $8.00) 22,000 books
c. Q $40,000 ($10.50 − $8.00) 16,000 books
d. Q $40,000 ($10 − $8.50) 26,667 books
e. The operating breakeven point is directly related to fixed and variable costs and inversely related to
selling price. Increases in costs raise the operating breakeven point, while increases in price lower it.
P13-7. Breakeven analysis
LG 1; Challenge
a.
= = =
– –
$4,000 2,000 figurines
( ) $8.00 $6.00
FC
QP VC
b. Sales $10,000
Less:
Fixed costs 4,000
Variable costs ($6 1,500) 9,000
EBIT $3,000
c. Sales $15,000
Less:
Fixed costs 4,000
Variable costs ($6 1,500) 9,000
EBIT $2,000
d.
+ +
= = = =
– –
EBIT $4,000 $4,000 $8,000 4,000 units
$8 $6 $2
FC
QP VC
e. One alternative is to price the units differently based on the variable cost of the unit. Those more
costly to produce will have higher prices than the less expensive production models. If they wish to
maintain the same price for all units they may need to reduce the selection from the 15 types currently
available to a smaller number that includes only those that have an average variable cost below $5.33
($8 $4,000/1,500 units).
P13-8. EBIT sensitivity
LG 2; Intermediate
a. and b.
8,000 Units 10,000 Units 12,000 Units
Sales $72,000 $90,000 $108,000
Less: Variable costs 40,000 50,000 60,000
Less: Fixed costs 20,000 20,000 20,000
EBIT $12,000 $20,000 $ 28,000
c.
Unit Sales 8,000 10,000 12,000
Percentage (8,000 10,000) 10,000 (12,000 10,000) 10,000
© 2015 Pearson Education, Inc.
Change in
unit sales 20% 0 20%
Percentage (12,000 20,000) 20,000 (28,000 20,000) 20,000
Change in
EBIT 40% 0 40%
d. EBIT is more sensitive to changing sales levels; it increases/decreases twice as much as sales.
P13-9. DOL
LG 2; Intermediate
a.
$380,000 8,000 units
( ) $63.50 $16.00
FC
QP VC
= = =
– –
9,000 Units 10,000 Units 11,000 Units
b.
Sales $571,500 $635,000 $698,500
Less: Variable costs 144,000 160,000 176,000
Less: Fixed costs 380,000 380,000 380,000
EBIT $ 47,500 $ 95,000 $142,500
c.
Change in unit sales 1,000 0 1,000
% change in sales 1,000 10,000 10% 0 1,000 10,000 10%
Change in EBIT $47,500 0 $47,500
% Change in EBIT $47,500 95,000 = 50% 0 $47,500 95,000 = 50%
d.
% change in EBIT
% change in sales
50 10 5 50 10 5
e.
´ –
=´ – –
[ ( )]
DOL [ ( )]
Q P VC
Q P VC FC
´ –
=´ – –
[10,000 ($63.50 $16.00)]
DOL [10,000 ($63.50 $16.00) $380,000]
= =
$475,000
DOL 5.00
$95,000
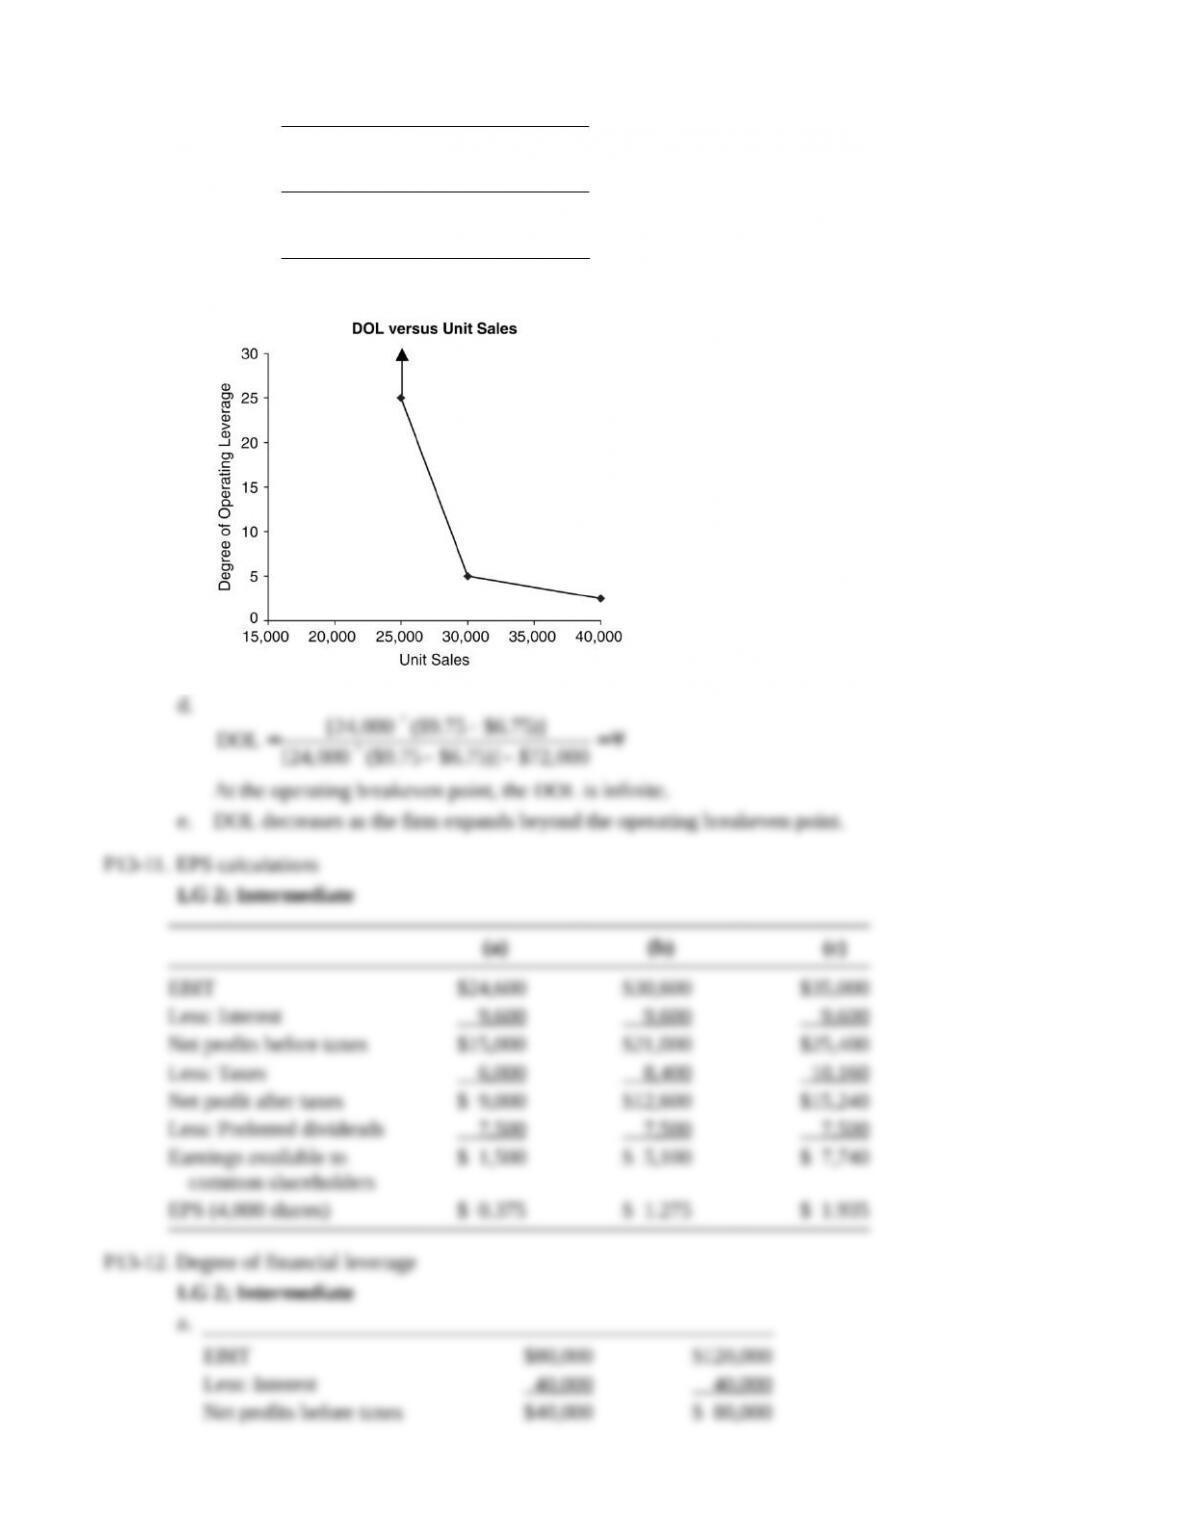
P13-10. DOL—graphic
LG 2; Intermediate
a.
$72,000 24,000 units
( ) $9.75 $6.75
FC
QP VC
= = =
– –
b.
´ –
=´ – –
[ ( )]
DOL [ ( )]
Q P VC
Q P VC FC
´ –
= =
´ – –
[25,000 ($9.75 $6.75)]
DOL 25.0
[25,000 ($9.75 $6.75)] $72,000
´ –
= =
´ – –
[30,000 ($9.75 $6.75)]
DOL 5.0
[30,000 ($9.75 $6.75)] $72,000
´ –
= =
´ – –
[40,000 ($9.75 $6.75)]
DOL 2.5
[40,000 ($9.75 $6.75)] $72,000
c.
d.
´ –
= =¥
´ – –
[24,000 ($9.75 $6.75)]
DOL [24,000 ($9.75 $6.75)] $72,000
At the operating breakeven point, the DOL is infinite.
e. DOL decreases as the firm expands beyond the operating breakeven point.
P13-11. EPS calculations
LG 2; Intermediate
(a) (b) (c)
EBIT $24,600 $30,600 $35,000
Less: Interest 9,600 9,600 9,600
Net profits before taxes $15,000 $21,000 $25,400
Less: Taxes 6,000 8,400 10,160
Net profit after taxes $ 9,000 $12,600 $15,240
Less: Preferred dividends 7,500 7,500 7,500
Earnings available to
common shareholders
$ 1,500 $ 5,100 $ 7,740
EPS (4,000 shares) $ 0.375 $ 1.275 $ 1.935
P13-12. Degree of financial leverage
LG 2; Intermediate
a.
EBIT $80,000 $120,000
Less: Interest 40,000 40,000
Net profits before taxes $40,000 $ 80,000
Less: Taxes (40%) 16,000 32,000
Net profit after taxes $24,000 $ 48,000
EPS (2,000 shares) $ 12.00 $ 24.00
b.
EBIT
DFL 1
EBIT (1 )
I PD T
=é ù
æ ö
– – ´
ê ú
ç ÷
–
è ø
ë û
= =
– –
$80,000
DFL 2
[$80,000 $40,000 0]
c.
EBIT $80,000 $120,000
Less: Interest 16,000 16,000
Net profits before taxes $64,000 $104,000
Less: Taxes (40%) 25,600 41,600
Net profit after taxes $38,400 $ 62,400
EPS (3,000 shares) $ 12.80 $ 20.80
= =
– –
$80,000
DFL 1.25
[$80,000 $16,000 0]
P13-13. Personal finance: Financial leverage
LG 2; Challenge
a.
Current DFL Initial Values Future Value
Percentage
Change
Available for making loan payment
Less: Loan payments
Available after loan payments
$3,000
$1,000
$2,000
$3,300
$1,000
$2,300
10.0%
0.0%
15.0%
DFL 15% ÷ 10% 1.50
Proposed DFL Initial Values Future Value
Percentage
Change
Available for making loan payment
Less: Loan payments
Available after loan payments
$3,000
$1,350
$1,650
$3,300
$1,350
$1,950
10.0%
0.0%
18.2%
DFL 18.2% ÷ 10% 1.82
b. and c. Based on his calculations, the amount that Max will have available after loan payments with his
current debt changes by 1.5% for every 1% change in the amount he will have available for making
the loan payment. This is less responsive and therefore less risky than the 1.82% change in the amount
available after making loan payments with the proposed $350 in monthly debt payments. Although it
appears that Max can afford the additional loan payments, he must decide if, given the variability of
Max’s income, he would feel comfortable with the increased financial leverage and risk.
P13-14. DFL and graphic display of financing plans
LG 2, 5; Challenge
a.
=é ù
æ ö
– – ´
ê ú
ç ÷
–
è ø
ë û
EBIT
DFL 1
EBIT (1 )
I PD T
= =
– –
$67,500
DFL 1.5
[$67,500 $22,500 0]
b.
c.
= =
é ù
– –
ê ú
ë û
$67,500
DFL 1.93
$6,000
$67,500 $22,500 0.6
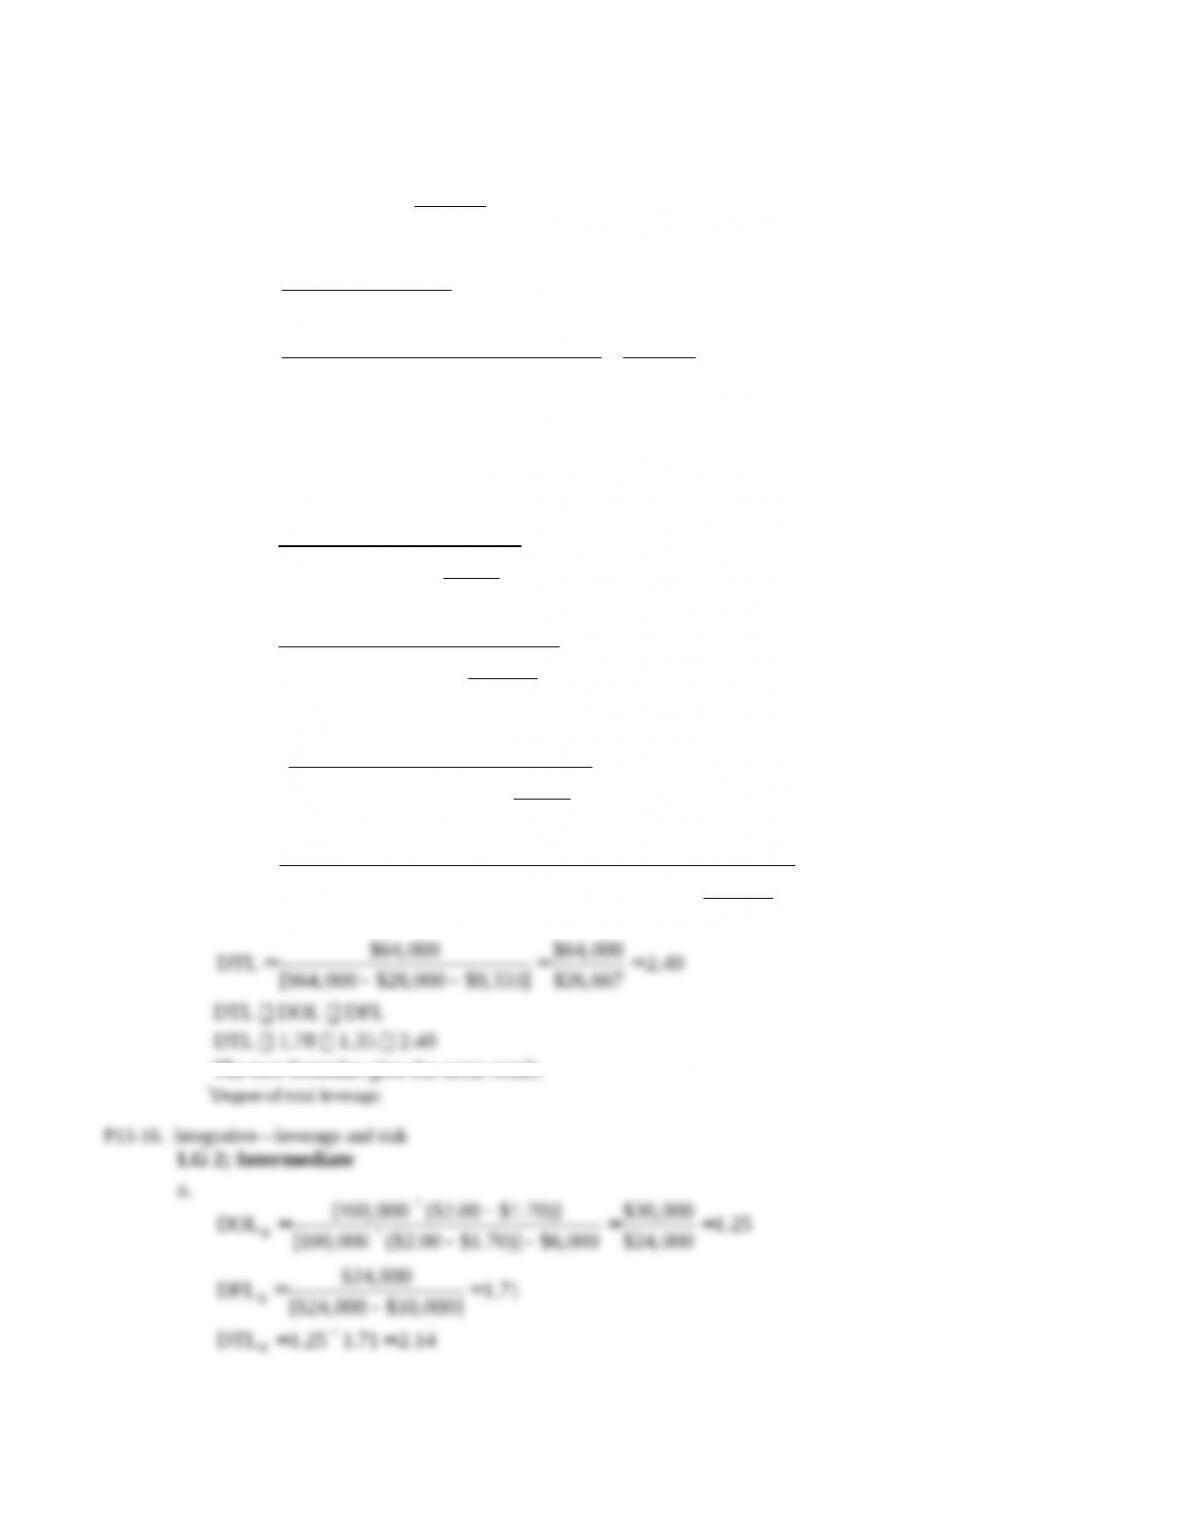
d. See graph, which is based on the following equation and data points.
Financing EBIT EPS
Original
financing
plan
$67,500
($67,000 $22,500)(1 0.4) $1.80
15,000
– – =
$17,500
($17,500 $22,500)(1 0.4) $0.20
15,000
– – =–
Revised
financing
plan
$67,500
($67,000 $22,500)(1 0.4) 6,000 $1.40
15,000
– – – =
$17,500
($17,500 $22,500)(1 0.4) 6,000 $0.60
15,000
– – – =–
e. The lines representing the two financing plans are parallel because the number of shares of common
stock outstanding is the same in each case. The financing plan, including the preferred stock, results
in a higher financial breakeven point and a lower EPS at any EBIT level.
P13-15. Integrative—multiple leverage measures
LG 1, 2; Intermediate
a.
$28,000
Operating breakeven 175,000 units
$0.16
= =
b.
´ –
=´ – –
[ ( )]
DOL [ ( )]
Q P VC
Q P VC FC
´ –
= = =
´ – –
[400,000 ($1.00 $0.84)] $64,000
DOL 1.78
[400,000 ($1.00 $0.84)] $28,000 $36,000
c. EBIT (P Q) FC (Q VC)
EBIT ($1.00 400,000) $28,000 (400,000 $0.84)
EBIT $400,000 $28,000 $336,000
EBIT $36,000
=é ù
æ ö
– – ´
ê ú
ç ÷
–
è ø
ë û
EBIT
DFL 1
EBIT (1 )
I PD T
= =
é ù
æ ö
– –
ê ú
ç ÷
–
è ø
ë û
$36,000
DFL 1.35
$2,000
$36,000 $6,000 (1 0.4)
d.
*
[ ( )]
DTL
( ) (1 )
Q P VC
PD
Q P VC FC I T
´ –
=é ù
æ ö
´ – – – –
ê ú
ç ÷
–
è ø
ë û
´ –
=é ù
æ ö
´ – – – –
ê ú
ç ÷
–
è ø
ë û
[400,000 ($1.00 $0.84)]
DTL $2,000
400,000 ($1.00 $0.84) $28,000 $6,000 (1 0.4)
= = =
– –
$64,000 $64,000
DTL 2.40
[$64,000 $28,000 $9,333] $26,667
DTL DOL DFL
DTL 1.78 1.35 2.40
The two formulas give the same result.
*Degree of total leverage.
P13-16. Integrative—leverage and risk
LG 2; Intermediate
a.
´ –
= = =
´ – –
[100,000 ($2.00 $1.70)] $30,000
DOL 1.25
[100,000 ($2.00 $1.70)] $6,000 $24,000
R
= =
–
$24,000
DFL 1.71
[$24,000 $10,000]
R
= ´ =DTL 1.25 1.71 2.14
R
b.
´ –
= = =
´ – –
[100,000 ($2.50 $1.00)] $150,000
DOL 1.71
[100,000 ($2.50 $1.00)] $62,500 $87,500
W
= =
–
$87,500
DFL 1.25
[$87,500 $17,500]
W
= ´ =DTL 1.71 1.25 2.14
R
c. Firm R has less operating (business) risk but more financial risk than Firm W.
d. Two firms with differing operating and financial structures may be equally leveraged. Because total
leverage is the product of operating and financial leverage, each firm may structure itself differently
and still have the same amount of total risk.
P13-17. Integrative—multiple leverage measures and prediction
LG 1, 2; Challenge
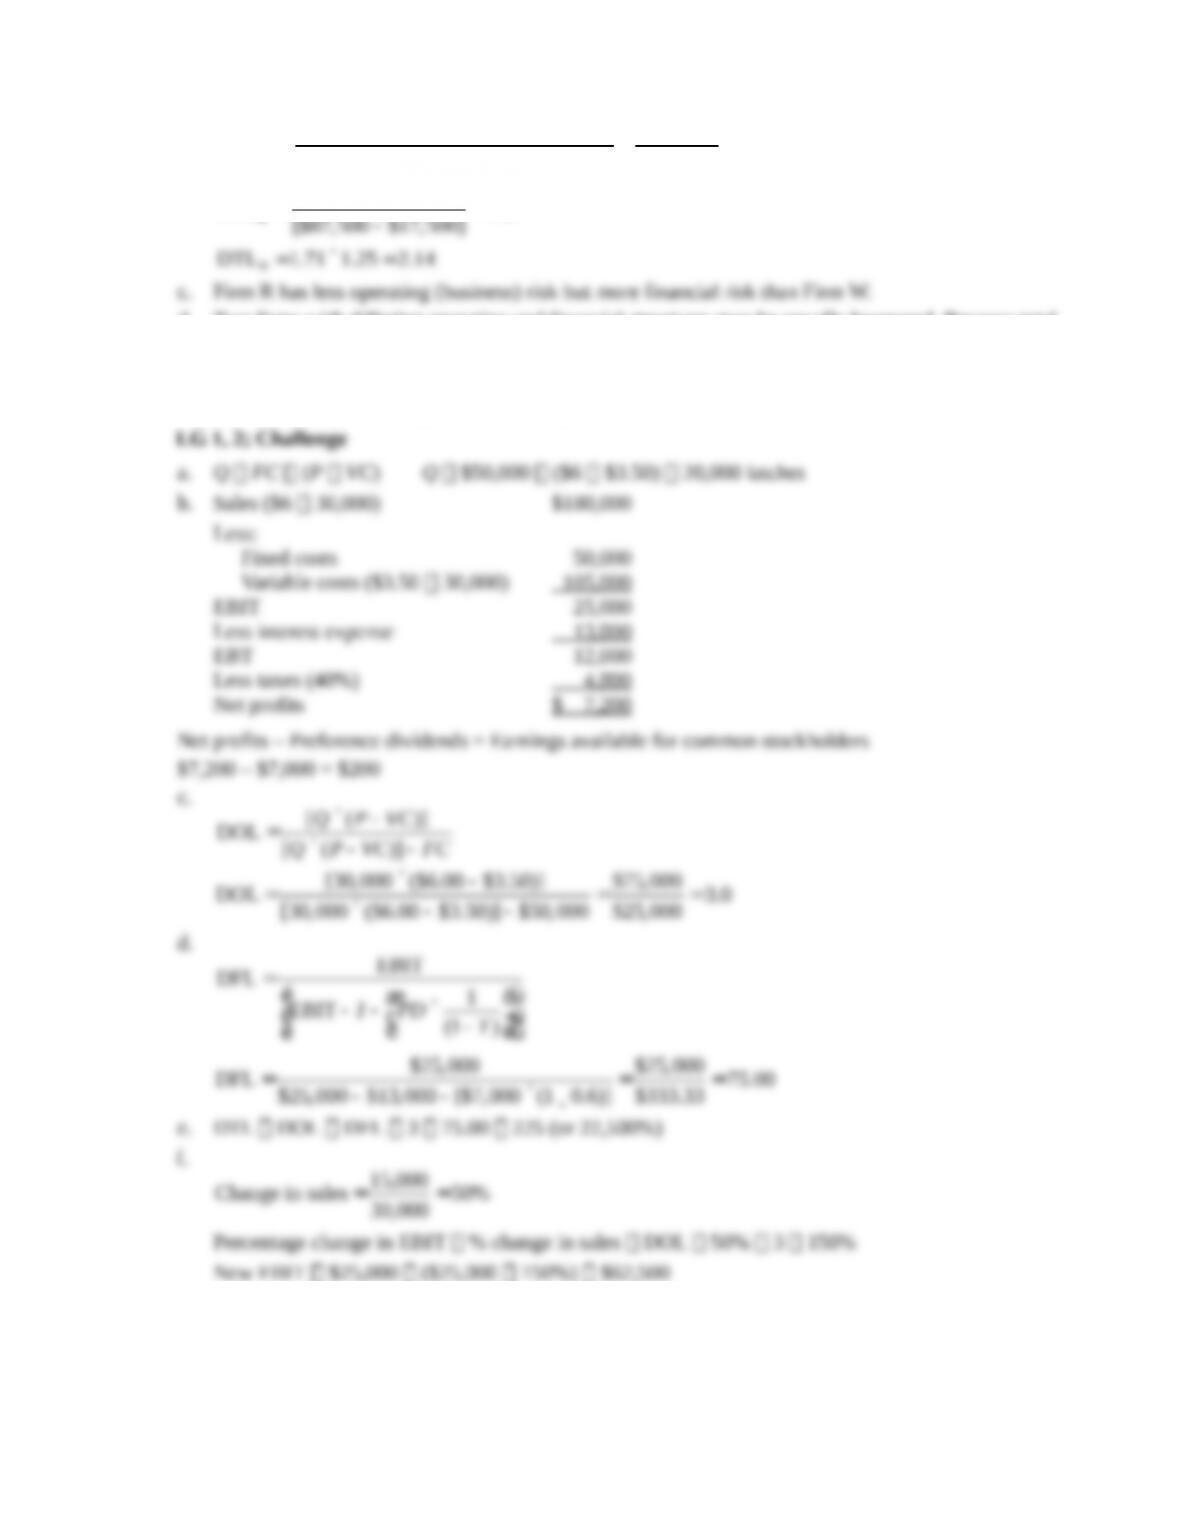
a. Q FC (P VC) Q $50,000 ($6 $3.50) 20,000 latches
b. Sales ($6 30,000) $180,000
Less:
Fixed costs 50,000
Variable costs ($3.50 30,000) 105,000
EBIT 25,000
Less interest expense 13,000
EBT 12,000
Less taxes (40%) 4,800
Net profits $ 7,200
Net profits – Preference dividends = Earnings available for common stockholders
$7,200 – $7,000 = $200
c.
´ –
=´ – –
[ ( )]
DOL [ ( )]
Q P VC
Q P VC FC
´ –
= = =
´ – –
[30,000 ($6.00 $3.50)] $75,000
DOL 3.0
[30,000 ($6.00 $3.50)] $50,000 $25,000
d.
=é ù
æ ö
– – ´
ê ú
ç ÷
–
è ø
ë û
EBIT
DFL 1
EBIT (1 )
I PD T
= = =
– – ´ ¸
$25,000 $25,000
DFL 75.00
$25,000 $13,000 [$7,000 (1 0.6)] $333.33
e. DTL DOL DFL 3 75.00 225 (or 22,500%)
f.
15,000
Change in sales 50%
30,000
= =
Percentage change in EBIT % change in sales DOL 50% 3 150%
New EBIT $25,000 ($25,000 150%) $62,500
Percentage change in earnings available for common % changesales DTL
50% 225% 11,250%
New earnings available for common $200 ($200 11,250%) $22,700
P13-18. Personal finance: Capital structures
LG 3; Intermediate
a. Monthly mortgage payment ÷ Monthly gross income = $1,100 ÷ $4,500 = 24.44%
Kirsten’s ratio is less than the bank maximum of 28%.
b. Total monthly installment payment ÷ Monthly gross income
($375 + $1,100) ÷ $4,500 32.8%.
Kirsten’s ratio is less than the bank maximum of 37.0%. Because Kirsten’s debt-related expenses as a
percentage of her monthly gross income are less than bank-specified maximums, her loan application
should be accepted.
P13-19. Various capital structures
LG 3; Basic
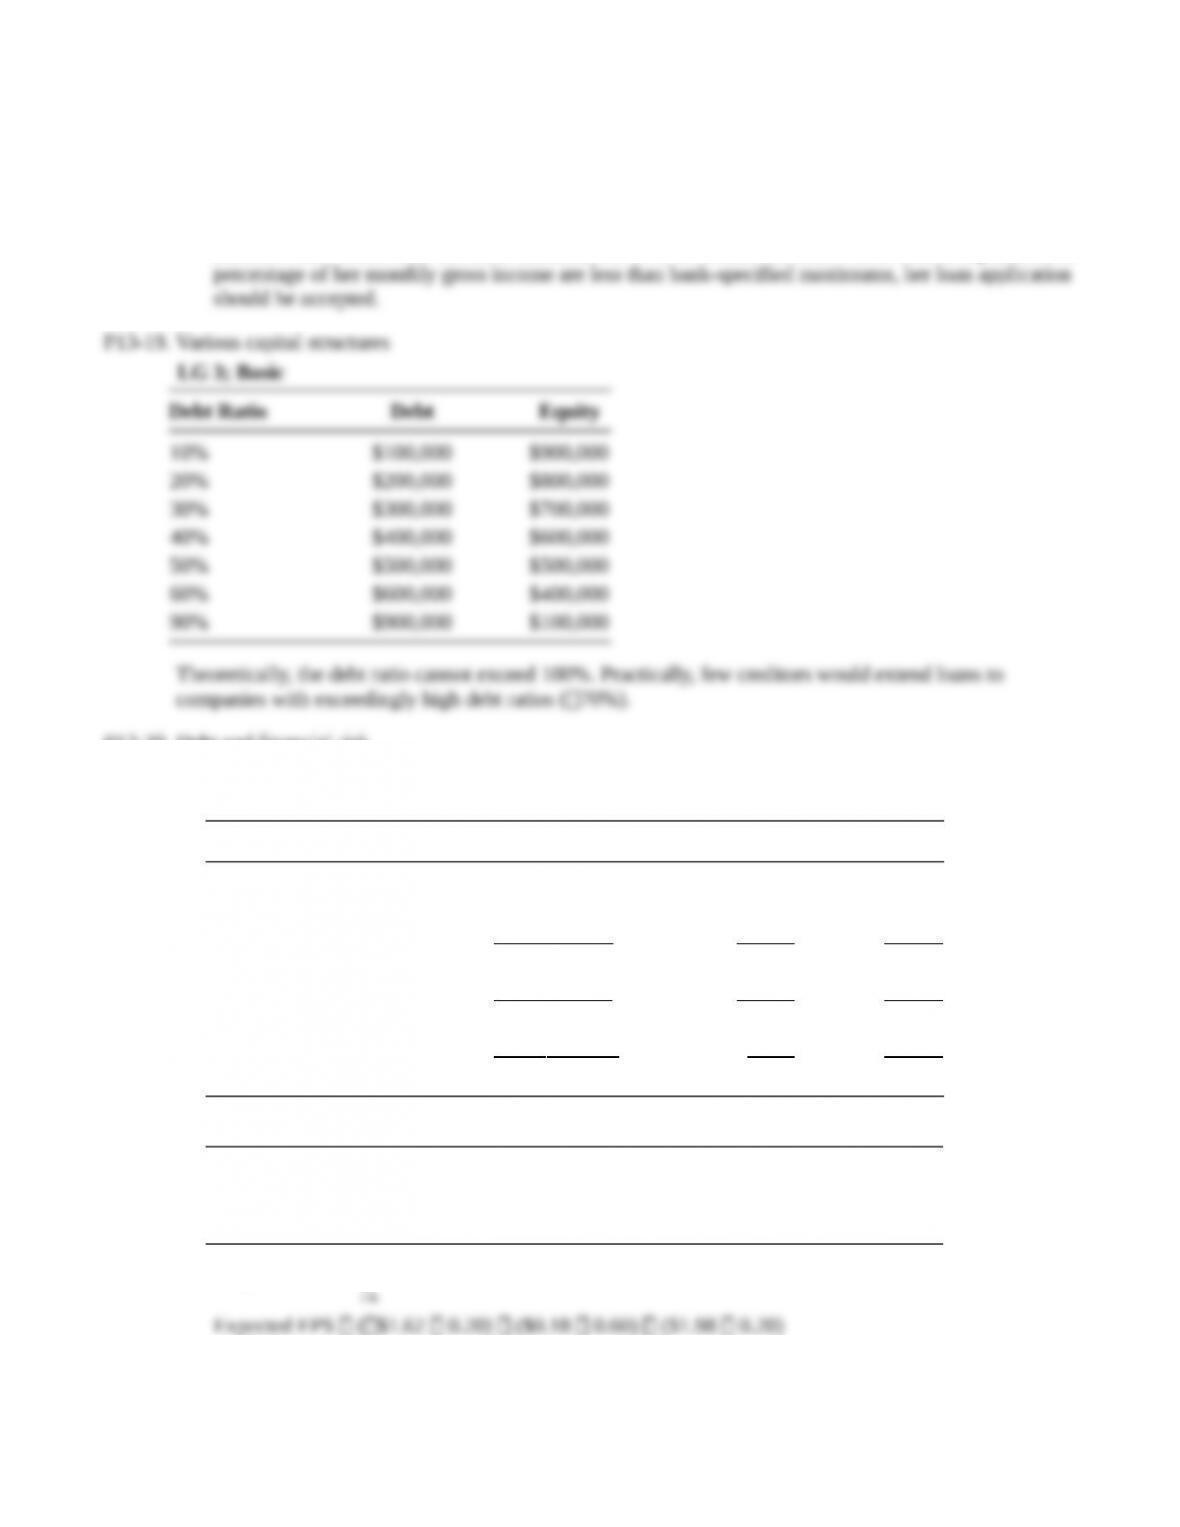
Debt Ratio Debt Equity
10% $100,000 $900,000
20% $200,000 $800,000
30% $300,000 $700,000
40% $400,000 $600,000
50% $500,000 $500,000
60% $600,000 $400,000
90% $900,000 $100,000
Theoretically, the debt ratio cannot exceed 100%. Practically, few creditors would extend loans to
companies with exceedingly high debt ratios (70%).
P13-20. Debt and financial risk
LG 3; Challenge
a. EBIT Calculation
Probability 0.20 0.60 0.20
Sales $200,000 $300,000 $400,000
Less: Variable costs (70%) 140,000 210,000 280,000
Less: Fixed costs 75,000 75,000 75,000
EBIT $(15,000) $ 15,000 $ 45,000
Less: Interest 12,000 12,000 12,000
Earnings before taxes $(27,000) $ 3,000 $ 33,000
Less: Taxes (10,800) 1,200 13,200
Earnings after taxes $(16,200) $ 1,800 $ 19,800
b. EPS
Earnings after taxes $(16,200) $ 1,800 $ 19,800
Number of shares 10,000 10,000 10,000
EPS $ (1.62) $ 0.18 $ 1.98
=
= ´
å
1
Expected EPS EPS Pr
n
j j
i
Expected EPS ($1.62 0.20) ($0.18 0.60) ($1.98 0.20)
Expected EPS $0.324 $0.108 $0.396
Expected EPS $0.18
s
=
= – ´
å
2
EPS
1
(EPS EPS) Pr
n
i i
i
s= – – ´ + – ´ + – ´
2 2 2
EPS
[( $1.62 $0.18) 0.20] [($0.18 $0.18) 0.60] [($1.98 $0.18) 0.20]
s= ´ + + ´EPS ($3.24 0.20) 0 ($3.24 0.20)
s= +
EPS
$0.648 $0.648
s= =
EPS
$1.296 $1.138
s
= = =
EPS
EPS
1.138 6.32
Expected EPS 0.18
CV
c.
EBIT *$(15,000) $15,000 $45,000
Less: Interest 0 0 0
Net profit before taxes $(15,000) $15,000 $45,000
Less: Taxes (6,000) 6,000 18,000
Net profits after taxes $ (9,000) $ 9,000 $27,000
EPS (15,000 shares) $ (0.60) $ 0.60 $ 1.80
*From part a
Expected EPS ($0.60 0.20) ($0.60 0.60) ($1.80 0.20) $0.60
2 2 2
EPS
[( $0.60 $0.60) 0.20] [($0.60 $0.60) 0.60] [($1.80 $0.60) 0.20]s= – – ´ + – ´ + – ´
s= ´ + + ´EPS ($1.44 0.20) 0 ($1.44 0.20)
s= =
EPS
$0.576 $0.759
= =
EPS
$0.759 1.265
0.60
CV
d. Summary statistics
With Debt All Equity
Expected EPS $0.180 $0.600
EPS $1.138 $0.759
CVEPS 6.320 1.265
Including debt in Tower Interiors’ capital structure results in a lower expected EPS, a higher standard
deviation, and a much higher coefficient of variation than the all-equity structure. Eliminating debt
from the firm’s capital structure greatly reduces financial risk, which is measured by the coefficient of
variation.
P13-21. EPS and optimal debt ratio
LG 4; Intermediate
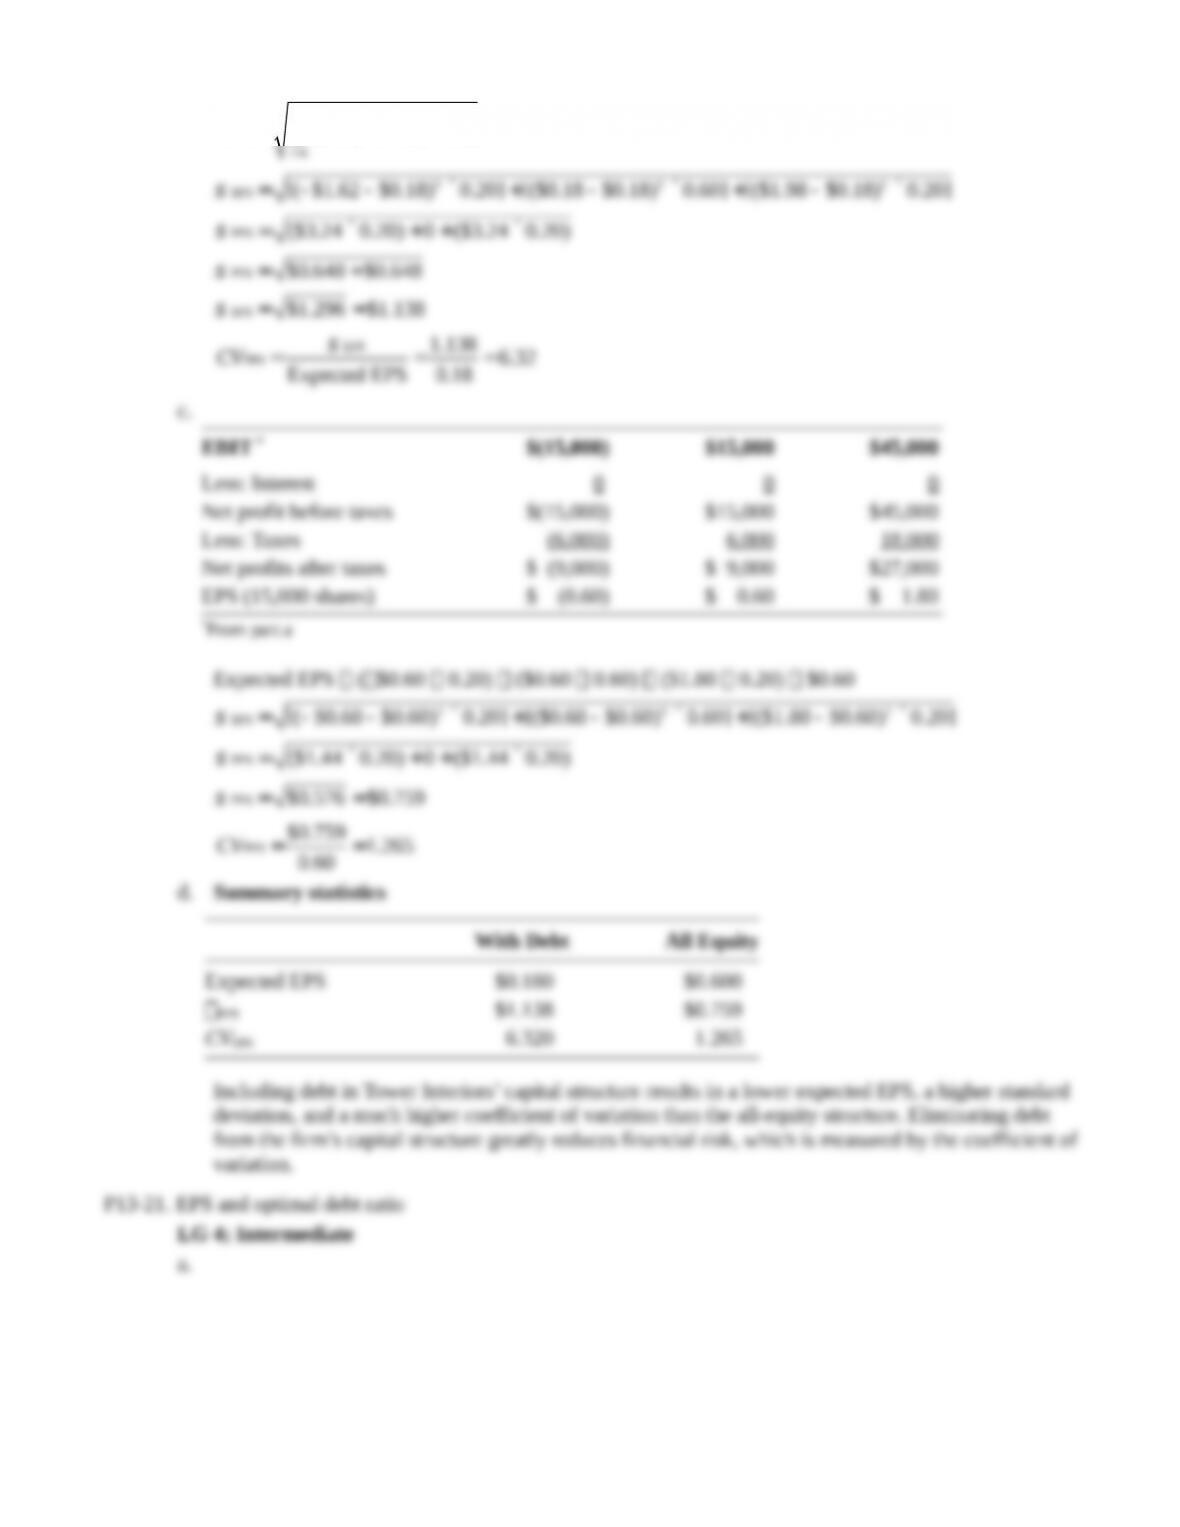
a.
Maximum EPS appears to be at 60% debt ratio, with $3.95 per share earnings.
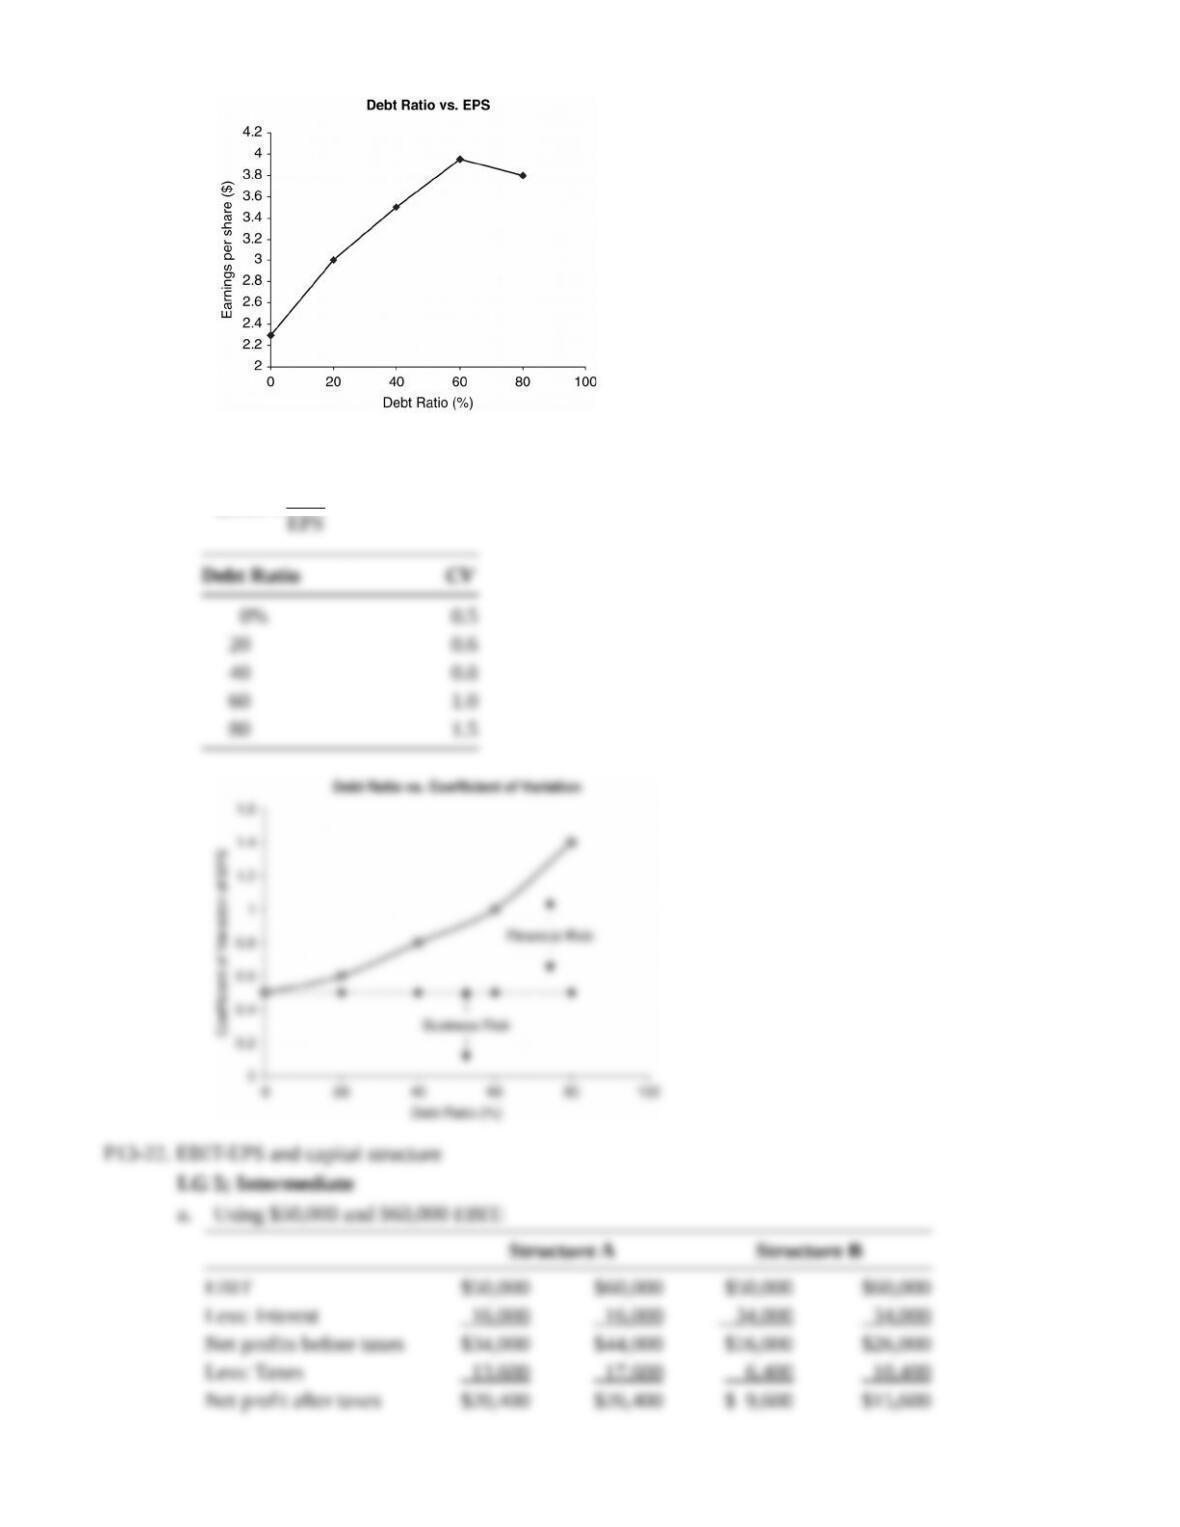
b.
s
=
EPS
EPS
EPS
CV
Debt Ratio CV
0% 0.5
20 0.6
40 0.8
60 1.0
80 1.5
P13-22. EBIT-EPS and capital structure
LG 5; Intermediate
a. Using $50,000 and $60,000 EBIT:
Structure A Structure B
EBIT $50,000 $60,000 $50,000 $60,000
Less: Interest 16,000 16,000 34,000 34,000
Net profits before taxes $34,000 $44,000 $16,000 $26,000
Less: Taxes 13,600 17,600 6,400 10,400
Net profit after taxes $20,400 $26,400 $ 9,600 $15,600
EPS (4,000 shares) $ 5.10 $ 6.60
EPS (2,000 shares) $ 4.80 $ 7.80
Financial breakeven points:
Structure A Structure B
$16,000 $34,000
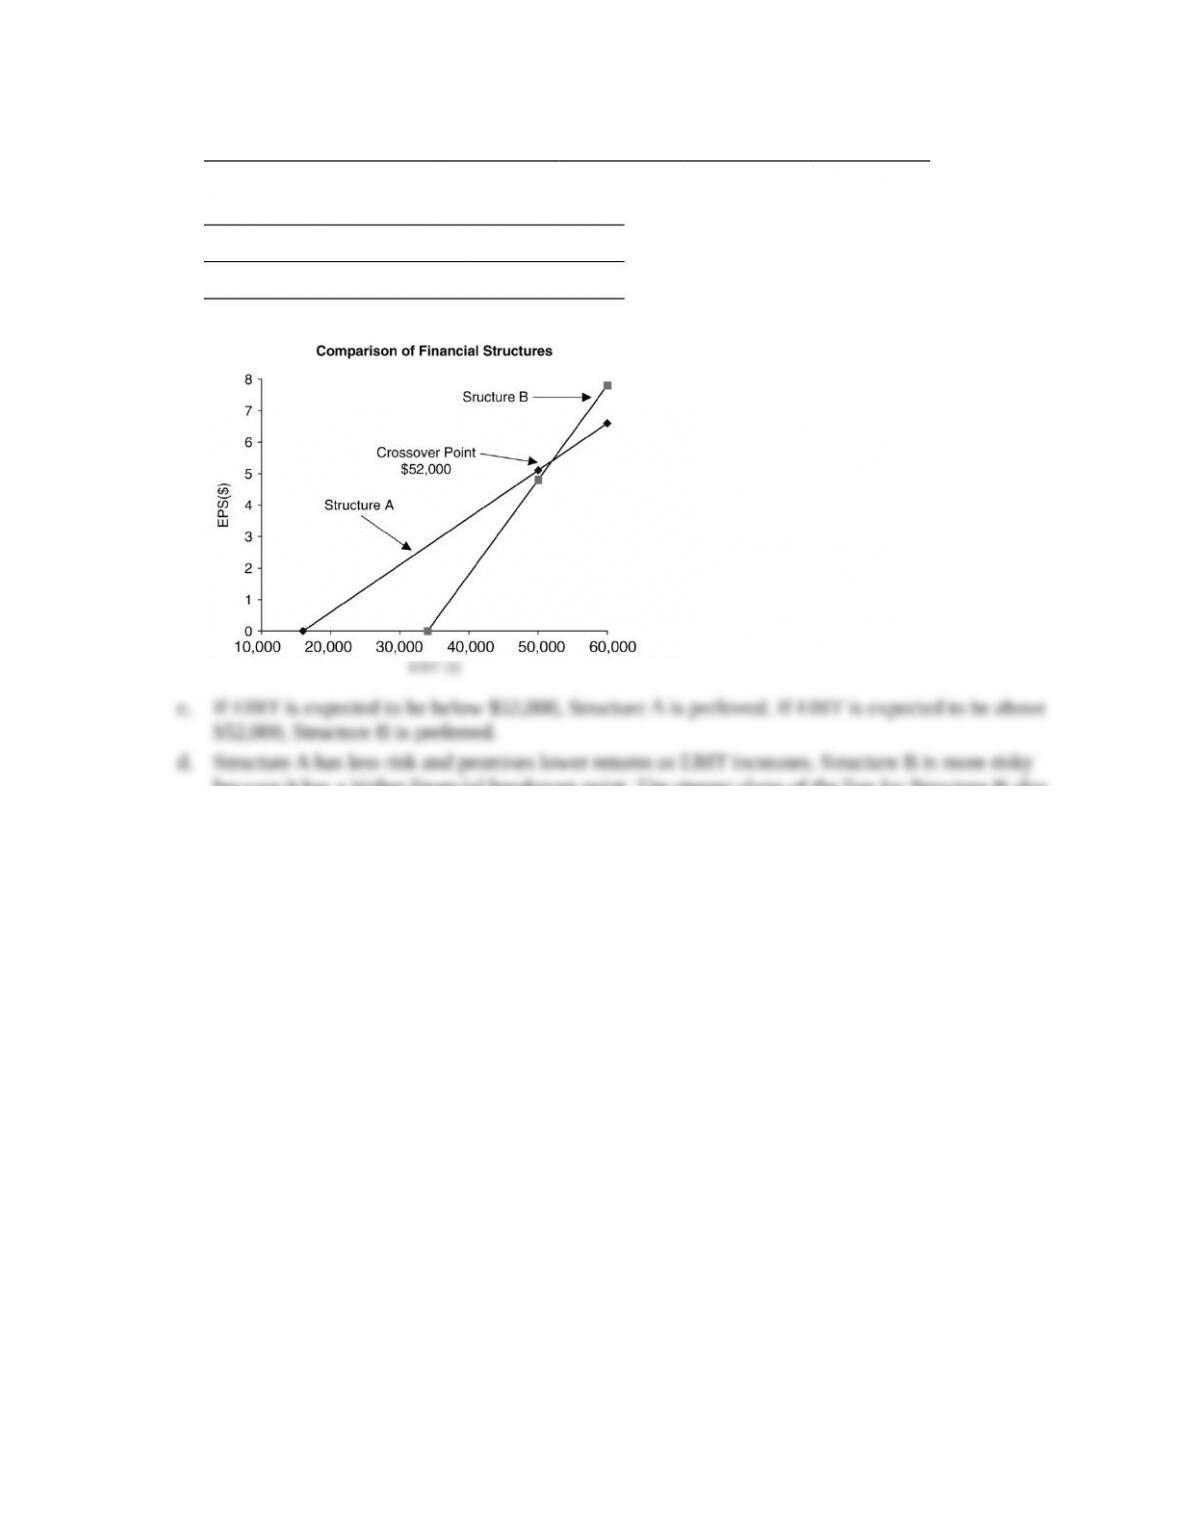
b.
c. If EBIT is expected to be below $52,000, Structure A is preferred. If EBIT is expected to be above
$52,000, Structure B is preferred.
d. Structure A has less risk and promises lower returns as EBIT increases. Structure B is more risky
because it has a higher financial breakeven point. The steeper slope of the line for Structure B also
indicates greater financial leverage.
e. If EBIT is greater than $75,000, Structure B is recommended because changes in EPS are much
greater for given values of EBIT.