9-1
CHAPTER 9
INVENTORY COSTING AND CAPACITY ANALYSIS
9-1 No. Differences in operating income between variable costing and absorption costing are
due to accounting for fixed manufacturing costs. Under variable costing, only variable
manufacturing costs are included as inventoriable costs. Under absorption costing, both variable
and fixed manufacturing costs are included as inventoriable costs. Fixed marketing and distribution
costs are not accounted for differently under variable costing and absorption costing.
9-2 The term direct costing is a misnomer for variable costing for two reasons:
a. Variable costing does not include all direct costs as inventoriable costs. Only variable
direct manufacturing costs are included. Any fixed direct manufacturing costs and any
direct nonmanufacturing costs (either variable or fixed) are excluded from
inventoriable costs.
b. Variable costing includes as inventoriable costs not only direct manufacturing costs but
also some indirect costs (variable indirect manufacturing costs).
9-3 No. The difference between absorption costing and variable costs is due to accounting for
fixed manufacturing costs. As service or merchandising companies have no fixed manufacturing
costs, these companies do not make choices between absorption costing and variable costing.
9-4 The main issue between variable costing and absorption costing is the proper timing of the
release of fixed manufacturing costs as costs of the period:
a. at the time of incurrence, or
b. at the time the finished units to which the fixed overhead relates are sold.
Variable costing uses (a) and absorption costing uses (b).
9-5 No. A company that makes a variable-cost/fixed-cost distinction is not forced to use any
specific costing method. The Stassen Company example in the text of Chapter 9 makes a variable-
cost/fixed-cost distinction. As illustrated, it can use variable costing, absorption costing, or
throughput costing.
A company that does not make a variable-cost/fixed-cost distinction cannot use variable
costing or throughput costing. However, it is not forced to adopt absorption costing. For internal
reporting, it could, for example, classify all costs as costs of the period in which they are incurred.
9-6 Variable costing does not view fixed costs as unimportant or irrelevant, but it maintains
that the distinction between behaviors of different costs is crucial for certain decisions. The
planning and management of fixed costs is critical, irrespective of what inventory costing method
is used.
9-7 Under absorption costing, heavy reductions of inventory during the accounting period
might combine with low production and a large production volume variance. This combination
could result in lower operating income even if the unit sales level rises.
9-2
9-8 (a) The factors that affect the breakeven point under variable costing are
1. fixed (manufacturing and operating) costs.
2. contribution margin per unit.
(b) The factors that affect the breakeven point under absorption costing are
1. fixed (manufacturing and operating) costs.
2. contribution margin per unit.
3. production level in units in excess of breakeven sales in units.
4. denominator level chosen to set the fixed manufacturing cost rate.
9-9 Examples of dysfunctional decisions managers may make to increase reported operating
income are:
a. Plant managers may switch production to those orders that absorb the highest amount
of fixed manufacturing overhead, irrespective of the demand by customers.
b. Plant managers may accept a particular order to increase production even though
another plant in the same company is better suited to handle that order.
c. Plant managers may defer maintenance beyond the current period to free up more time
for production.
9-10 Approaches used to reduce the negative aspects associated with using absorption costing
include:
a. Change the accounting system:
• Adopt either variable or throughput costing, both of which reduce the incentives of
managers to produce for inventory.
• Adopt an inventory holding charge for managers who tie up funds in inventory.
b. Extend the time period used to evaluate performance. By evaluating performance over
a longer time period (say, three to five years), the incentive to take short-run actions
that reduce long-term income is lessened.
c. Include nonfinancial as well as financial variables in the measures used to evaluate
performance.
9-11 The theoretical capacity and practical capacity denominator-level concepts emphasize
what a plant can supply. The normal capacity utilization and master-budget capacity utilization
concepts emphasize what customers demand for products produced by a plant.
9-12 The downward demand spiral is the continuing reduction in demand for a company’s
product that occurs when the prices of competitors’ products are not met, and (as demand drops
further) higher and higher unit costs result in more and more reluctance to meet competitors’
prices. Pricing decisions need to consider competitors and customers as well as costs.
9-13 No. It depends on how a company handles the production-volume variance in the end-of-
period financial statements. For example, if the adjusted allocation-rate approach is used, each
denominator-level capacity concept will give the same financial statement numbers at year-end.
9-14 For tax reporting in the United States, the IRS requires only that indirect production costs
are “fairly” apportioned among all items produced. Overhead rates based on normal or master–
budget capacity utilization, as well as the practical capacity concept, are permitted. At year-end,
proration of any variances between inventories and cost of goods sold is required (unless the
variance is immaterial in amount).
9-15 No. The costs of having too much capacity/too little capacity involve revenue opportunities
potentially forgone as well as costs of money tied up in plant assets.
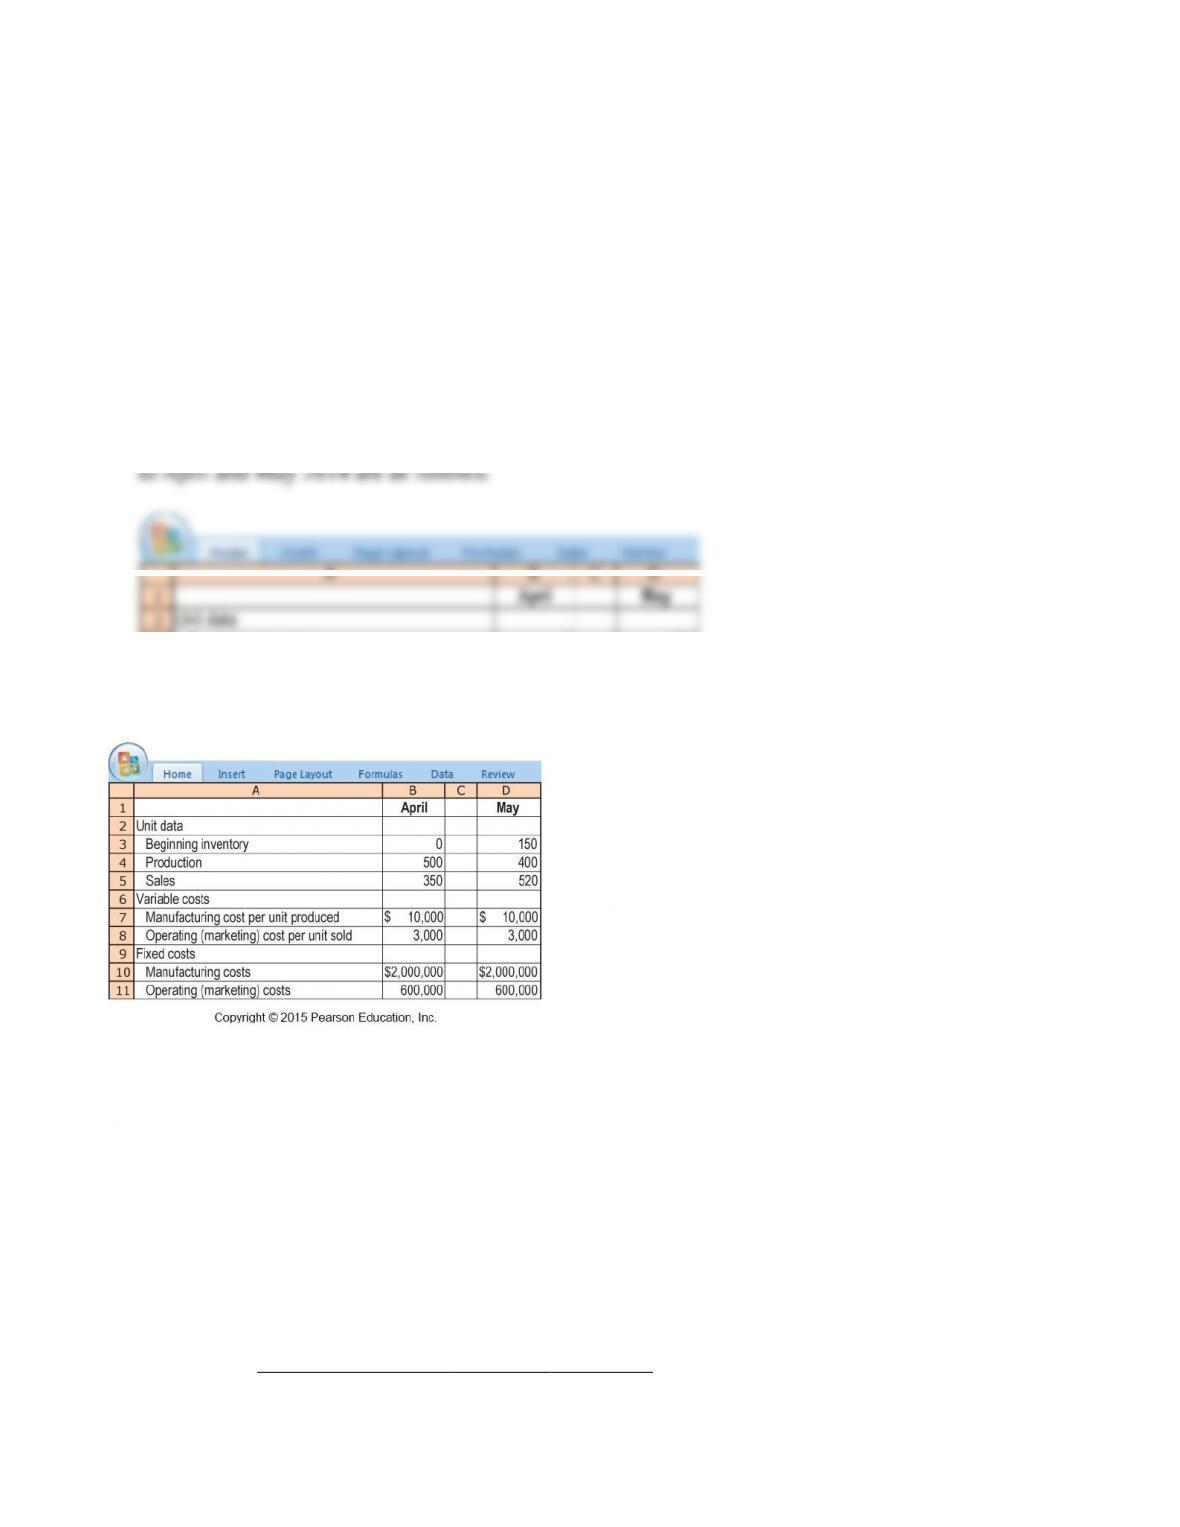
9-16 (30 min.) Variable and absorption costing, explaining operating–income differences.
Nascar Motors assembles and sells motor vehicles and uses standard costing. Actual data relating
to April and May 2014 are as follows:
The selling price per vehicle is $24,000. The budgeted level of production used to calculate the
budgeted fixed manufacturing cost per unit is 500 units. There are no price, efficiency, or spending
variances. Any production-volume variance is written off to cost of goods sold in the month in
which it occurs.
Required:
1. Prepare April and May 2014 income statements for Nascar Motors under (a) variable costing
and (b) absorption costing.
2. Prepare a numerical reconciliation and explanation of the difference between operating income
for each month under variable costing and absorption costing.
SOLUTION
1. Key inputs for income statement computations are
April
May
Beginning inventory
Production
Goods available for sale
Units sold
Ending inventory
0
500
500
350
150
150
400
550
520
30
The budgeted fixed cost per unit and budgeted total manufacturing cost per unit under absorption
costing are
April
May
(a) Budgeted fixed manufacturing costs
(b) Budgeted production
(c) = (a) ÷ (b) Budgeted fixed manufacturing cost per unit
(d) Budgeted variable manufacturing cost per unit
(e) = (c) + (d) Budgeted total manufacturing cost per unit
$2,000,000
500
$4,000
$10,000
$14,000
$2,000,000
500
$4,000
$10,000
$14,000
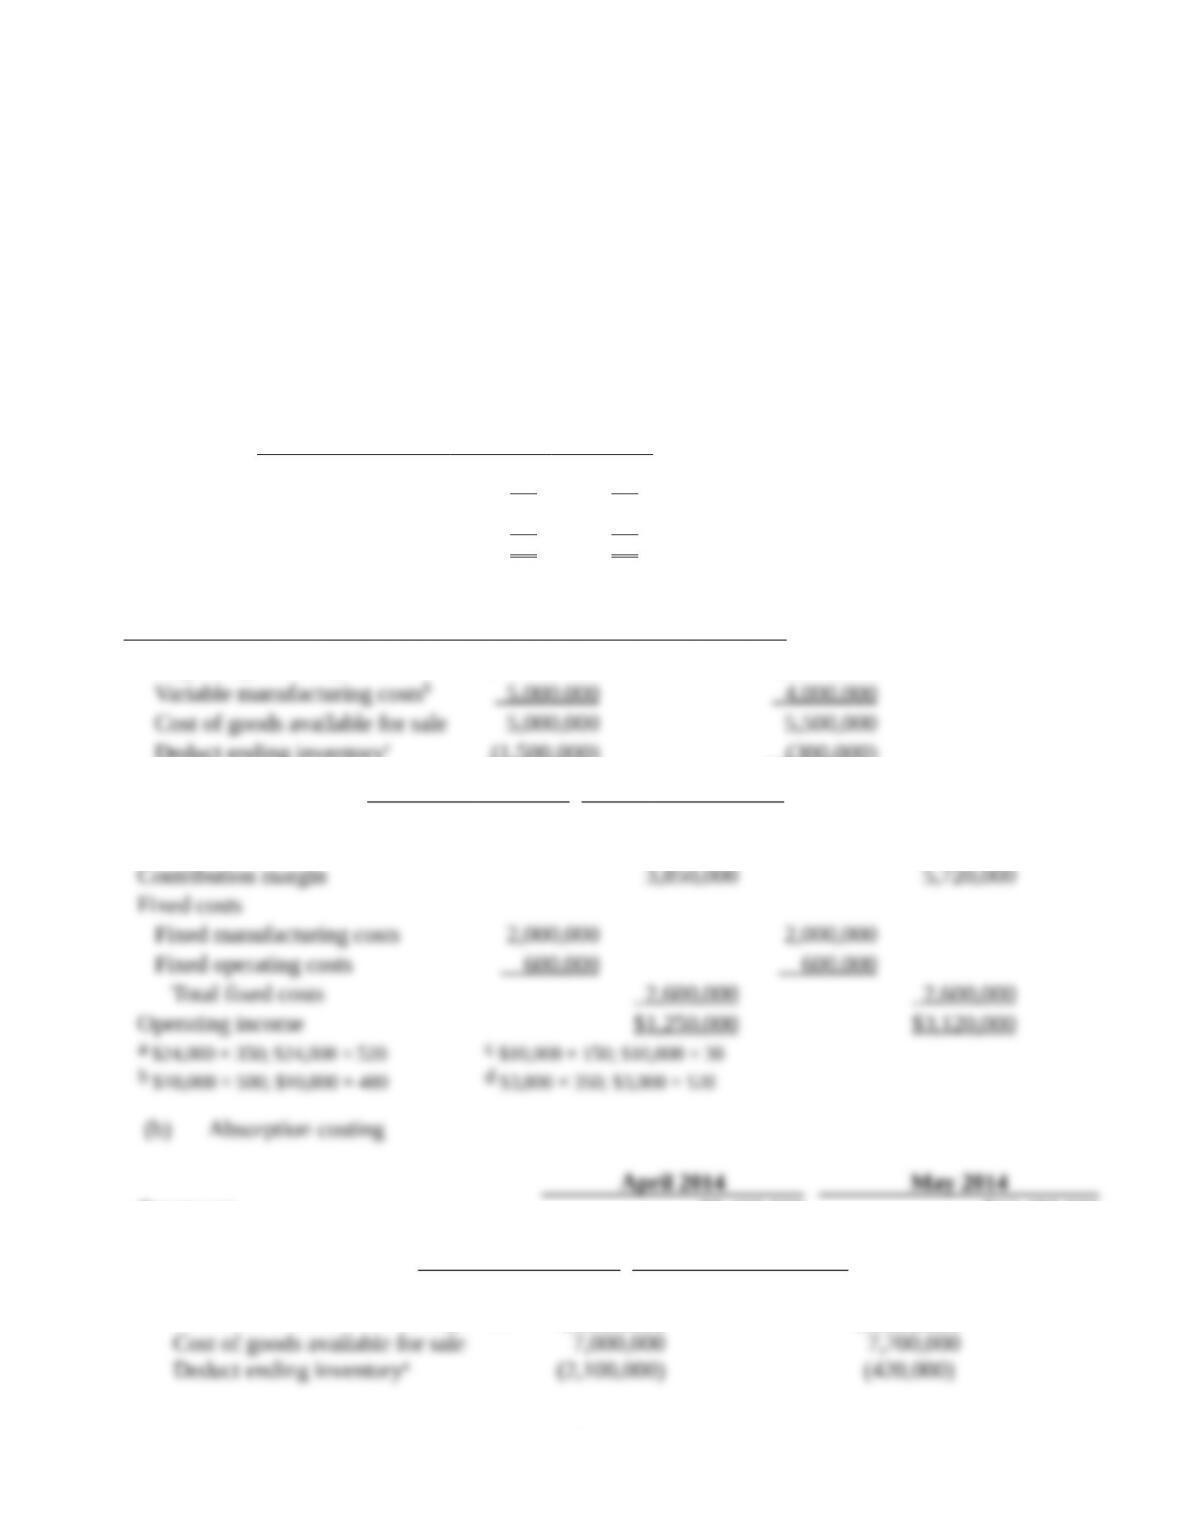
(a) Variable costing
April 2014
May 2014
Revenuesa
$8,400,000
$12,480,000
Variable costs
Beginning inventory
$ 0
$1,500,000
Variable manufacturing costsb
5,000,000
4,000,000
Cost of goods available for sale
5,000,000
5,500,000
Deduct ending inventoryc
(1,500,000)
(300,000)
Variable cost of goods sold
3,500,000
5,200,000
Variable operating costsd
1,050,000
1,560,000
Total variable costs
4,550,000
6,760,000
Contribution margin
3,850,000
5,720,000
Fixed costs
Fixed manufacturing costs
2,000,000
2,000,000
Fixed operating costs
600,000
600,000
Total fixed costs
2,600,000
2,600,000
Operating income
$1,250,000
$3,120,000
a $24,000 × 350; $24,000 × 520 c $10,000 × 150; $10,000 × 30
b $10,000 × 500; $10,000 × 400 d $3,000 × 350; $3,000 × 520
(b) Absorption costing
April 2014
May 2014
Revenuesa
$8,400,000
$12,480,000
Cost of goods sold
Beginning inventory
$ 0
$2,100,000
Variable manufacturing costsb
5,000,000
4,000,000
Allocated fixed manufacturing costsc
2,000,000
1,600,000
Cost of goods available for sale
7,000,000
7,700,000
Deduct ending inventoryd
(2,100,000)
(420,000)
Adjustment for prod.-vol. variancee
0
400,000 U
Cost of goods sold
4,900,000
7,680,000
Gross margin
3,500,000
4,800,000
Operating costs
Variable operating costsf
1,050,000
1,560,000
Fixed operating costs
600,000
600,000
Total operating costs
1,650,000
2,160,000
Operating income
$1,850,000
$ 2,640,000
a $24,000 × 350; $24,000 × 520 d $14,000 × 150; $14,000 × 30
b $10,000 × 500; $10,000 × 400 e $2,000,000 – $2,000,000; $2,000,000 – $1,600,000
c $4,000 × 500; $4,000 × 400 f $3,000 × 350; $3,000 × 520
2.
Absorption-costing
operating income
–
Variable-costing
operating income
=
Fixed manufacturing costs
in ending inventory
–
Fixed manufacturing costs
in beginning inventory
April:
$1,850,000 – $1,250,000 = ($4,000 × 150) – ($0)
$600,000 = $600,000
May:
$2,640,000 – $3,120,000 = ($4,000 × 30) – ($4,000 × 150)
– $480,000 = $120,000 – $600,000
– $480,000 = – $480,000
The difference between absorption and variable costing is due solely to moving fixed
manufacturing costs into inventories as inventories increase (as in April) and out of inventories as
they decrease (as in May).
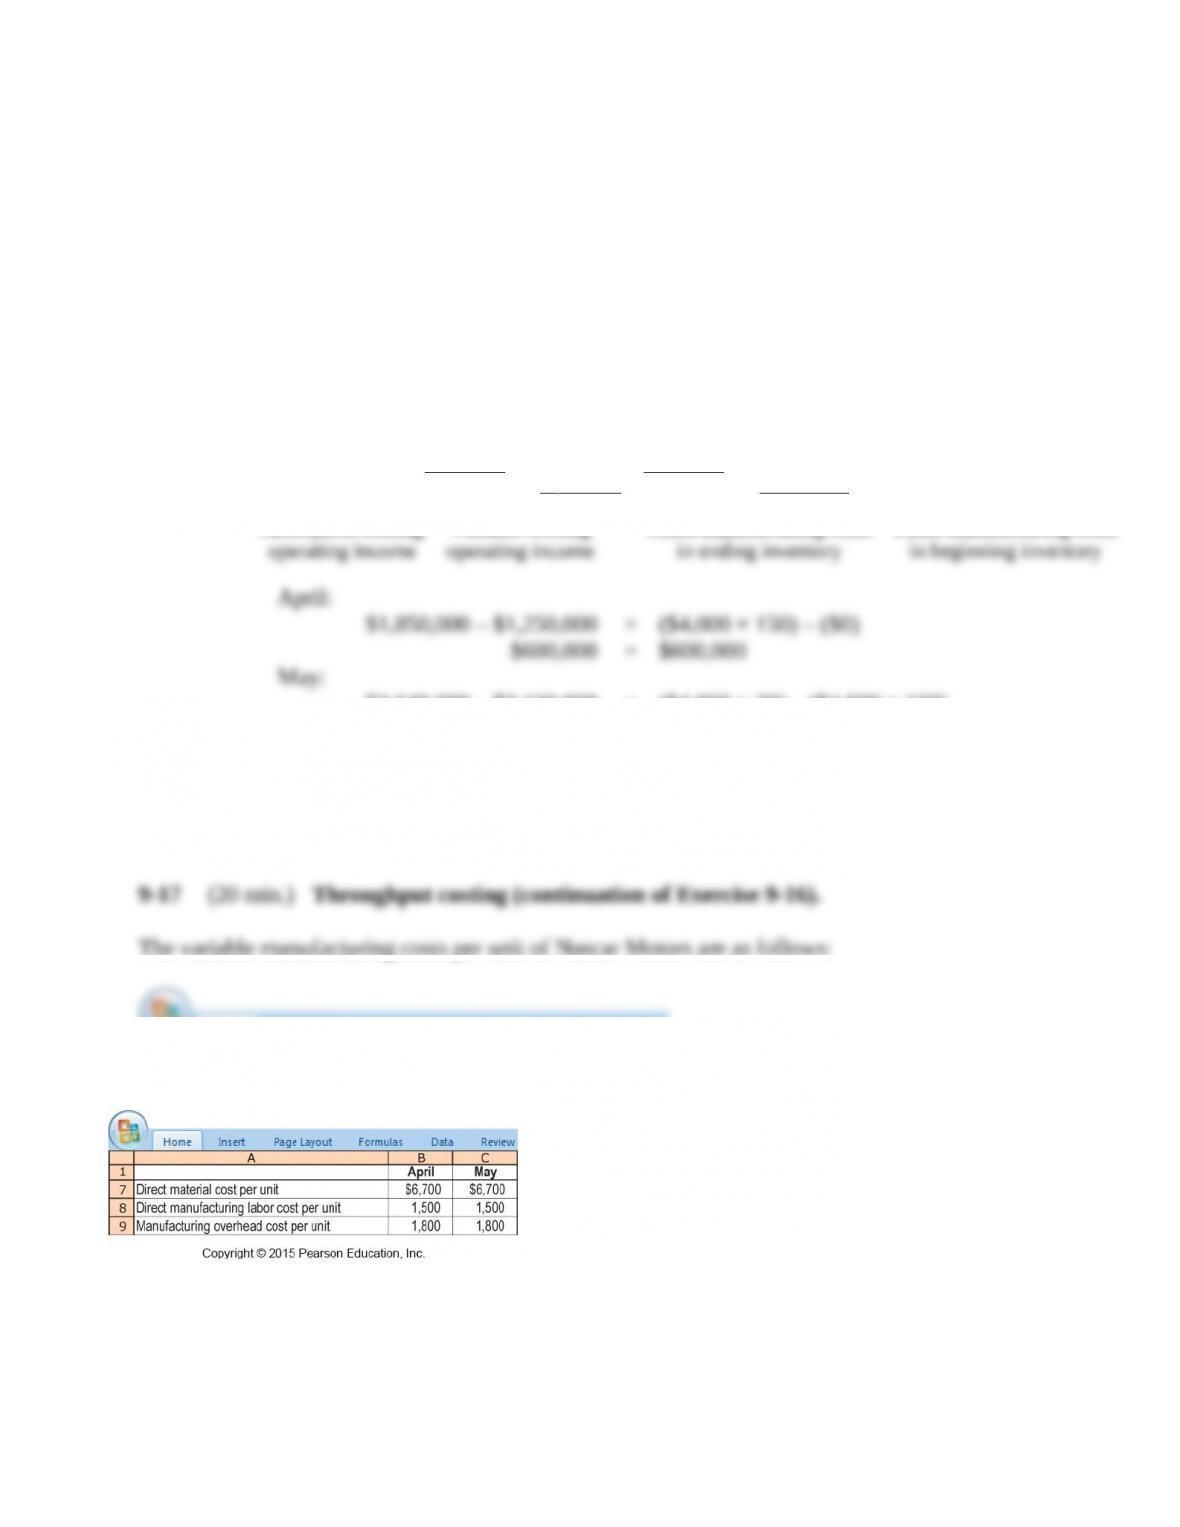
9-17 (20 min.) Throughput costing (continuation of Exercise 9-16).
The variable manufacturing costs per unit of Nascar Motors are as follows:
Required:
1. Prepare income statements for Nascar Motors in April and May 2014 under throughput costing.
2. Contrast the results in requirement 1 with those in requirement 1 of Exercise 9-16.
3. Give one motivation for Nascar Motors to adopt throughput costing.
SOLUTION
1.
April 2014
May 2014
Revenuesa
$8,400,000
$12,480,000
Direct material cost of goods sold
Beginning inventory
Direct materials in goods
manufacturedb
$ 0
3,350,000
$1,005,000
2,680,000
9-6
Cost of goods available for sale
Deduct ending inventoryc
3,350,000
(1,005,000)
3,685,000
(201,000)
Total direct material cost of goods sold
Throughput margin
Other costs
2,345,000
6,055,000
3,484,000
8,996,000
Manufacturing costs
3,650,000d
3,320,000e
Other operating costs
1,650,000f
2,160,000g
Total other costs
Operating income
5,300,000
$ 755,000
5,480,000
$ 3,516,000
a $24,000 × 350; $24,000 × 520 e ($3,300 × 400) + $2,000,000
b $6,700 × 500; $6,700 × 400 f ($3,000 × 350) + $600,000
c $6,700 × 150; $6,700 × 30 g ($3,000 × 520) + $600,000
d ($3,300 × 500) + $2,000,000
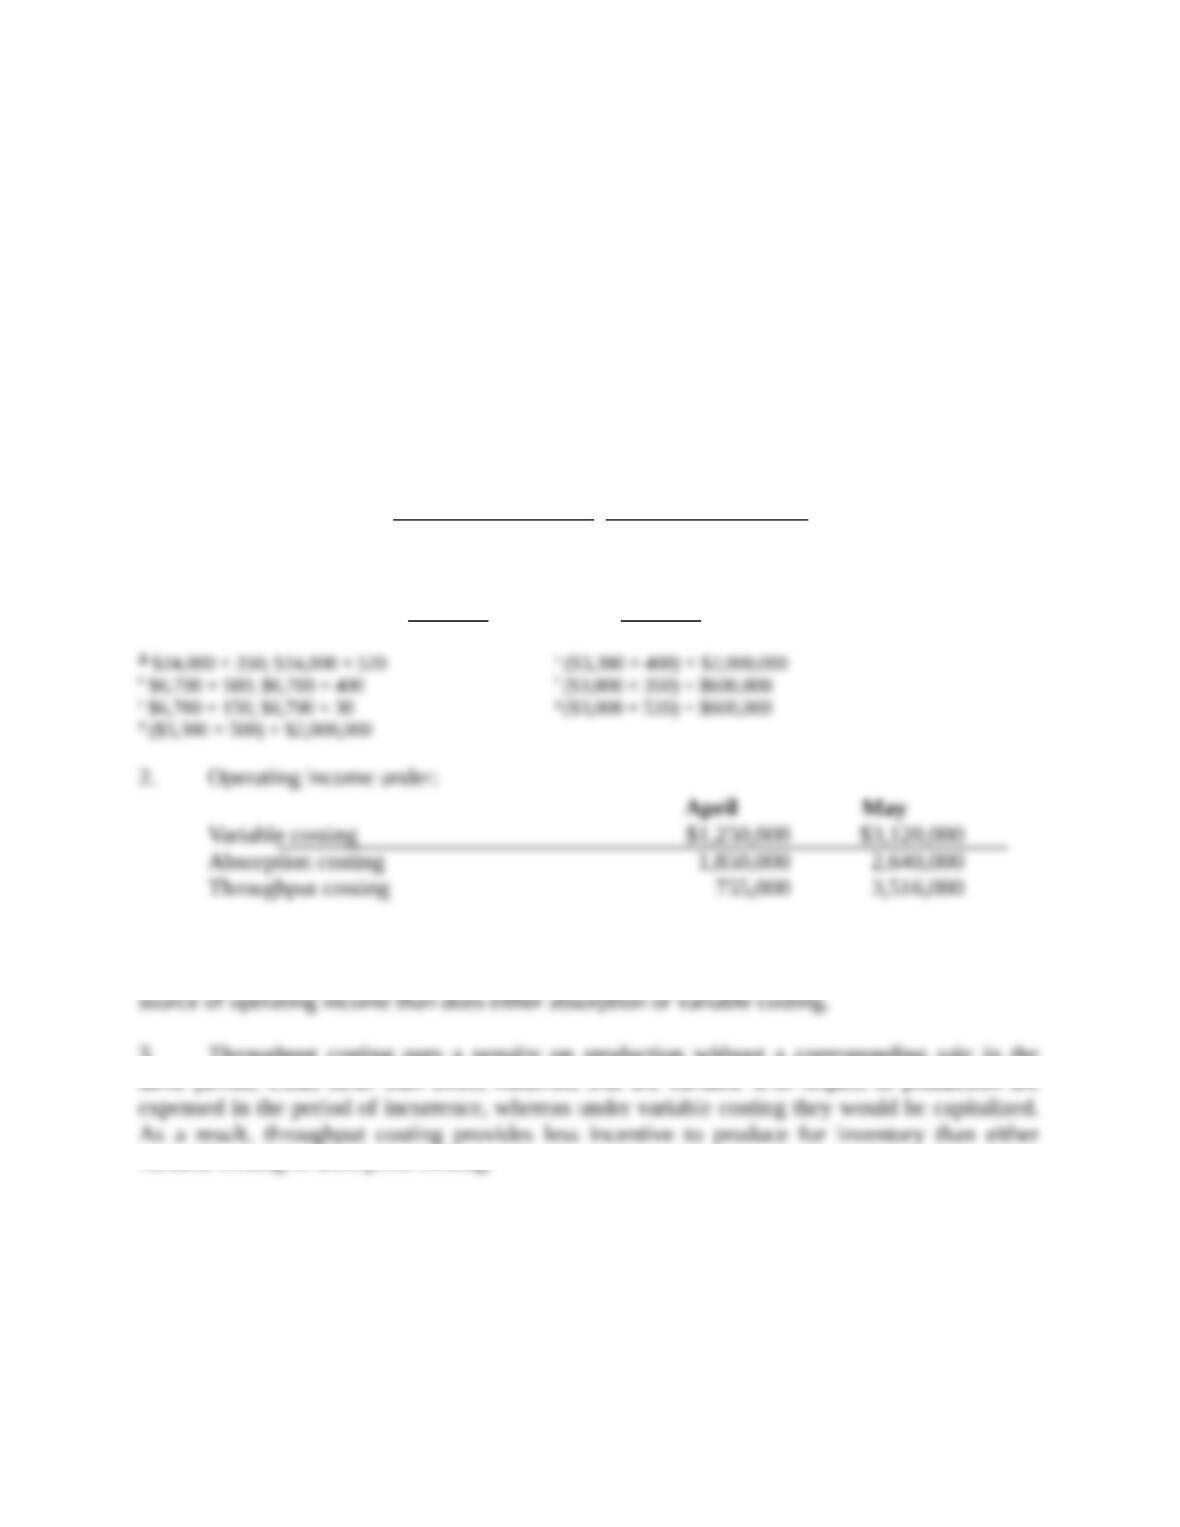
2. Operating income under:
April
May
Variable costing
Absorption costing
Throughput costing
$1,250,000
1,850,000
755,000
$3,120,000
2,640,000
3,516,000
In April, throughput costing has the lowest operating income, whereas in May throughput costing
has the highest operating income. Throughput costing puts greater emphasis on sales as the source
of operating income than does either absorption or variable costing.
3. Throughput costing puts a penalty on production without a corresponding sale in the same
period. Costs other than direct materials that are variable with respect to production are expensed
in the period of incurrence, whereas under variable costing they would be capitalized. As a result,
throughput costing provides less incentive to produce for inventory than either variable costing or
absorption costing.
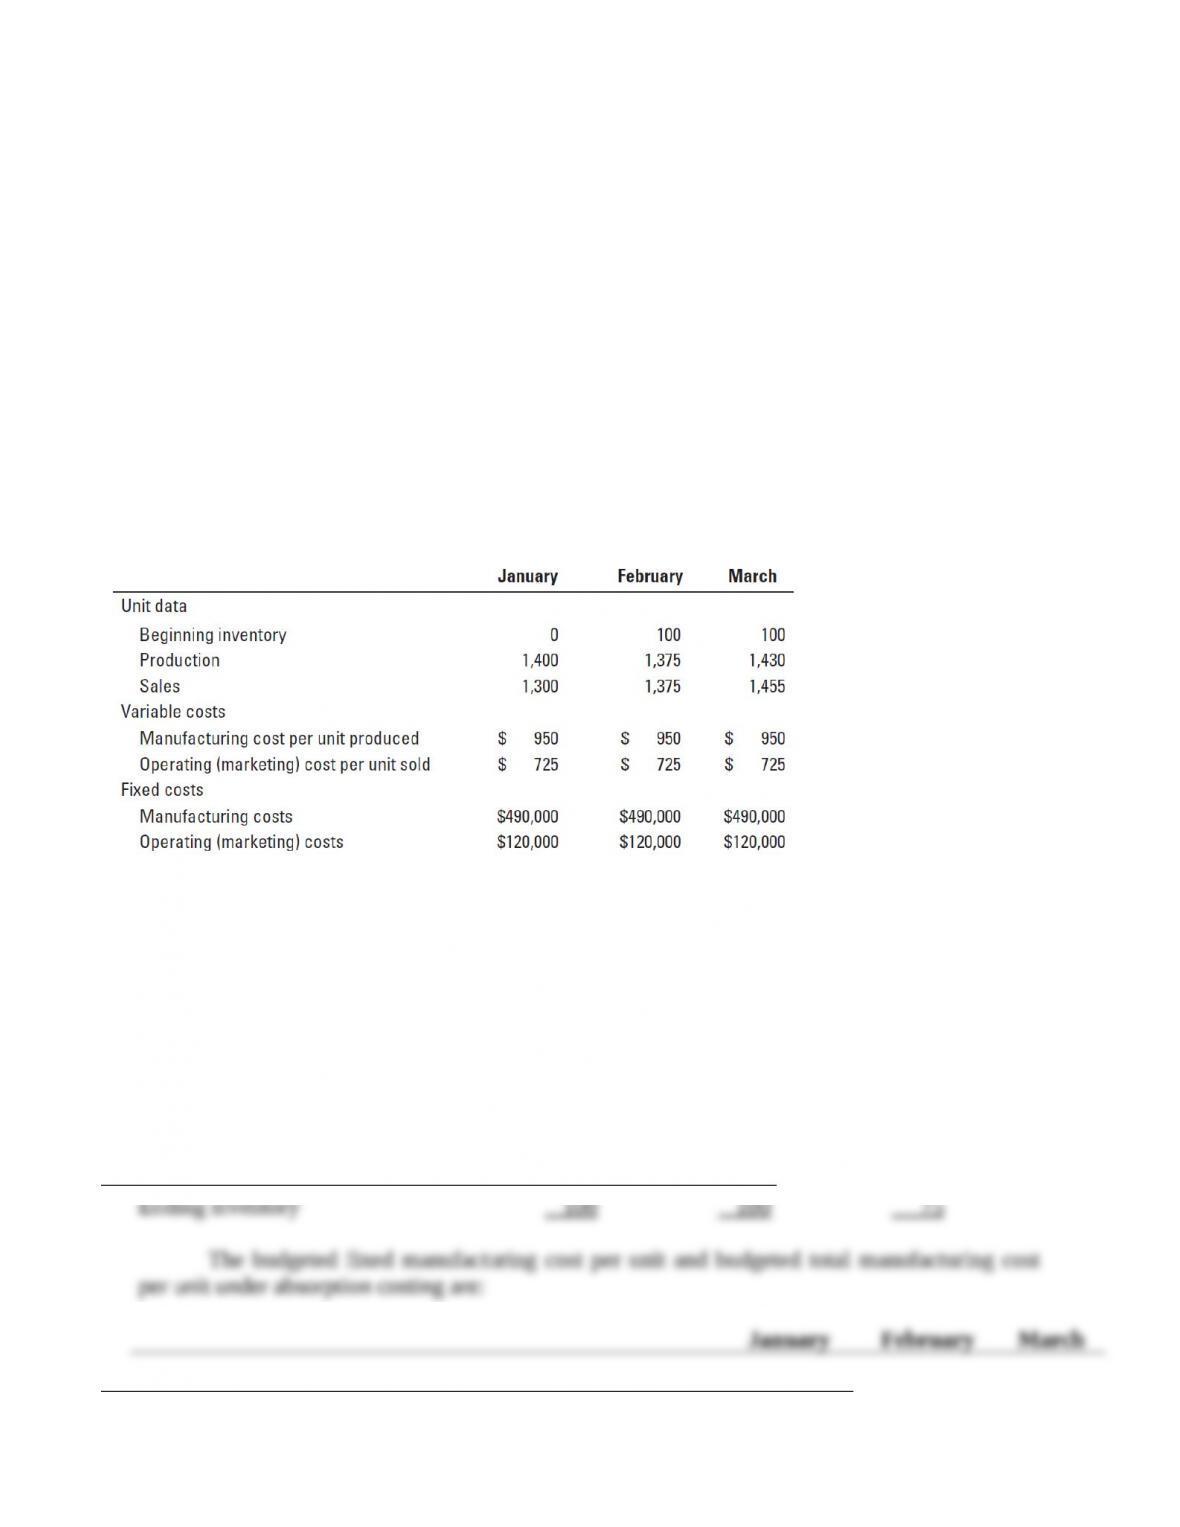
9-18 (40 min.) Variable and absorption costing, explaining operating–income differences.
Crystal Clear Corporation manufactures and sells 50-inch television sets and uses standard costing.
Actual data relating to January, February, and March 2014 are as follows:
The selling price per unit is $3,500. The budgeted level of production used to calculate the
budgeted fixed manufacturing cost per unit is 1,400 units. There are no price, efficiency, or
spending variances. Any production-volume variance is written off to cost of goods sold in the
month in which it occurs.
1. Prepare income statements for Crystal Clear in January, February, and March 2014 under (a)
variable costing and (b) absorption costing.
2. Explain the difference in operating income for January, February, and March under variable
costing and absorption costing.
SOLUTION
1. Key inputs for income statement computations are:
January
February
March
Beginning inventory
Production
Goods available for sale
Units sold
Ending inventory
0
1,400
1,400
1,300
100
100
1,375
1,475
1,375
100
100
1,430
1,530
1,455
75
The budgeted fixed manufacturing cost per unit and budgeted total manufacturing cost per
unit under absorption costing are:
January
February
March

9-8
(a) Budgeted fixed manufacturing costs
(b) Budgeted production
(c) = (a) ÷ (b) Budgeted fixed manufacturing cost per unit
(d) Budgeted variable manufacturing cost per unit
(e) = (c) + (d) Budgeted total manufacturing cost per unit
$490,000
1,400
$350
$950
$1,300
$490,000
1,400
$350
$950
$1,300
$490,000
1,400
$350
$950
$1,300
9-9
(a) Variable Costing
January 2014
February 2014
March 2014
Revenuesa
$4,550,000
$4,812,500
$5,092,500
Variable costs
Beginning inventoryb
$ 0
$ 95,000
$ 95,000
Variable manufacturing costsc
1,330,000
1,306,250
1,358,500
Cost of goods available for sale
Deduct ending inventoryd
1,330,000
(95,000)
1,401,250
(95,000)
1,453,500
(71,250)
Variable cost of goods sold
Variable operating costse
Total variable costs
1,235,000
942,500
2,177,500
1,306,250
996,875
2,303,125
1,382,250
1,054,875
2,437,125
Contribution margin
Fixed costs
Fixed manufacturing costs
Fixed operating costs
Total fixed costs
Operating income
490,000
120,000
2,372,500
610,000
$1,762,500
490,000
120,000
2,509,375
610,000
$1,899,375
490,000
120,000
2,655,375
610,000
$2,045,375
a $3,500 × 1,300; $3,500 × 1,375; $3,500 × 1,455
b $? × 0; $950 × 100; $950 × 100
c $950 × 1,400; $950 × 1,375; $950 × 1,430
d $950 × 100; $950 × 100; $950 × 75
e $725 × 1,300; $725 × 1,375; $725 × 1,455
9-10
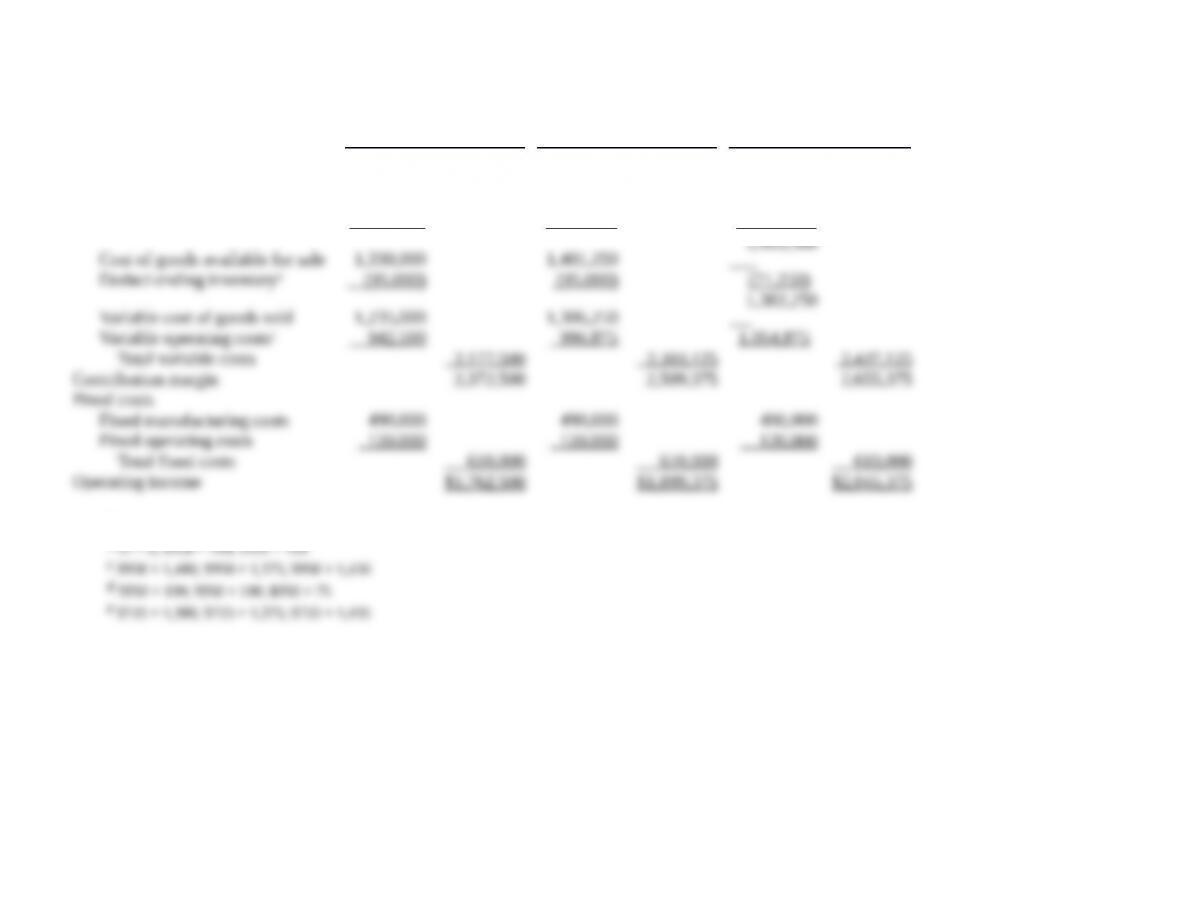
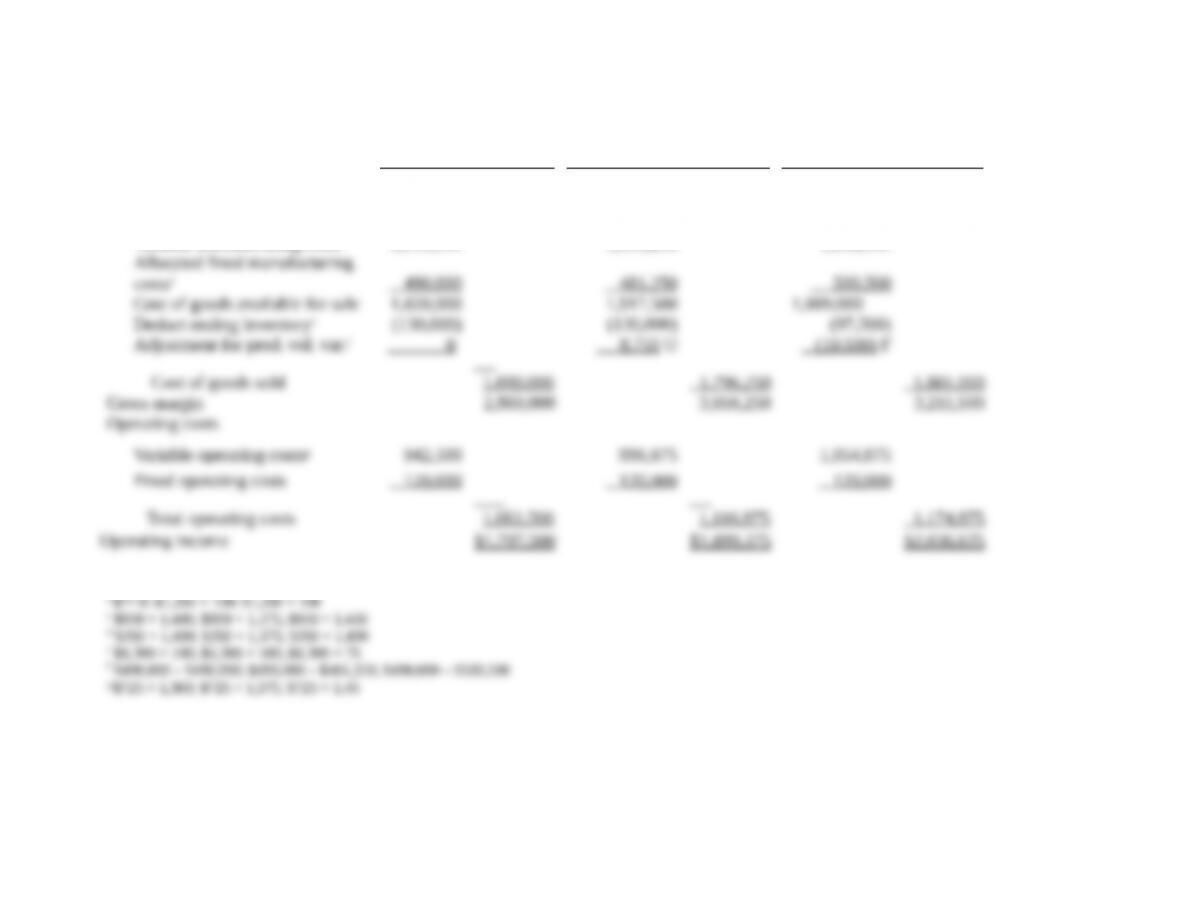
(b) Absorption Costing
January 2014
February 2014
March 2014
Revenuesa
Cost of goods sold
Beginning inventoryb
$ 0
$4,550,000
$ 130,000
$4,812,500
$ 130,000
$5,092,500
Variable manufacturing costsc
1,330,000
1,306,250
1,358,500
Allocated fixed manufacturing
costsd
490,000
481,250
500,500
Cost of goods available for sale
1,820,000
1,917,500
1,989,000
Deduct ending inventorye
(130,000)
(130,000)
(97,500)
Adjustment for prod. vol. var.f
0
8,750 U
(10,500) F
Cost of goods sold
1,690,000
1,796,250
1,881,000
Gross margin
2,860,000
3,016,250
3,211,500
Operating costs
Variable operating costsg
942,500
996,875
1,054,875
Fixed operating costs
120,000
120,000
120,000
Total operating costs
1,062,500
1,116,875
1,174,875
Operating income
$1,797,500
$1,899,375
$2,036,625
a $3,500 × 1,300; $3,500 × 1,375; $3,500 × 1,455
b $?× 0; $1,300 × 100; $1,300 × 100
c $950 × 1,400; $950 × 1,375; $950 × 1,430
d $350 × 1,400; $350 × 1,375; $350 × 1,430
e $1,300 × 100; $1,300 × 100; $1,300 × 75
f $490,000 – $490,000; $490,000 – $481,250; $490,000 – $500,500
g $725 × 1,300; $725 × 1,375; $725 × 1,45
9-11