6-1
CHAPTER 6
MASTER BUDGET AND RESPONSIBILITY ACCOUNTING
6-1 The budgeting cycle includes the following elements:
a. Planning the performance of the company as a whole as well as planning the performance
of its subunits. Management agrees on what is expected.
b. Providing a frame of reference, a set of specific expectations against which actual results
can be compared.
c. Investigating variations from plans. If necessary, corrective action follows investigation.
d. Planning again, in light of feedback and changed conditions.
6-2 The master budget expresses management’s operating and financial plans for a specified
period (usually a fiscal year) and includes a set of budgeted financial statements. It is the initial
plan of what the company intends to accomplish in the period.
6-3 Strategy, plans, and budgets are interrelated and affect one another. Strategy specifies how
an organization matches its own capabilities with the opportunities in the marketplace to
accomplish its objectives. Strategic analysis underlies both long–run and short-run planning. In
turn, these plans lead to the formulation of budgets. Budgets provide feedback to managers about
the likely effects of their strategic plans. Managers use this feedback to revise their strategic plans.
.
6-4 We agree that budgeted performance is a better criterion than past performance for judging
managers because inefficiencies included in past results can be detected and eliminated in
budgeting. Also, future conditions may be expected to differ from the past, and these can also be
factored into budgets.
6-5 Production and marketing traditionally have operated as relatively independent business
functions. Budgets can assist in reducing conflicts between these two functions in two ways.
Consider a beverage company such as Coca-Cola or Pepsi-Cola:
• Communication. Marketing could share information about seasonal demand with
production.
• Coordination. Production could ensure that output is sufficient to meet, for example,
high seasonal demand in the summer.
6-6 In many organizations, budgets impel managers to plan. Without budgets, managers drift
from crisis to crisis. Research also shows that budgets can motivate managers to meet targets and
improve their performance. Thus, many top managers believe that budgets meet the cost–benefit
test.
6-7 A rolling budget, also called a continuous budget, is a budget or plan that is always
available for a specified future period, by continually adding a period (month, quarter, or year) to
the period that just ended. A four-quarter rolling budget for 2014 is superseded by a four–quarter
rolling budget for April 2014 to March 2015, and so on.
6-8 The steps in preparing an operating budget are as follows:
1. Prepare the revenues budget.
2. Prepare the production budget (in units).
3. Prepare the direct material usage budget and direct material purchases budget.
4. Prepare the direct manufacturing labor budget.
5. Prepare the manufacturing overhead budget.
6. Prepare the ending inventories budget.
7. Prepare the cost of goods sold budget.
8. Prepare the nonmanufacturing costs budget.
6-2
9. Prepare the budgeted income statement.
The steps in preparing an operating budget are as follows:
6-9 The sales forecast is typically the cornerstone for budgeting because production (and,
hence, costs) and inventory levels generally depend on the forecasted level of sales.
6-10 Sensitivity analysis adds an extra dimension to budgeting. It enables managers to examine
how budgeted amounts change with a change in the underlying assumptions. This assists managers
in monitoring those assumptions that are most critical to a company in attaining its budget and
allows them to make timely adjustments to plans when appropriate.
6-11 Kaizen budgeting explicitly incorporates continuous improvement anticipated during the
budget period into the budget numbers.
6-12 Nonoutput-based cost drivers can be incorporated into budgeting by the use of activity–
based budgeting (ABB). ABB focuses on the budgeted cost of activities necessary to produce and
sell products and services. Nonoutput-based cost drivers, such as the number of parts, number of
batches, and number of new products can be used with ABB.
6-13 The choice of the type of responsibility center determines what the manager is accountable
for and thereby affects the manager’s behavior. For example, if a revenue center is chosen, the
manager will focus on revenues, not on costs or investments. The choice of a responsibility center
type guides the variables to be included in the budgeting exercise.
6-14 Budgeting in multinational companies may involve budgeting in several different foreign
currencies. Further, management accountants must translate operating performance into a single
currency for reporting to shareholders by budgeting for exchange rates. Managers and accountants
must understand the factors that impact exchange rates and, where possible, plan financial
strategies to limit the downside of unexpected unfavorable moves in currency valuations. In
developing budgets for operations in different countries, they must also have good understanding
of political, legal, and economic issues in those countries.
6-15 No. Cash budgets and operating income budgets must be prepared simultaneously. In
preparing their operating income budgets, companies want to avoid unnecessary idle cash and
unexpected cash deficiencies. The cash budget, unlike the operating income budget, highlights
periods of idle cash and periods of cash shortage, and it allows the accountant to plan cost effective
ways of either using excess cash or raising cash from outside to achieve the company’s operating
income goals.
6-16 (15 min.) Sales budget, service setting.
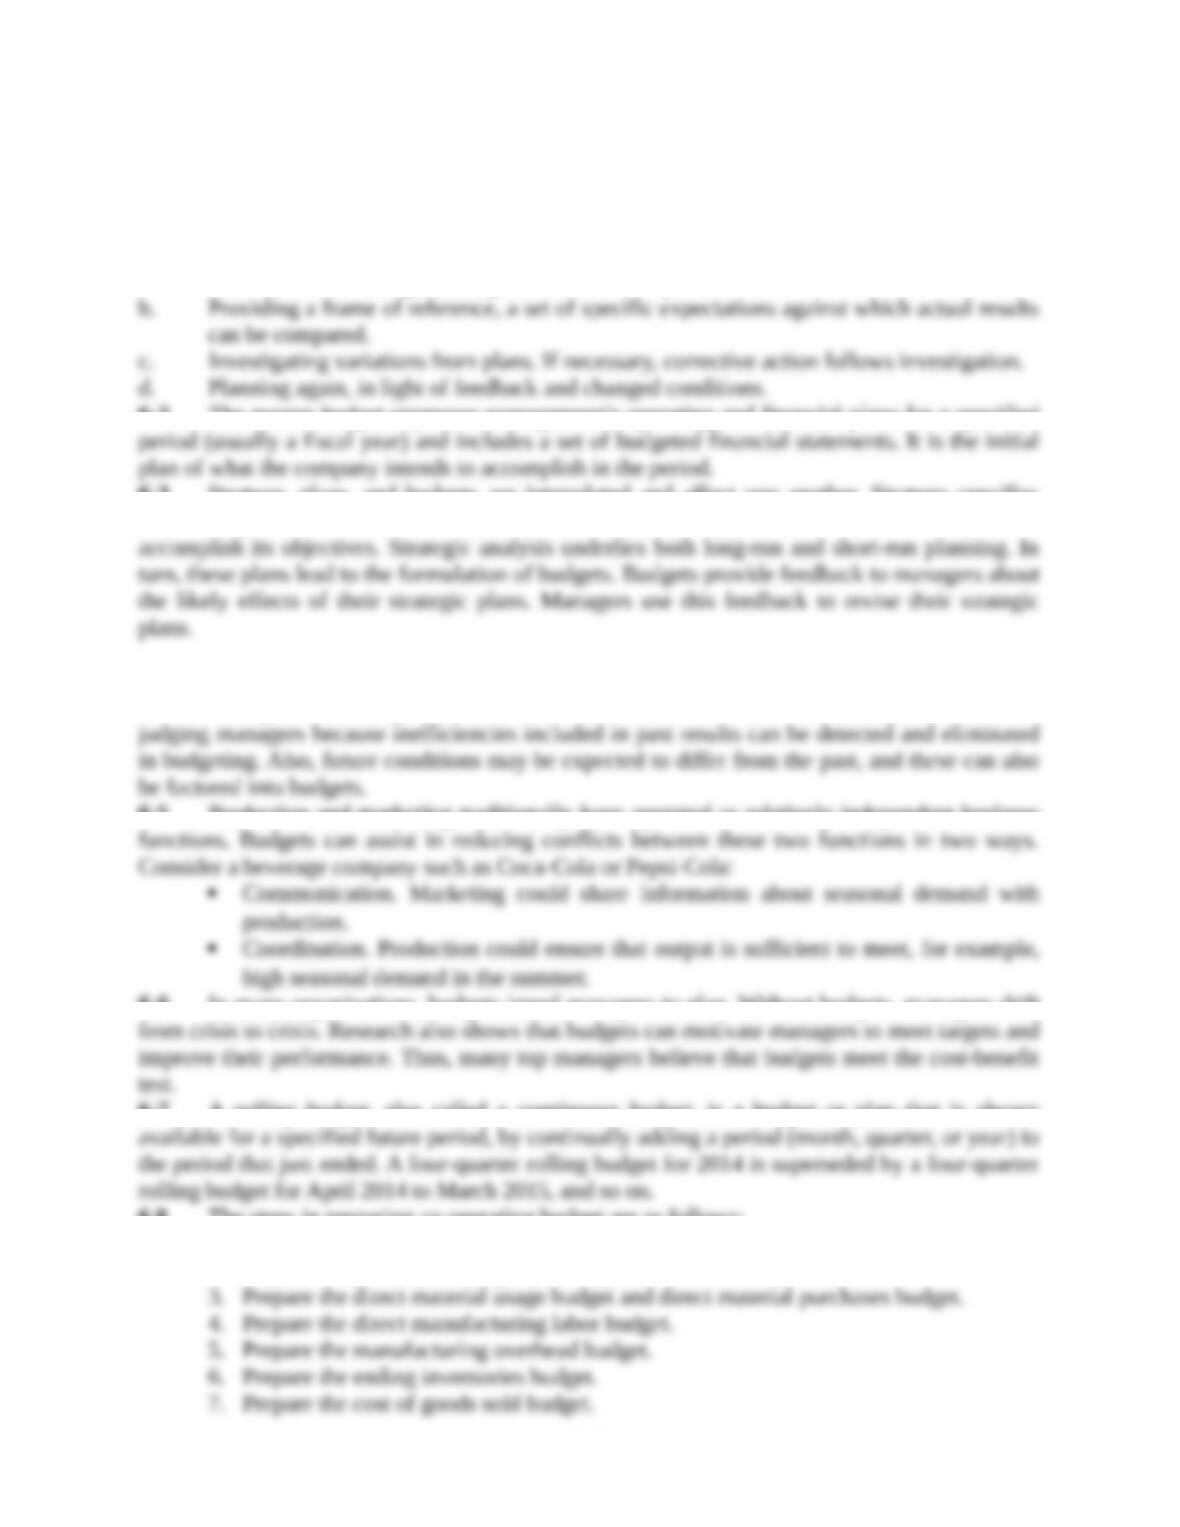
In 2014, Rouse & Sons, a small environmental-testing firm, performed 12,200 radon tests for $290
each and 16,400 lead tests for $240 each. Because newer homes are being built with lead–free
pipes, lead-testing volume is expected to decrease by 10% next year. However, awareness of
radon-related health hazards is expected to result in a 6% increase in radon-test volume each year
in the near future. Jim Rouse feels that if he lowers his price for lead testing to $230 per test, he
will have to face only a 7% decline in lead–test sales in 2015.
Required:
1. Prepare a 2015 sales budget for Rouse & Sons assuming that Rouse holds prices at 2014 levels.
2. Prepare a 2015 sales budget for Rouse & Sons assuming that Rouse lowers the price of a lead
test to $230. Should Rouse lower the price of a lead test in 2015 if the company’s goal is to
maximize sales revenue?
SOLUTION
1.
Rouse & Sons
2014
Volume
At 2014
Selling Prices
Expected 2015
Change in Volume
Expected 2015
Volume
Radon Tests
12,200
$290
+ 6%
12,932
Lead Tests
16,400
$240
–10%
14,760
Rouse & Sons Sales Budget
For the Year Ended December 31, 2015
Selling
Price
Units
Sold
Total
Revenues
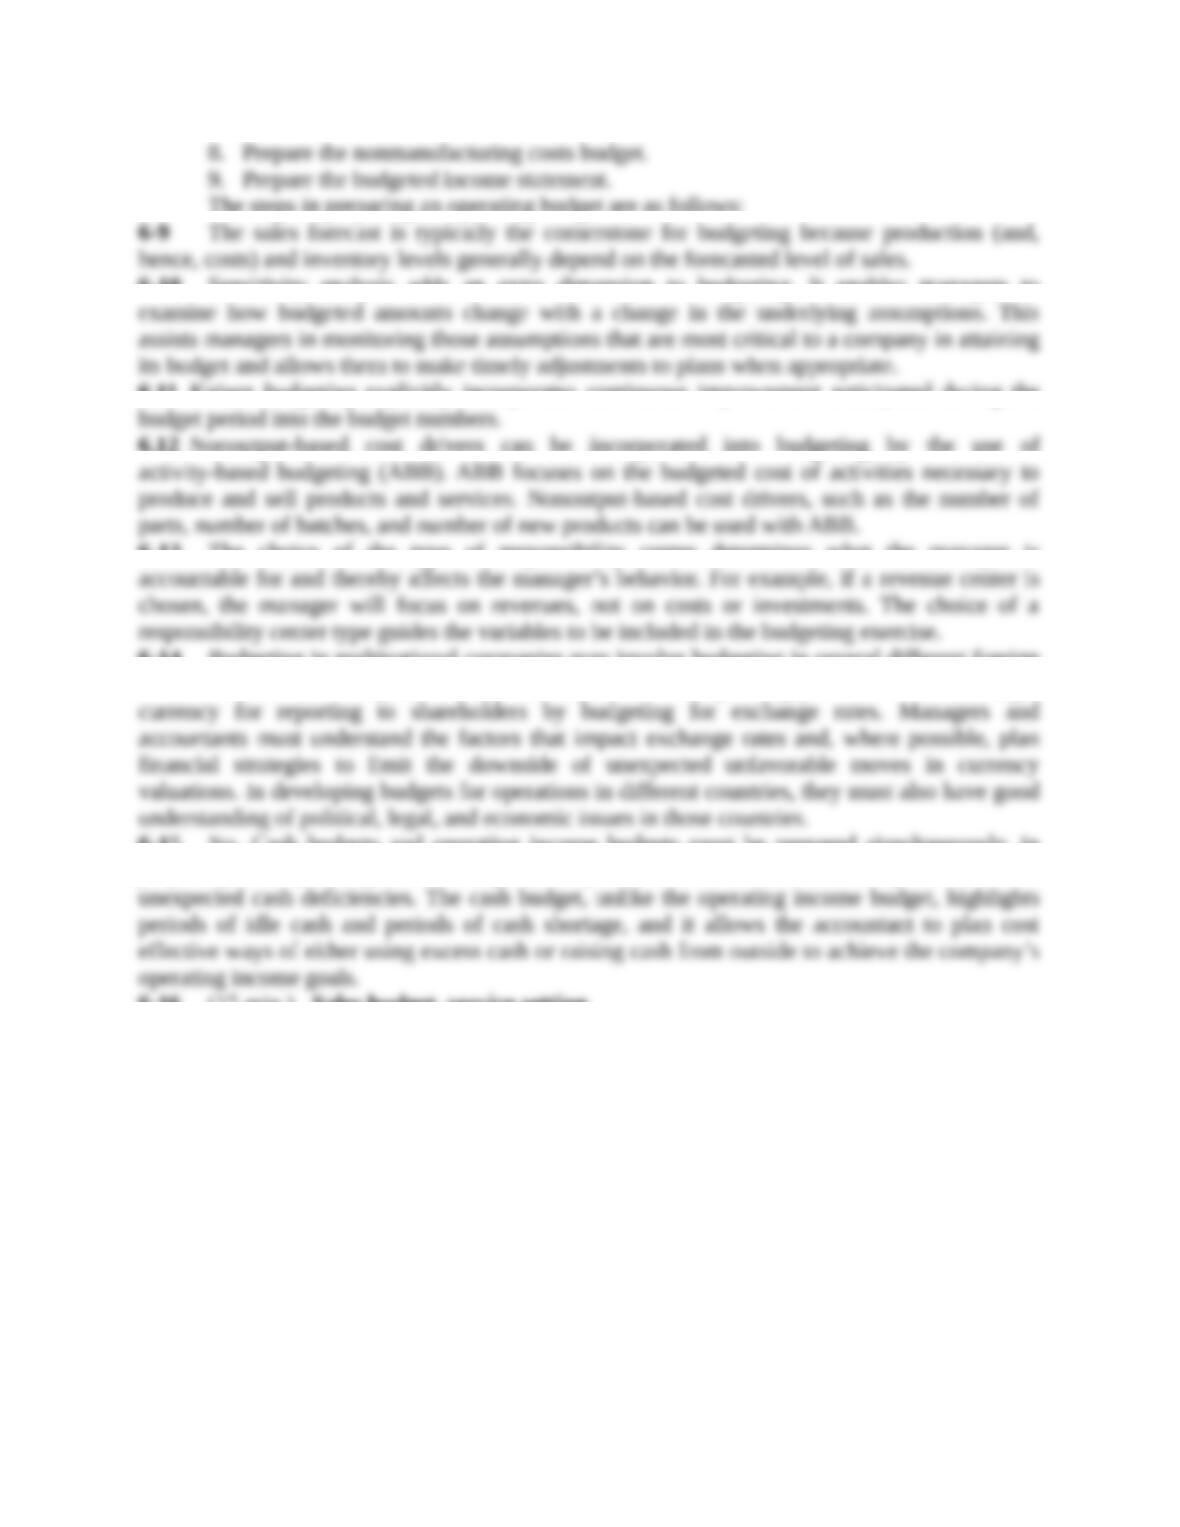
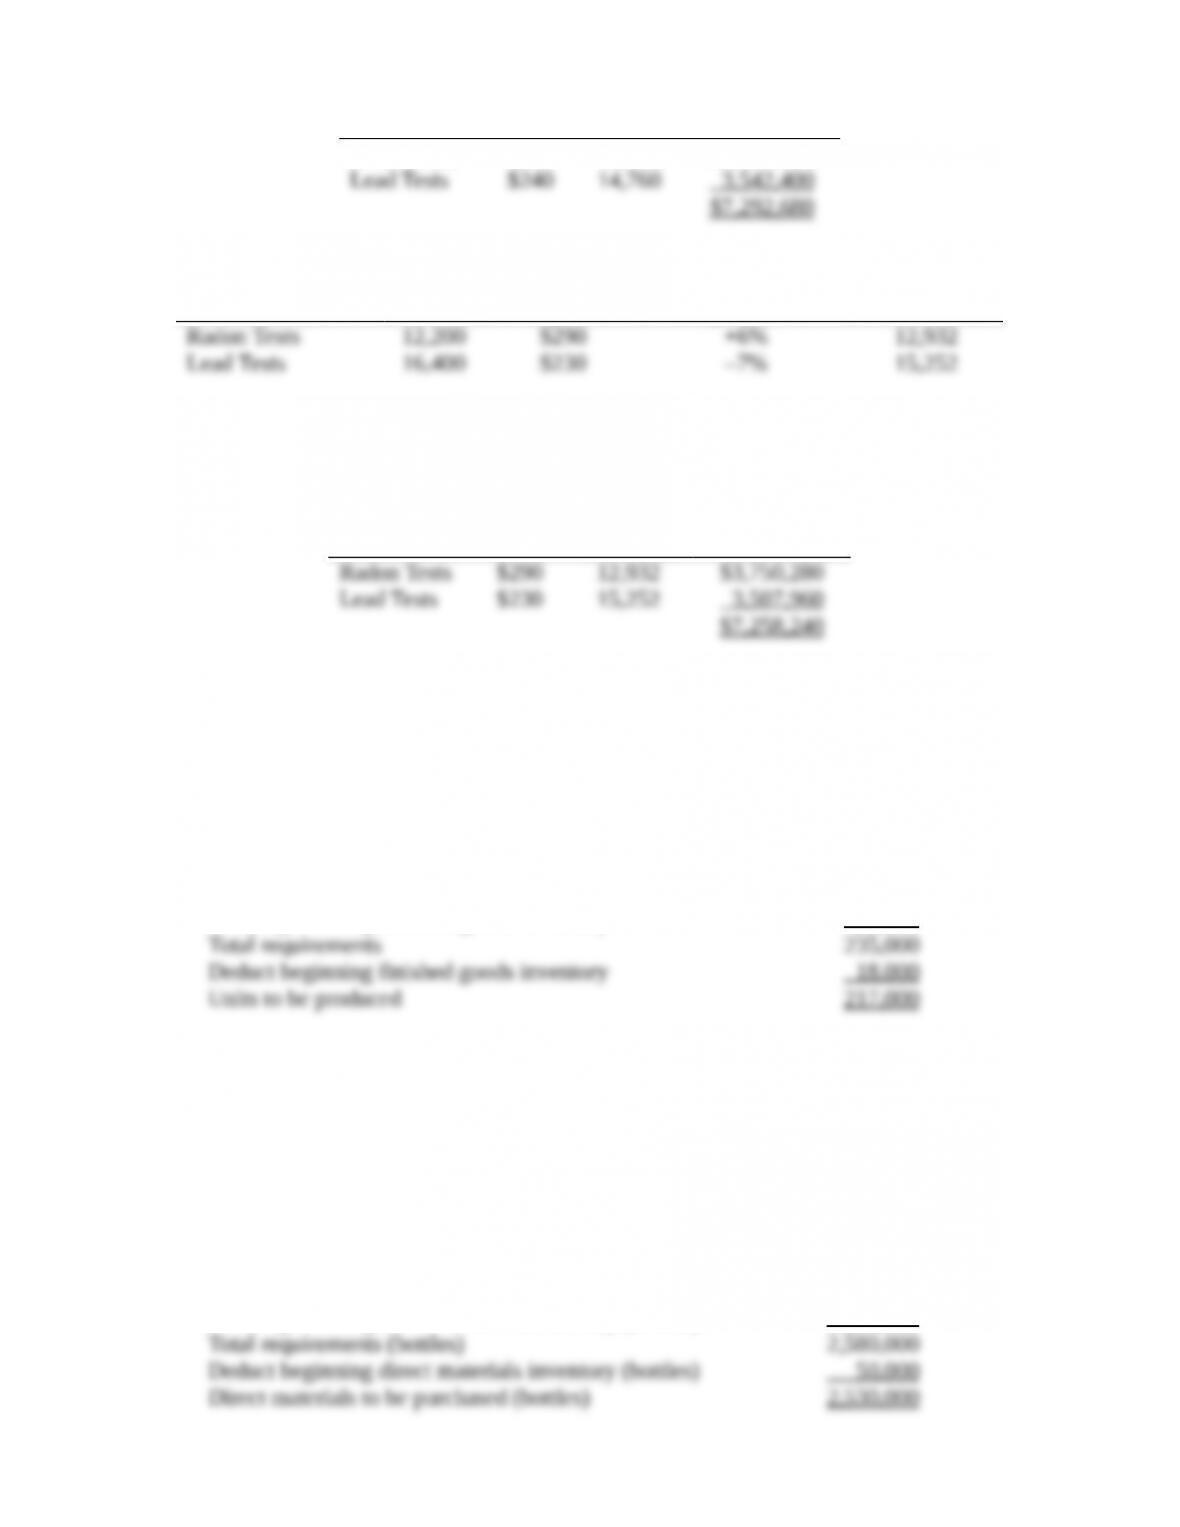
Radon Tests
$290
12,932
$3,750,280
Lead Tests
$240
14,760
3,542,400
$7,292,680
2.
Rouse & Sons
2014
Volume
Planned 2015
Selling Prices
Expected 2015
Change in Volume
Expected
2015 Volume
Radon Tests
12,200
$290
+6%
12,932
Lead Tests
16,400
$230
–7%
15,252
Rouse & Sons Sales Budget
For the Year Ended December 31, 2015
Selling
Price
Units Sold
Total
Revenues
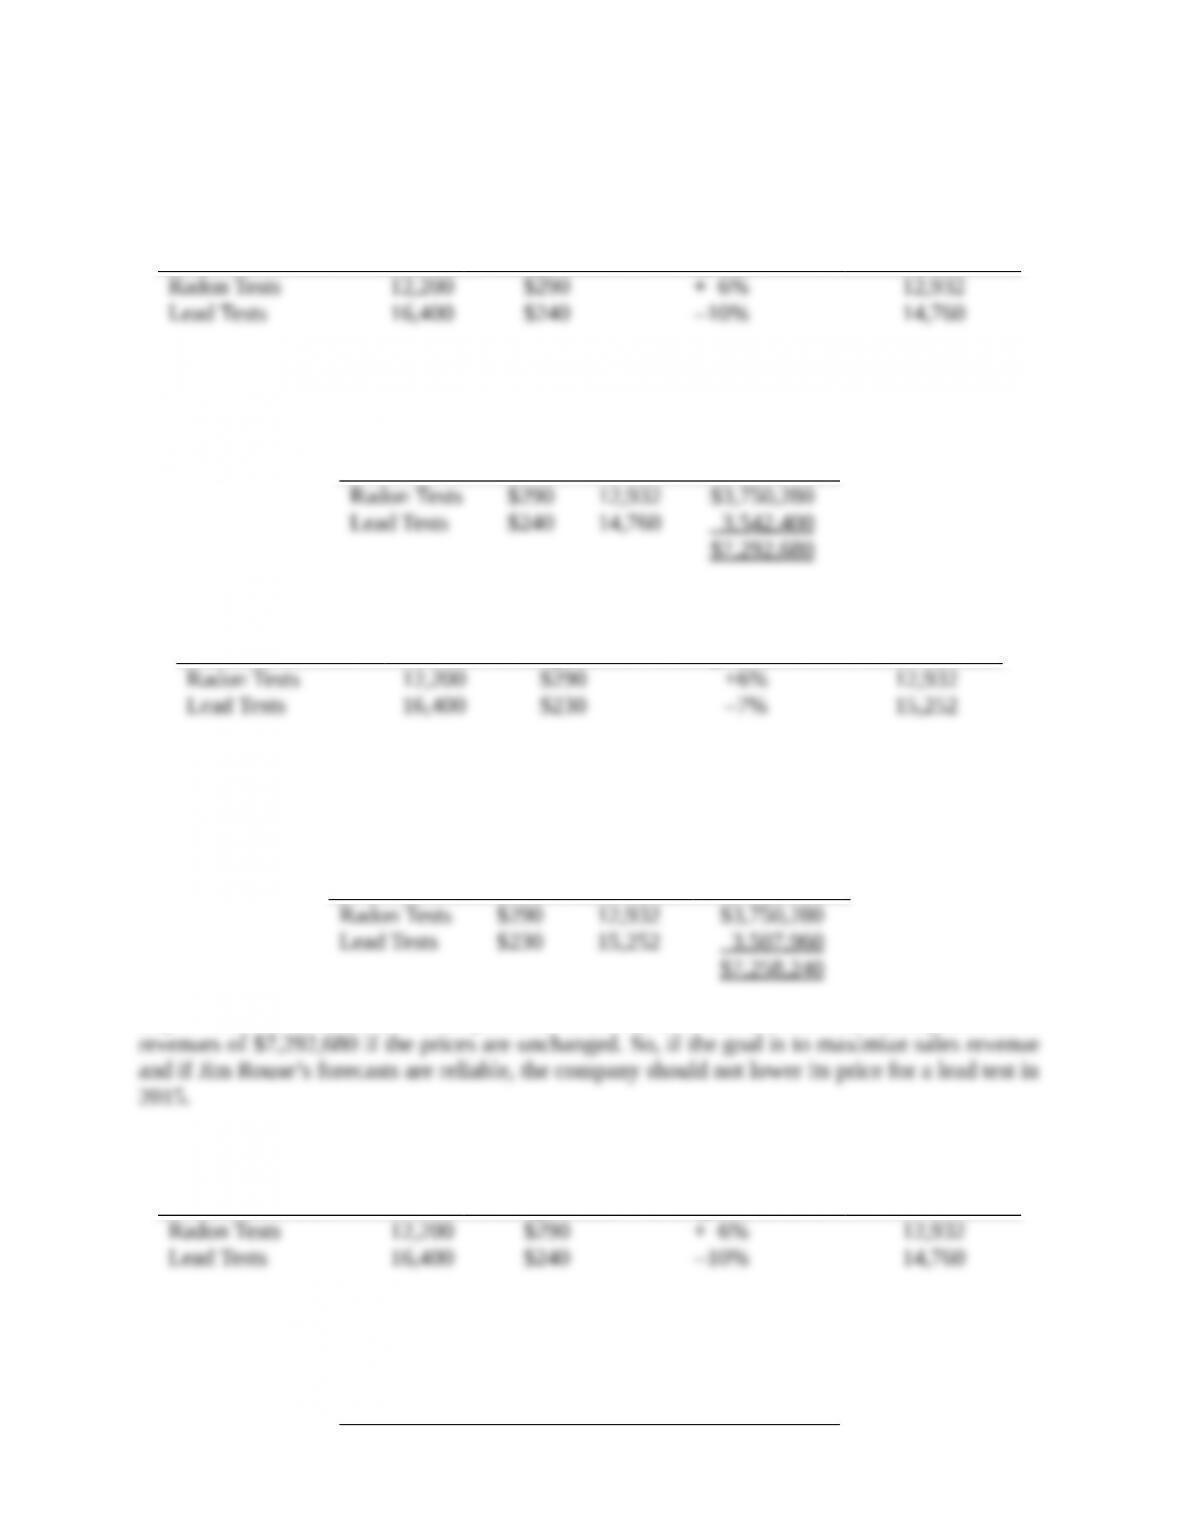
Radon Tests
$290
12,932
$3,750,280
Lead Tests
$230
15,252
3,507,960
$7,258,240
Expected revenues at the new 2015 prices are $7,258,240, which is lower than the expected 2015
revenues of $7,292,680 if the prices are unchanged. So, if the goal is to maximize sales revenue
and if Jim Rouse’s forecasts are reliable, the company should not lower its price for a lead test in
2015.
1.
Rouse & Sons
2014
Volume
At 2014
Selling Prices
Expected 2015
Change in Volume
Expected 2015
Volume
Radon Tests
12,200
$290
+ 6%
12,932
Lead Tests
16,400
$240
–10%
14,760
Rouse & Sons Sales Budget
For the Year Ended December 31, 2015
Selling
Price
Units
Sold
Total
Revenues
Radon Tests
$290
12,932
$3,750,280
Lead Tests
$240
14,760
3,542,400
$7,292,680
6-4
2.
Rouse & Sons
2014
Volume
Planned 2015
Selling Prices
Expected 2015
Change in Volume
Expected
2015 Volume
Radon Tests
12,200
$290
+6%
12,932
Lead Tests
16,400
$230
–7%
15,252
Rouse & Sons Sales Budget
For the Year Ended December 31, 2015
Selling
Price
Units Sold
Total
Revenues
Radon Tests
$290
12,932
$3,750,280
Lead Tests
$230
15,252
3,507,960
$7,258,240
6-17 (5 min.) Sales and production budget.
The McKnight Company expects sales in 2015 of 208,000 units of serving trays. McKnight’s
beginning inventory for 2015 is 18,000 trays, and its target ending inventory is 27,000 trays.
Compute the number of trays budgeted for production in 2015.
SOLUTION
Budgeted sales in units 208,000
Add target ending finished goods inventory 27,000
Total requirements 235,000
Deduct beginning finished goods inventory 18,000
Units to be produced 217,000
6-18 (5 min.) Direct materials purchases budget.
Inglenook Co. produces wine. The company expects to produce 2,500,000 two-liter bottles of
Chablis in 2015. Inglenook purchases empty glass bottles from an outside vendor. Its target ending
inventory of such bottles is 80,000; its beginning inventory is 50,000. For simplicity, ignore
breakage. Compute the number of bottles to be purchased in 2015.
SOLUTION
Direct materials to be used in production (bottles) 2,500,000
Add target ending direct materials inventory (bottles) 80,000
Total requirements (bottles) 2,580,000
Deduct beginning direct materials inventory (bottles) 50,000
Direct materials to be purchased (bottles) 2,530,000
6-19 (10 min.) Budgeting material purchases.
6-5
The Howell Company has prepared a sales budget of 43,000 finished units for a 3–month period.
The company has an inventory of 11,000 units of finished goods on hand at December 31 and has
a target finished goods inventory of 19,000 units at the end of the succeeding quarter.
It takes 4 gallons of direct materials to make one unit of finished product. The company has an
inventory of 66,000 gallons of direct materials at December 31 and has a target ending inventory
of 56,000 gallons at the end of the succeeding quarter. How many gallons of direct materials should
Howell Company purchase during the 3 months ending March 31?
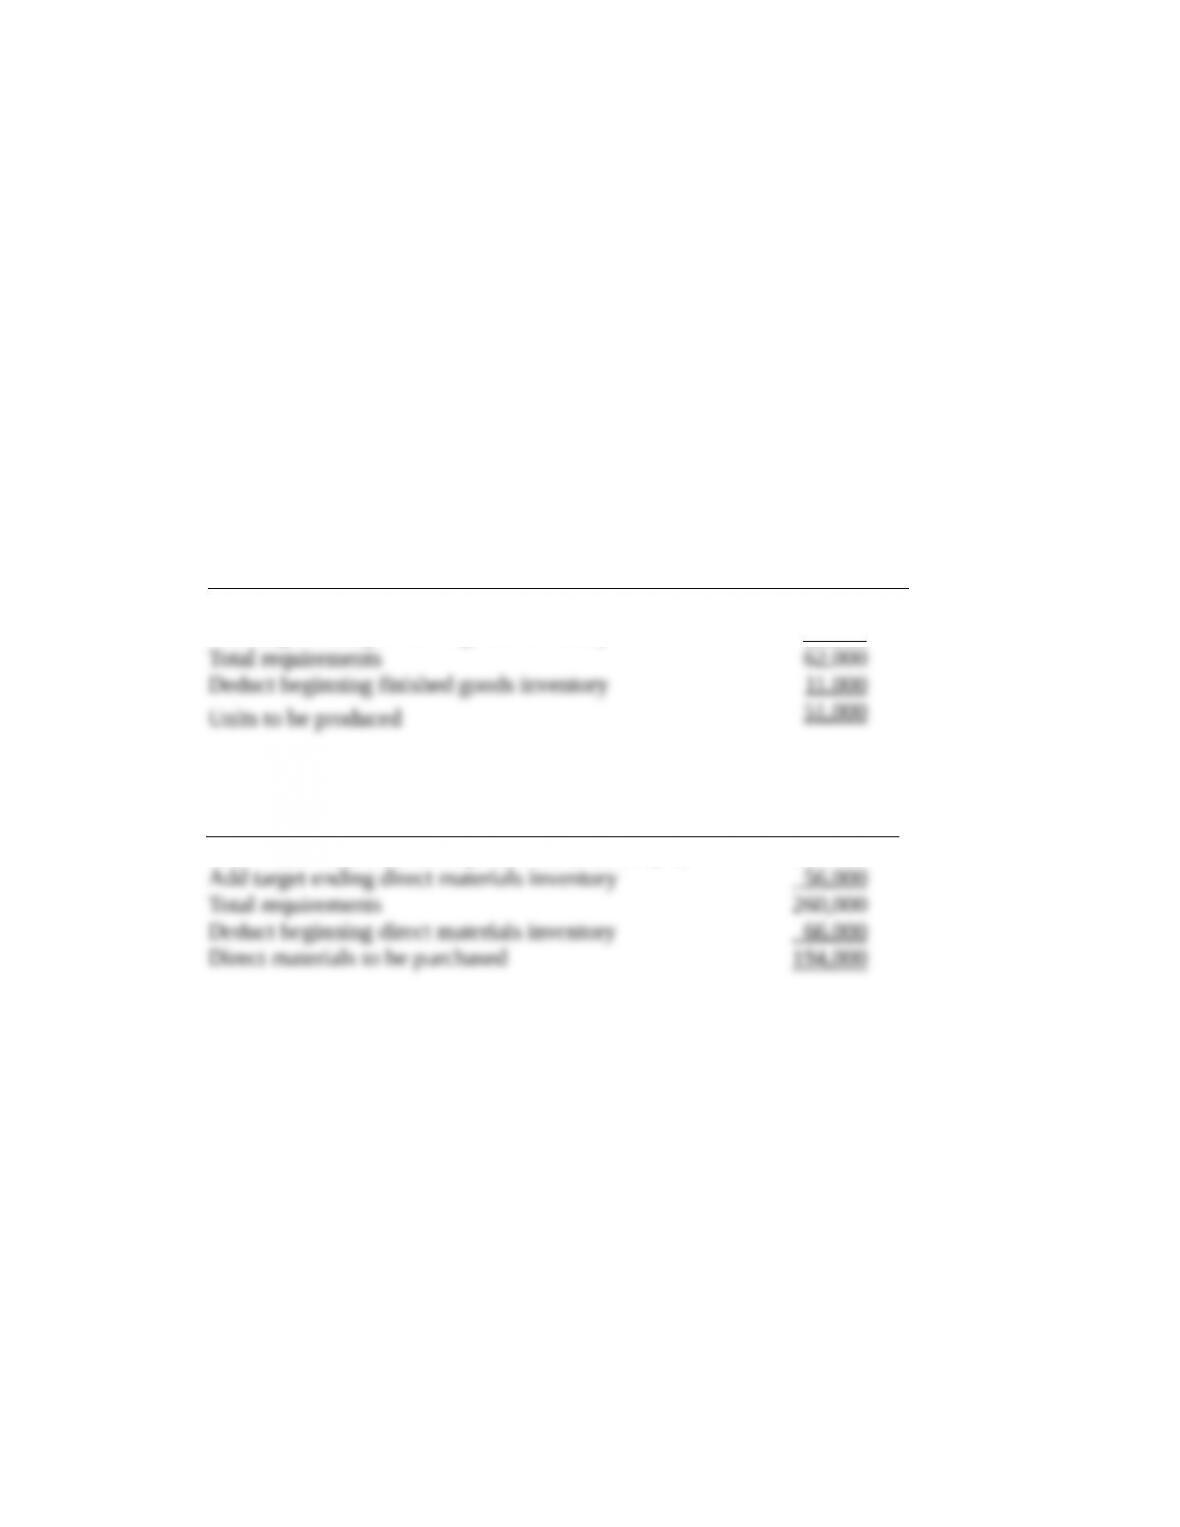
SOLUTION
Production Budget:
Finished Goods
(units)
Budgeted sales 43,000
Add target ending finished goods inventory 19,000
Total requirements 62,000
Deduct beginning finished goods inventory 11,000
Units to be produced 51,000
Direct Materials Purchases Budget:
Direct Materials
(in gallons)
Direct materials needed for production (51,000 4) 204,000
Add target ending direct materials inventory 56,000
Total requirements 260,000
Deduct beginning direct materials inventory 66,000
Direct materials to be purchased 194,000
6-20 (15–20 min.) Revenues, production, and purchases budget.
The Mochizuki Co. in Japan has a division that manufactures two–wheel motorcycles. Its budgeted
sales for Model G in 2015 is 915,000 units. Mochizuki’s target ending inventory is 70,000 units,
and its beginning inventory is 115,000 units. The company’s budgeted selling price to its
distributors and dealers is 405,000 yen (¥) per motorcycle.
Mochizuki buys all its wheels from an outside supplier. No defective wheels are accepted.
(Mochizuki’s needs for extra wheels for replacement parts are ordered by a separate division of
the company.) The company’s target ending inventory is 72,000 wheels, and its beginning
inventory is 55,000 wheels. The budgeted purchase price is 18,000 yen (¥) per wheel.
Required:
1. Compute the budgeted revenues in yen.
2. Compute the number of motorcycles that Mochizuki should produce.
3. Compute the budgeted purchases of wheels in units and in yen.
4. What actions can Mochizuki’s managers take to reduce budgeted purchasing costs of wheels
assuming the same budgeted sales for Model G?
6-6
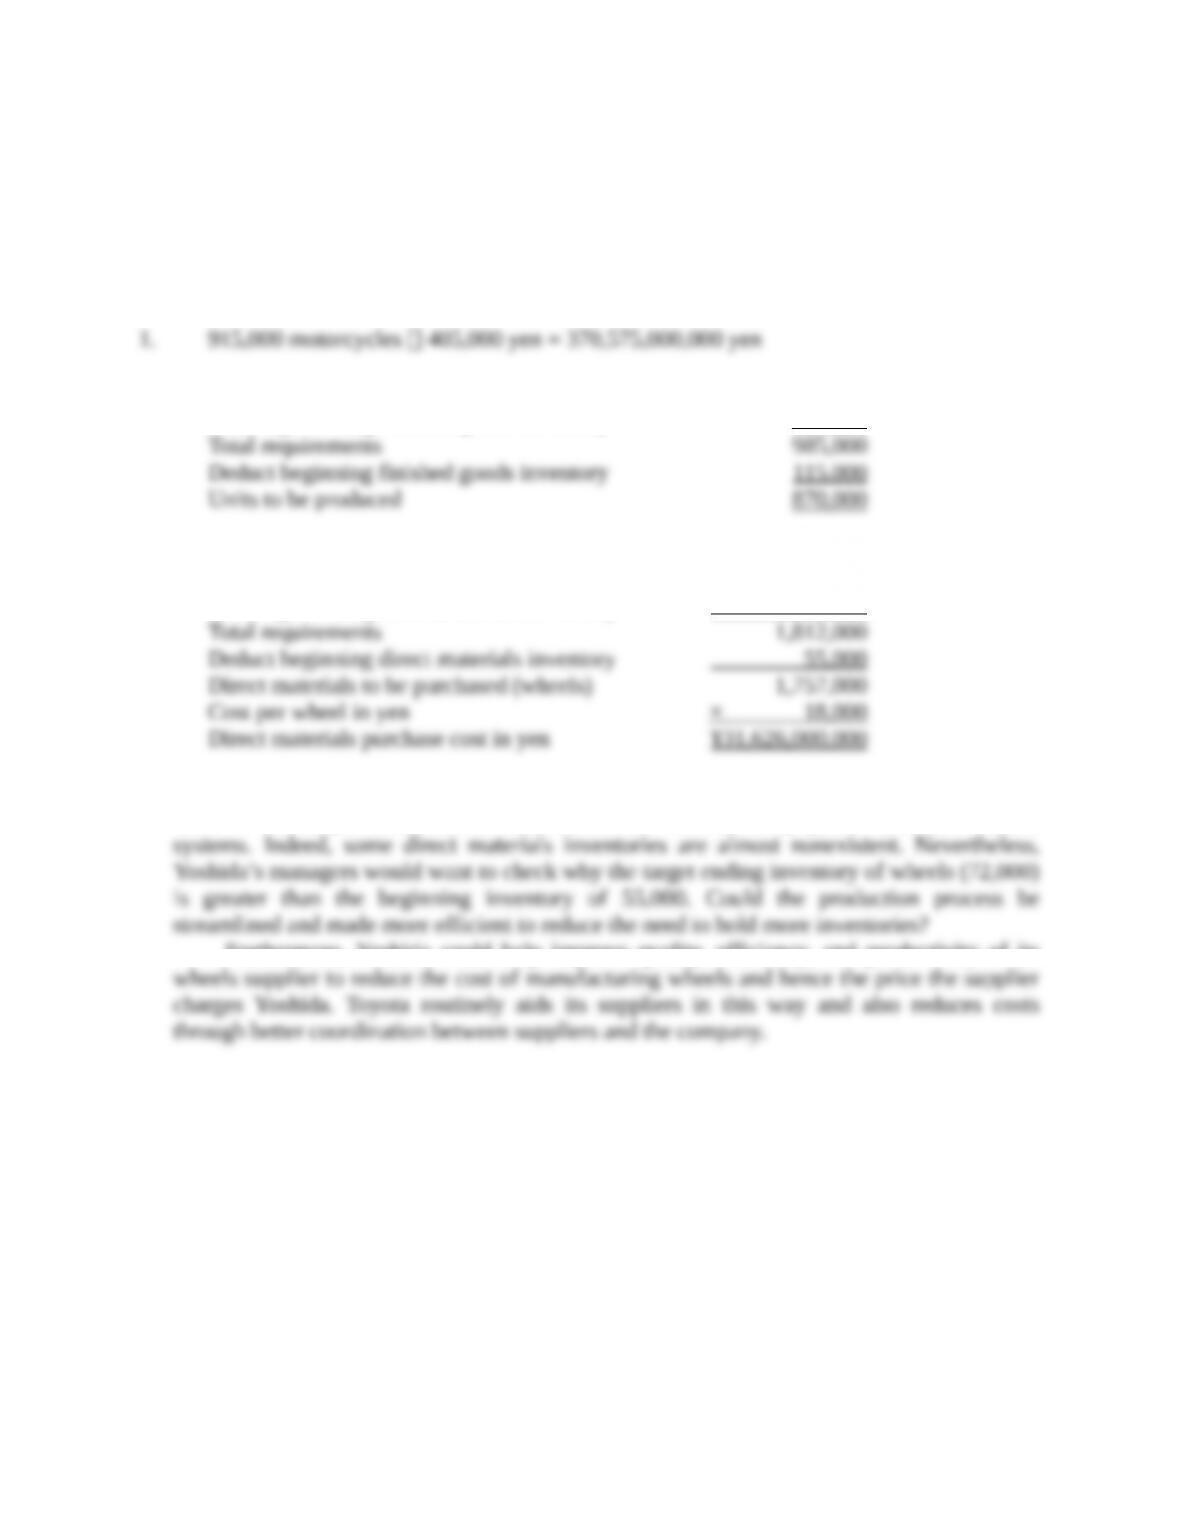
SOLUTION
1. 915,000 motorcycles 405,000 yen = 370,575,000,000 yen
2. Budgeted sales (motorcycles) 915,000
Add target ending finished goods inventory 70,000
Total requirements 985,000
Deduct beginning finished goods inventory 115,000
Units to be produced 870,000
3. Direct materials to be used in production,
870,000 × 2 (wheels) 1,740,000
Add target ending direct materials inventory 72,000
Total requirements 1,812,000
Deduct beginning direct materials inventory 55,000
Direct materials to be purchased (wheels) 1,757,000
Cost per wheel in yen × 18,000
Direct materials purchase cost in yen ¥31,626,000,000
4. Note the relatively small inventory of wheels. In Japan, suppliers tend to be located very close
to the major manufacturer. Inventories are controlled by just–in-time and similar systems.
Indeed, some direct materials inventories are almost nonexistent. Nevertheless, Yoshida’s
managers would want to check why the target ending inventory of wheels (72,000) is greater
than the beginning inventory of 55,000. Could the production process be streamlined and made
more efficient to reduce the need to hold more inventories?
Furthermore, Yoshida could help improve quality, efficiency, and productivity of its
wheels supplier to reduce the cost of manufacturing wheels and hence the price the supplier
charges Yoshida. Toyota routinely aids its suppliers in this way and also reduces costs through
better coordination between suppliers and the company.
6-21 (30 min.) Revenues and production budget.
Price, Inc., bottles and distributes mineral water from the company’s natural springs in northern
Oregon. Price markets two products: 12–ounce disposable plastic bottles and 1-gallon reusable
plastic containers.
Required:
1. For 2015, Price marketing managers project monthly sales of 420,000 12-ounce bottles and
170,000 1-gallon containers. Average selling prices are estimated at $0.20 per 12-ounce bottle
and $1.50 per 1-gallon container. Prepare a revenues budget for Price, Inc., for the year ending
December 31, 2015.
2. Price begins 2015 with 890,000 12–ounce bottles in inventory. The vice president of operations
requests that 12–ounce bottles ending inventory on December 31, 2015, be no less than 680,000
bottles. Based on sales projections as budgeted previously, what is the minimum number of
12-ounce bottles Price must produce during 2015?
3. The VP of operations requests that ending inventory of 1-gallon containers on December 31,
2015, be 240,000 units. If the production budget calls for Price to produce 1,900,000 1-gallon
6-7
containers during 2015, what is the beginning inventory of 1-gallon containers on January 1,
2015?
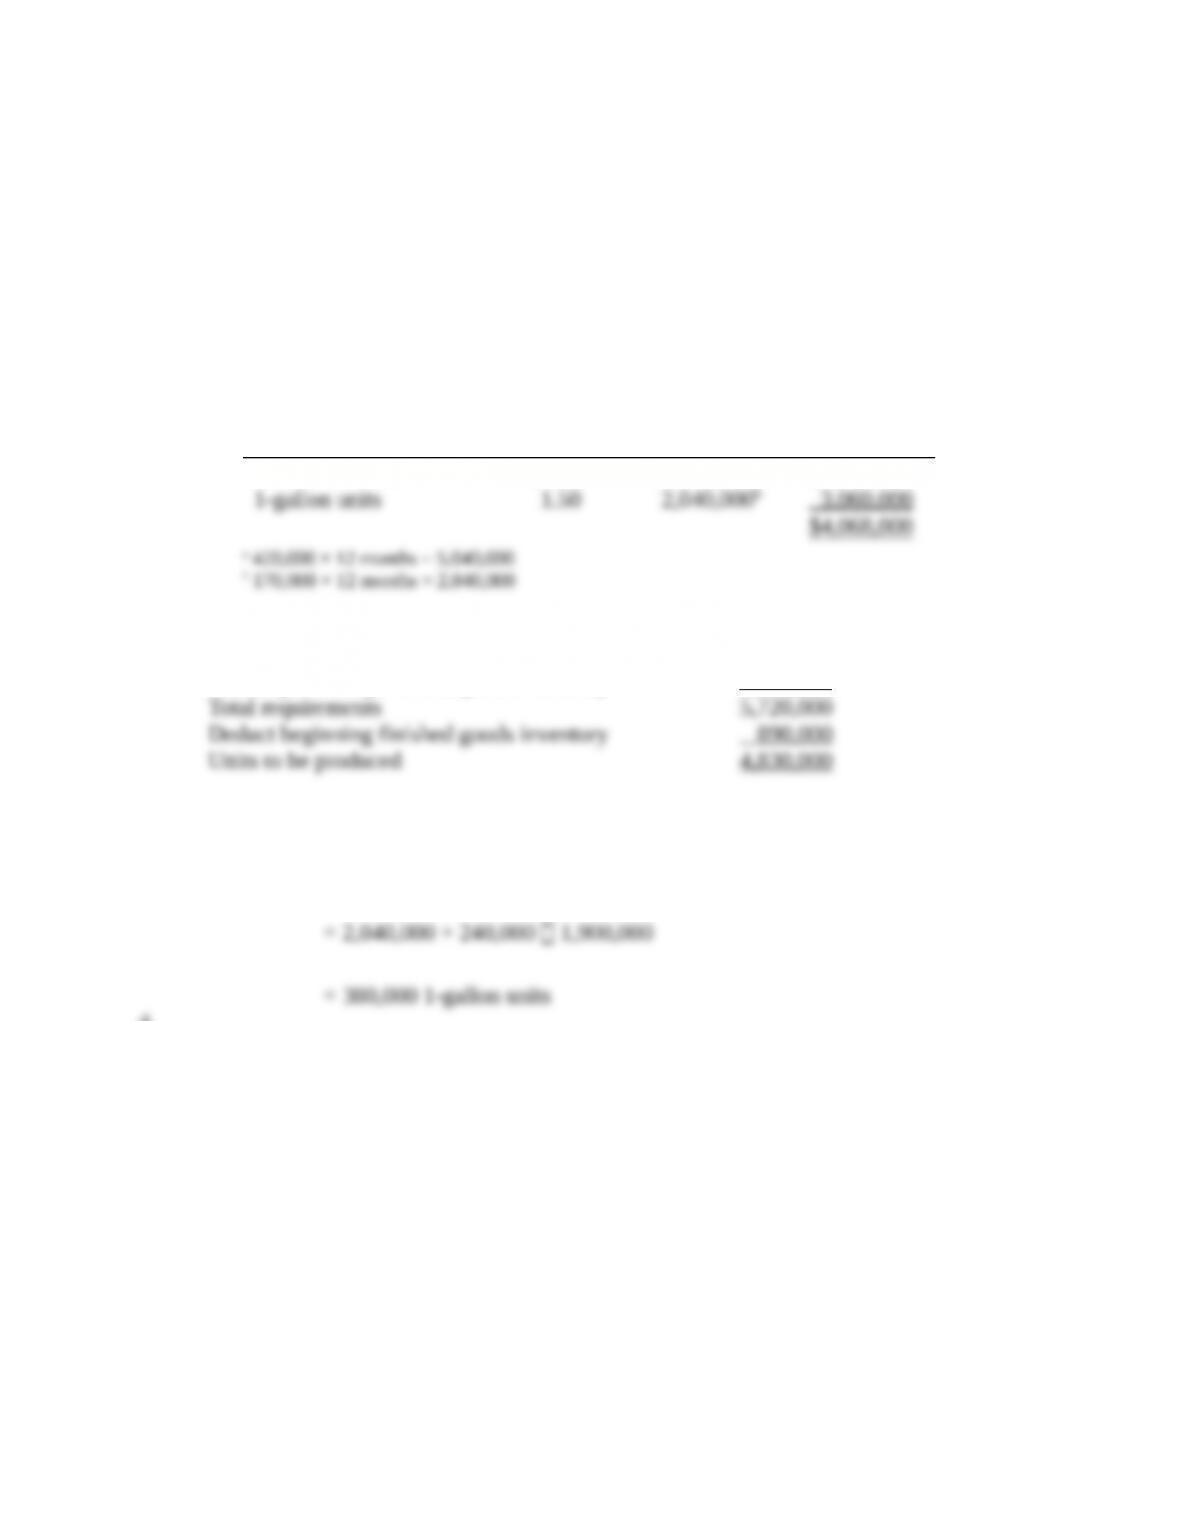
SOLUTION
1.
Selling
Price
Units
Sold
Total
Revenues
12-ounce bottles
$0.20
5,040,000a
$1,008,000
1-gallon units
1.50
2,040,000b
3,060,000
$4,068,000
a 420,000 × 12 months = 5,040,000
b 170,000 × 12 months = 2,040,000
2. Budgeted unit sales (12-ounce bottles) 5,040,000
Add target ending finished goods inventory 680,000
Total requirements 5,720,000
Deduct beginning finished goods inventory 890,000
Units to be produced 4,830,000
3.
Beginning Budgeted Target Budgeted
= +
inventory sales ending inventory production
−
= 2,040,000 + 240,000 − 1,900,000
= 380,000 1-gallon units
4.
Beginning Budgeted Target Budgeted
= +
inventory sales ending inventory production
−
6-22 (30 min.) Budgeting: direct material usage, manufacturing cost, and gross margin.
Xander Manufacturing Company manufactures blue rugs, using wool and dye as direct materials.
One rug is budgeted to use 36 skeins of wool at a cost of $2 per skein and 0.8 gallons of dye at a
cost of $6 per gallon. All other materials are indirect. At the beginning of the year Xander has an
inventory of 458,000 skeins of wool at a cost of $961,800 and 4,000 gallons of dye at a cost of
$23,680. Target ending inventory of wool and dye is zero. Xander uses the FIFO inventory cost
flow method.
Xander blue rugs are very popular and demand is high, but because of capacity constraints the
firm will produce only 200,000 blue rugs per year. The budgeted selling price is $2,000 each.
There are no rugs in beginning inventory. Target ending inventory of rugs is also zero.
Xander makes rugs by hand, but uses a machine to dye the wool. Thus, overhead costs are
accumulated in two cost pools—one for weaving and the other for dyeing. Weaving overhead is
allocated to products based on direct manufacturing labor–hours (DMLH). Dyeing overhead is
allocated to products based on machine-hours (MH).
There is no direct manufacturing labor cost for dyeing. Xander budgets 62 direct manufacturing
labor-hours to weave a rug at a budgeted rate of $13 per hour. It budgets 0.2 machine-hours to dye
each skein in the dyeing process.
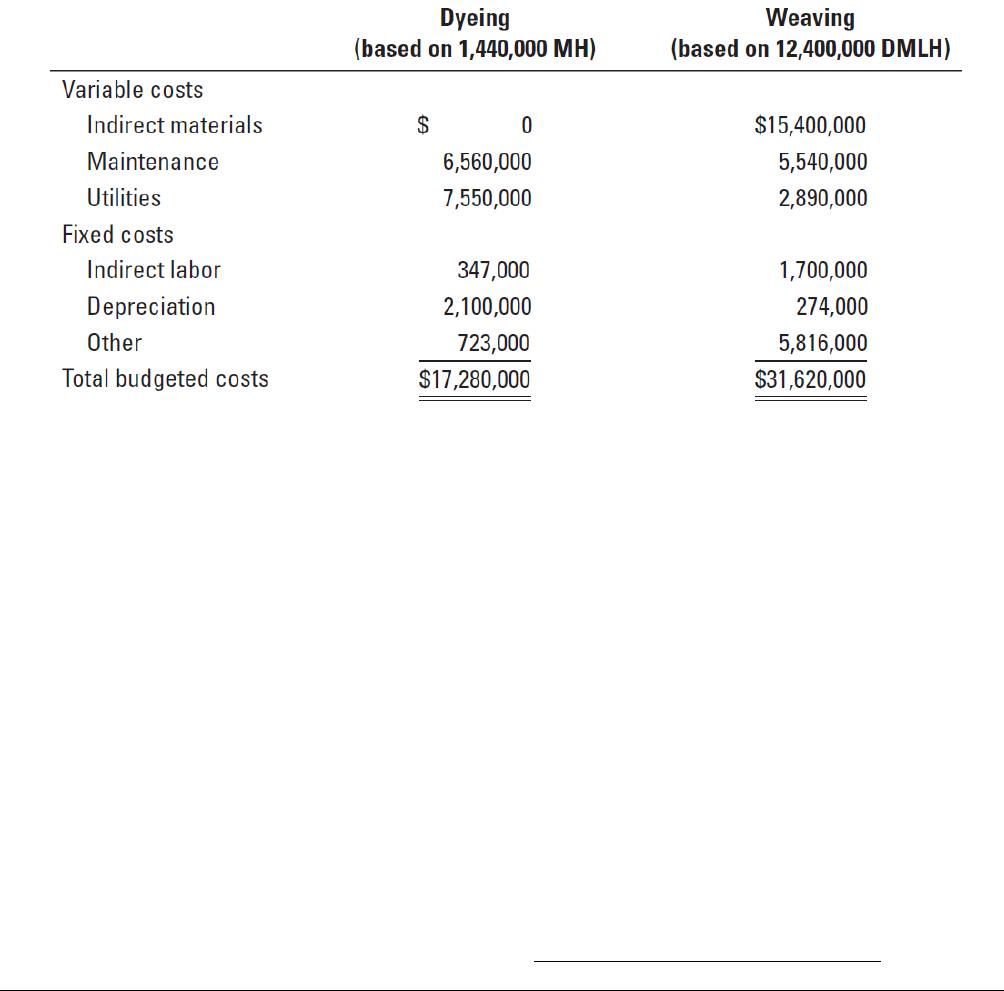
The following table presents the budgeted overhead costs for the dyeing and weaving cost
pools:
Required:
1. Prepare a direct material usage budget in both units and dollars.
2. Calculate the budgeted overhead allocation rates for weaving and dyeing.
3. Calculate the budgeted unit cost of a blue rug for the year.
4. Prepare a revenues budget for blue rugs for the year, assuming Xander sells (a) 200,000 or (b)
185,000 blue rugs (that is, at two different sales levels).
5. Calculate the budgeted cost of goods sold for blue rugs under each sales assumption.
6. Find the budgeted gross margin for blue rugs under each sales assumption.
7. What actions might you take as a manager to improve profitability if sales drop to 185,000
blue rugs?
8. How might top management at Xander use the budget developed in requirements 1–6 to better
manage the company?
SOLUTION
1.
Direct Material Usage Budget in Quantity and Dollars
Material
Wool
Dye
Total
Physical Units Budget
Direct materials required for
Blue Rugs (200,000 rugs × 36 skeins and 0.8 gal.)
7,200,000 skeins
160,000 gal.
Cost Budget
Available from beginning direct materials inventory:
(a)
Wool: 458,000 skeins
$ 961,800
Dye: 4,000 gallons
$ 23,680
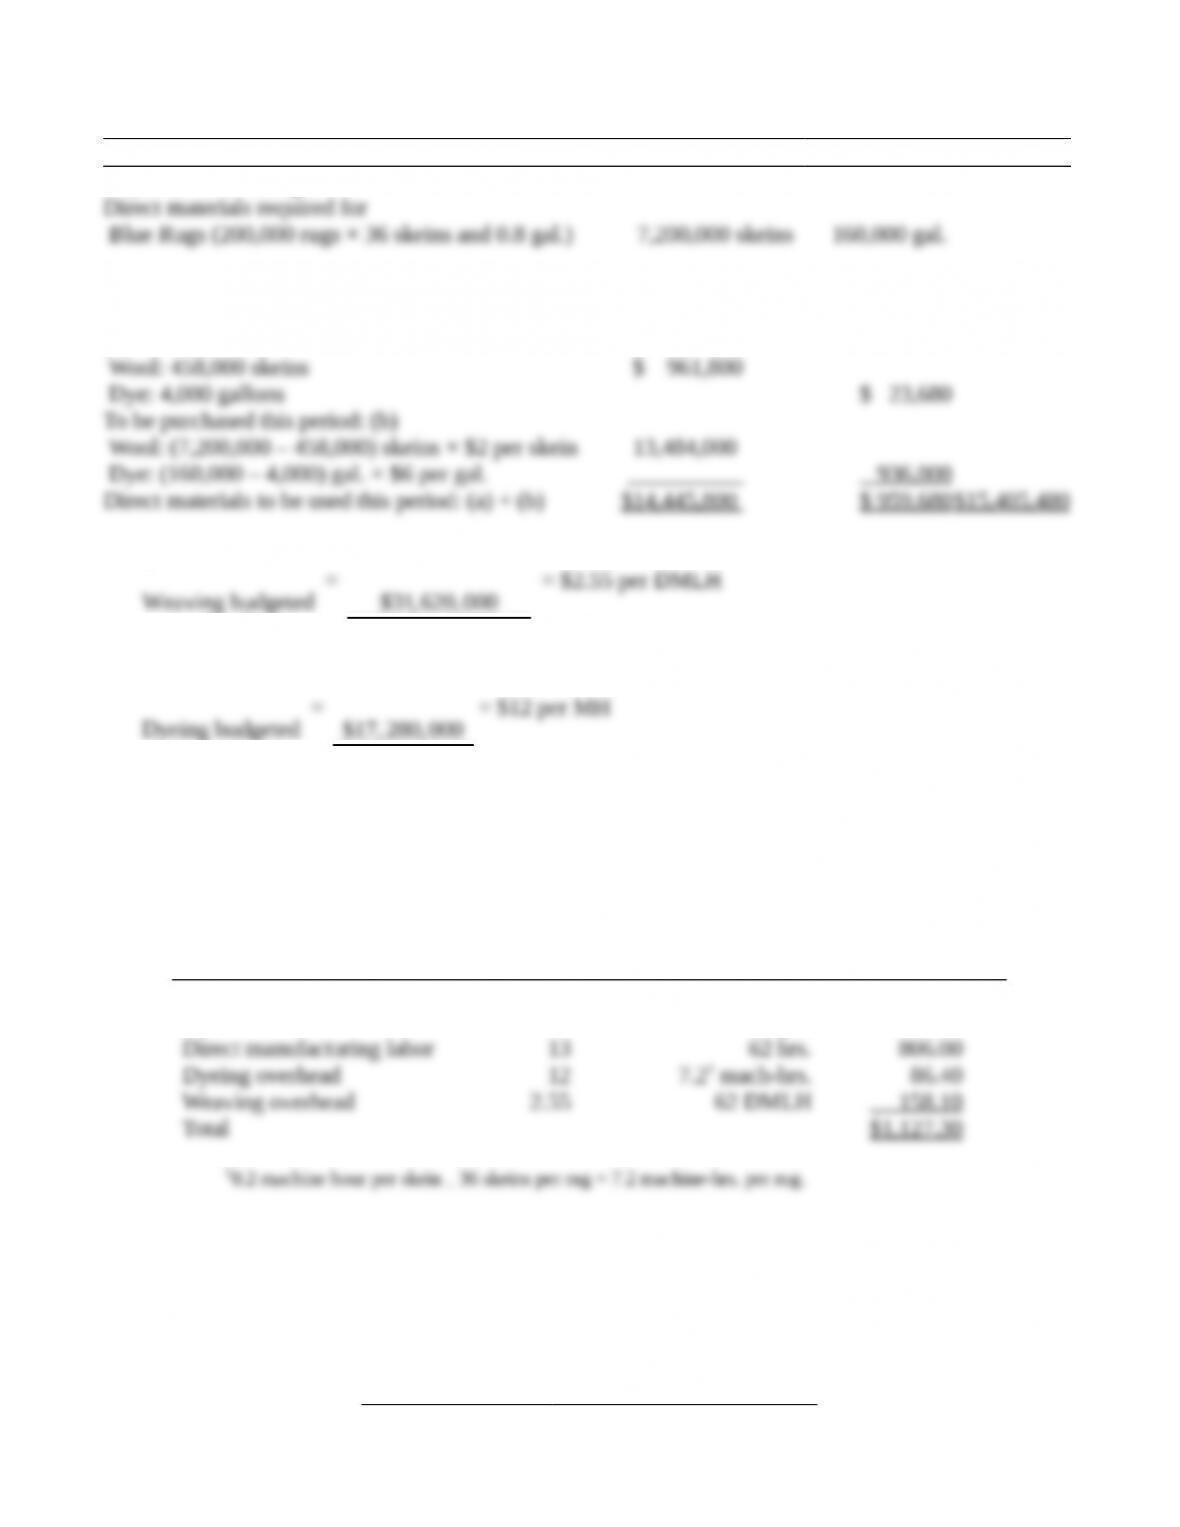
To be purchased this period: (b)
Wool: (7,200,000 – 458,000) skeins × $2 per skein
13,484,000
Dye: (160,000 – 4,000) gal. × $6 per gal.
936,000
Direct materials to be used this period: (a) + (b)
$14,445,800
$ 959,680
$15,405,480
2.
Weaving budgeted
overhead rate
=
$31,620,000
12,400,000 DMLH
= $2.55 per DMLH
Dyeing budgeted
overhead rate
=
$17,280,000
1,440,000 MH
= $12 per MH
3.
Budgeted Unit Cost of Blue Rug
Cost per
Unit of Input
Input per
Unit of
Output
Total
Wool
$ 2
36 skeins
$ 72.00
Dye
6
0.8 gal.
4.80
Direct manufacturing labor
13
62 hrs.
806.00
Dyeing overhead
12
7.21 mach-hrs.
86.40
Weaving overhead
2.55
62 DMLH
158.10
Total
$1,127.30
10.2 machine hour per skein
36 skeins per rug = 7.2 machine-hrs. per rug.
4.
Revenue Budget
Units
Selling
Price
Total Revenues
Blue Rugs
200,000
$2,000
$400,000,000
Blue Rugs
185,000
$2,000
$370,000,000
5a.
Sales = 200,000 rugs
Cost of Goods Sold Budget
From Schedule
Total
Beginning finished goods inventory
$ 0
Direct materials used
$ 15,405,480
Direct manufacturing labor ($806 × 200,000)
161,200,000
Dyeing overhead ($86.40 × 200,000)
17,280,000
Weaving overhead ($158.10 × 200,000)
31,620,000
225,505,480
Cost of goods available for sale
225,505,480
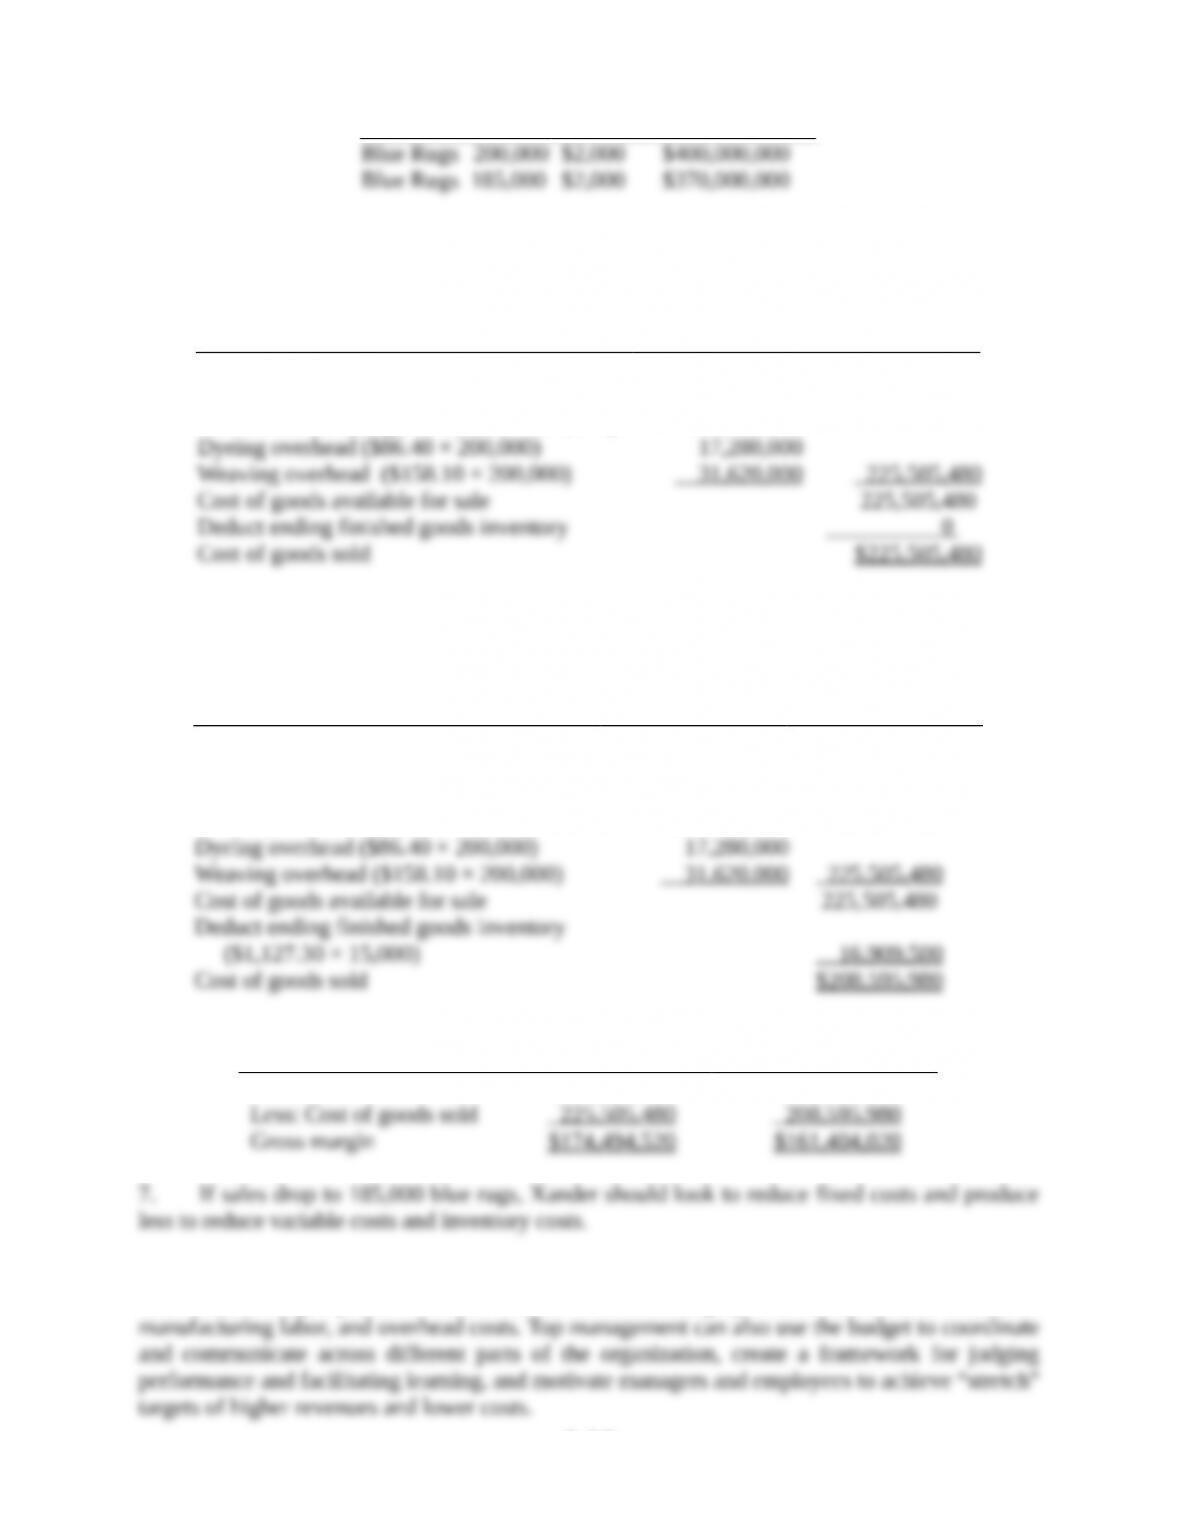
6-10
Deduct ending finished goods inventory
0
Cost of goods sold
$225,505,480
5b.
Sales = 185,000 rugs
Cost of Goods Sold Budget
From Schedule
Total
Beginning finished goods inventory
$ 0
Direct materials used
$ 15,405,480
Direct manufacturing labor ($806 × 200,000)
161,200,000
Dyeing overhead ($86.40 × 200,000)
17,280,000
Weaving overhead ($158.10 × 200,000)
31,620,000
225,505,480
Cost of goods available for sale
225,505,480
Deduct ending finished goods inventory
($1,127.30 × 15,000)
16,909,500
Cost of goods sold
$208,595,980
6.
200,000 rugs sold
185,000 rugs sold
Revenue
$400,000,000
$370,000,000
Less: Cost of goods sold
225,505,480
208,595,980
Gross margin
$174,494,520
$161,404,020
7. If sales drop to 185,000 blue rugs, Xander should look to reduce fixed costs and produce
less to reduce variable costs and inventory costs.
8. Top management can look for ways to increase (stretch) sales and improve quality,
efficiency, and input prices to reduce costs in each cost category such as direct materials, direct
manufacturing labor, and overhead costs. Top management can also use the budget to coordinate
and communicate across different parts of the organization, create a framework for judging
performance and facilitating learning, and motivate managers and employees to achieve “stretch”
targets of higher revenues and lower costs.