Department
Cost
Driver
Sanders
Hanley
Stanley
Design
Engineering
Construction
Design-hours
Engineering-hours
Labor-hours
10%
32
33
50%
32
35
40%
36
32
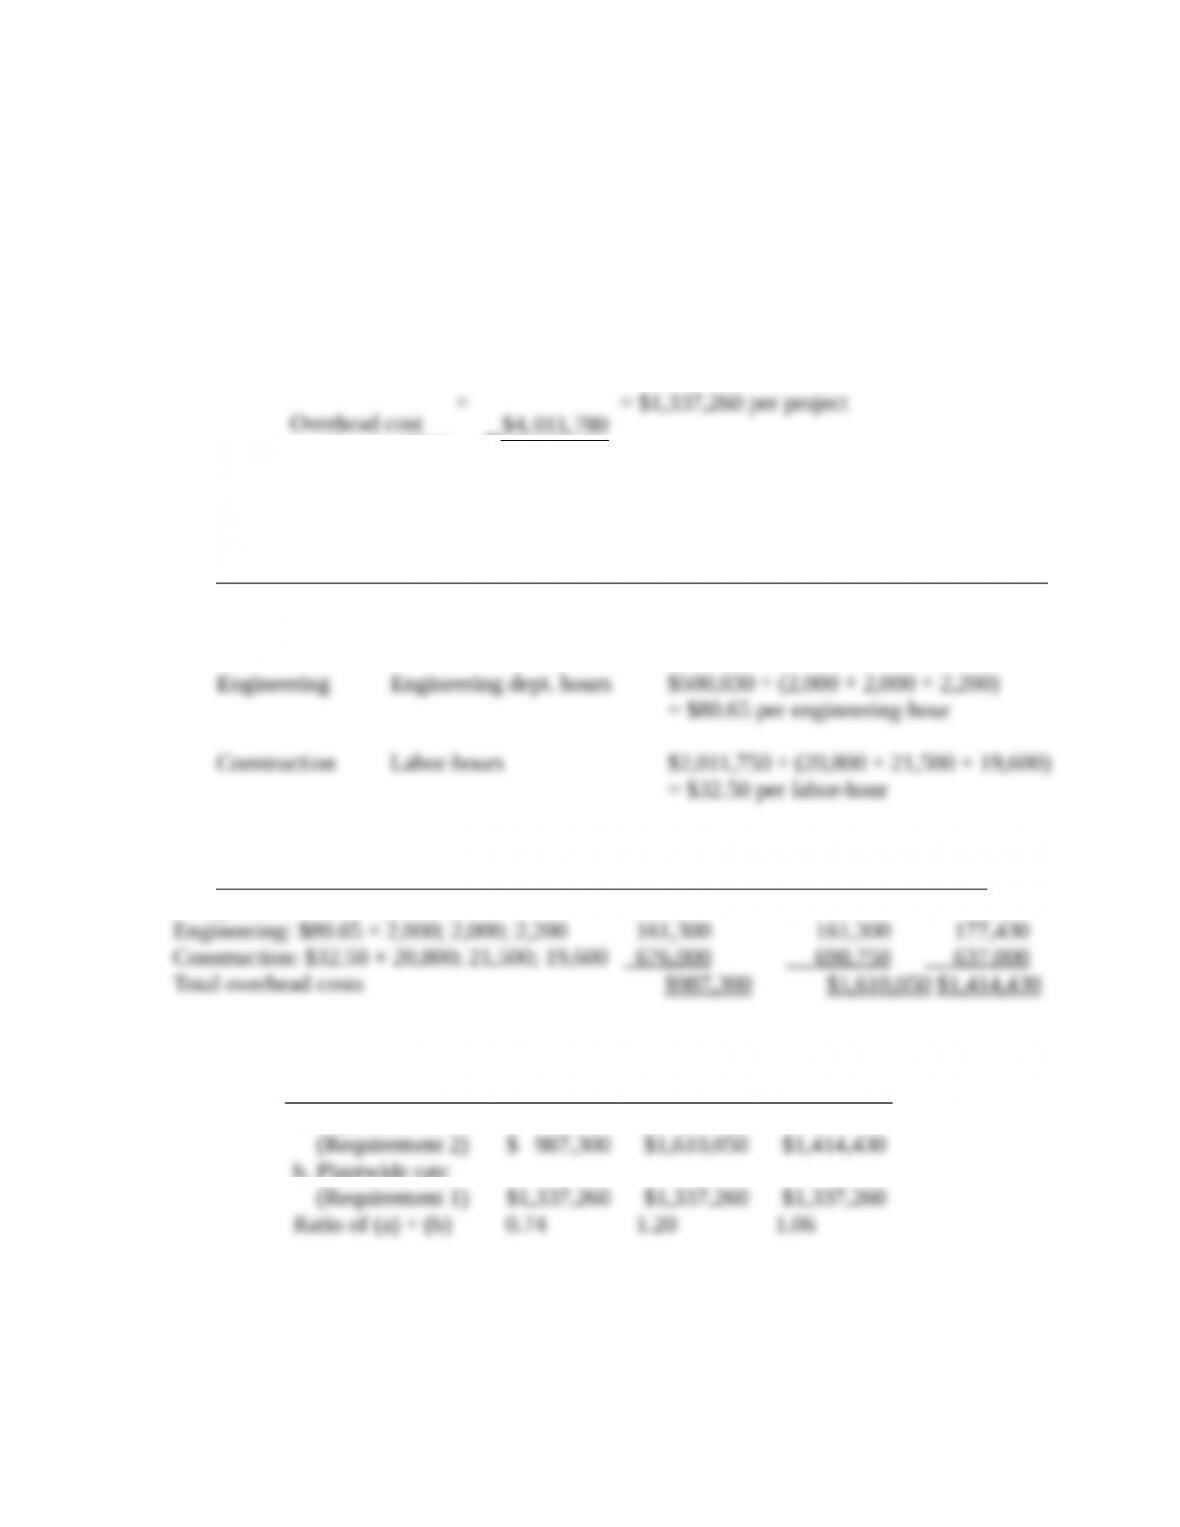
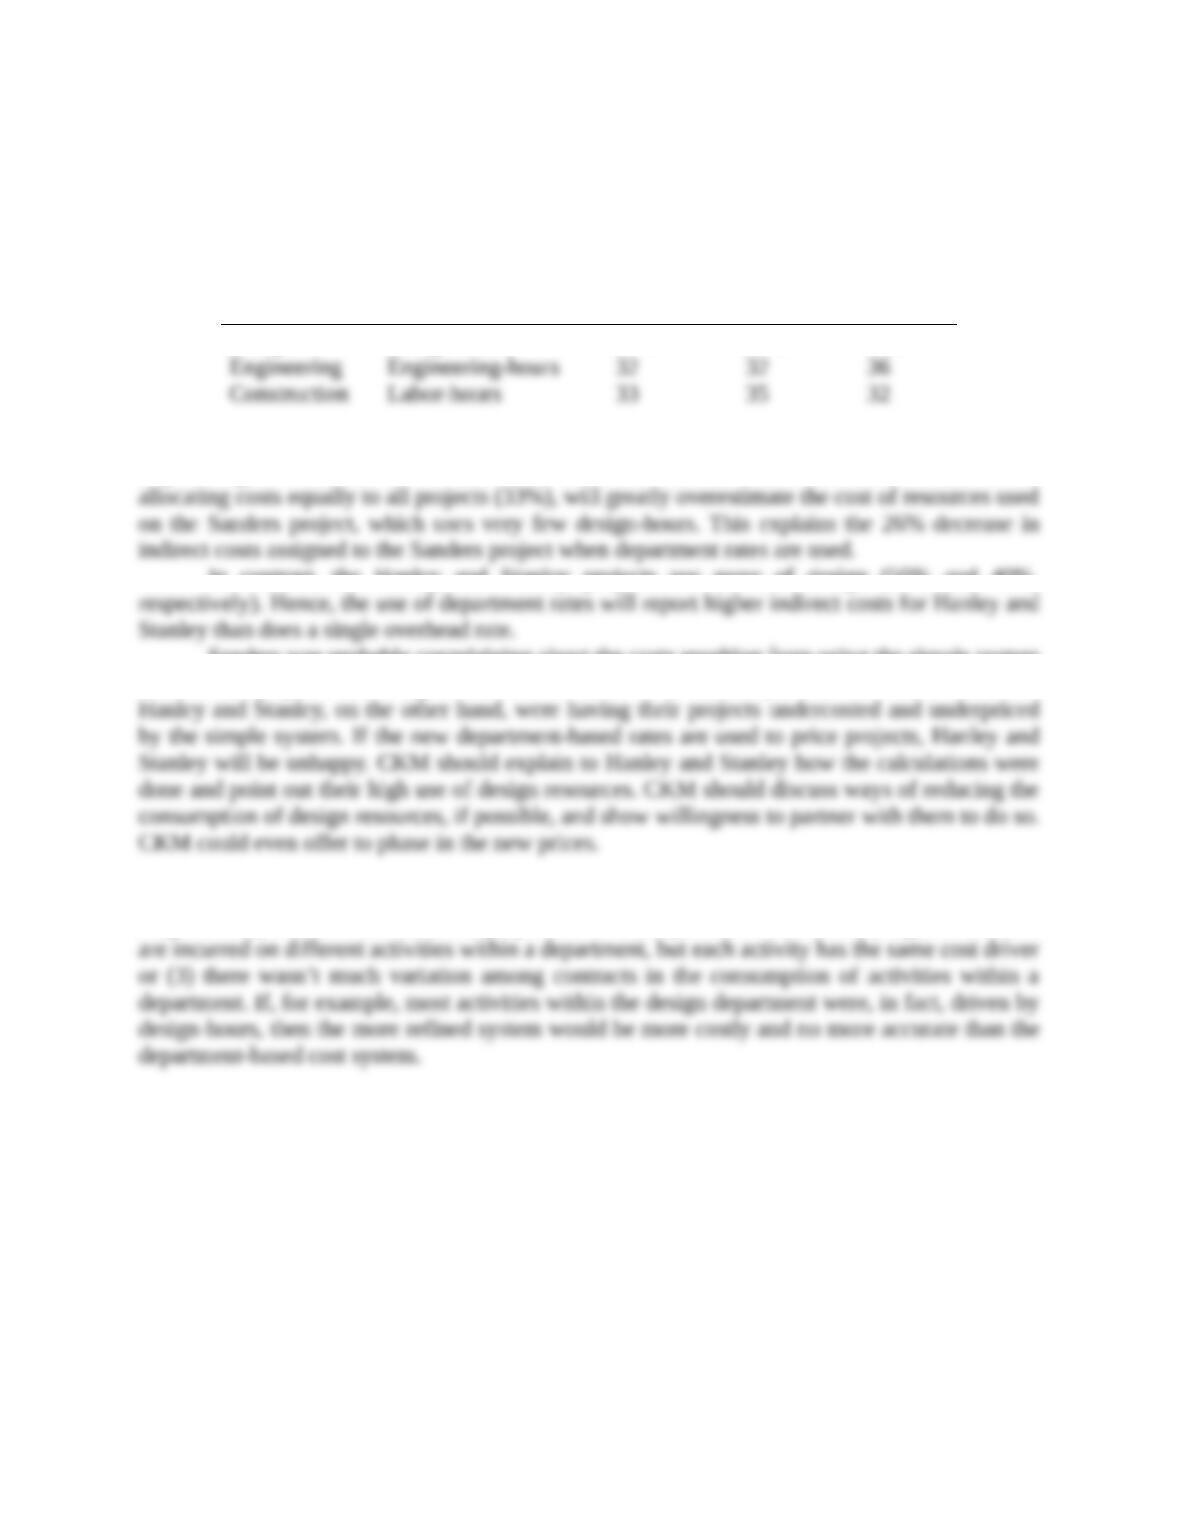
The Sanders project uses only 10% of design-hours in 2014 and uses 32% of engineering–
hours and 33% of construction hours. The result is that the overhead rate, based on allocating costs
equally to all projects (33%), will greatly overestimate the cost of resources used on the Sanders
project, which uses very few design-hours. This explains the 26% decrease in indirect costs
assigned to the Sanders project when department rates are used.
In contrast, the Hanley and Stanley projects use more of design (50% and 40%,
respectively). Hence, the use of department rates will report higher indirect costs for Hanley and
Stanley than does a single overhead rate.
Sanders was probably complaining about the costs resulting from using the simple system
because its project was being overcosted relative to its consumption of overhead resources. Hanley
and Stanley, on the other hand, were having their projects undercosted and underpriced by the
simple system. If the new department-based rates are used to price projects, Hanley and Stanley
will be unhappy. CKM should explain to Hanley and Stanley how the calculations were done and
point out their high use of design resources. CKM should discuss ways of reducing the
consumption of design resources, if possible, and show willingness to partner with them to do so.
CKM could even offer to phase in the new prices.
4. It would not be worthwhile to further refine the cost system into an ABC system if (1) a
single activity accounts for a sizable proportion of the department’s costs or (2) significant costs
are incurred on different activities within a department, but each activity has the same cost driver
or (3) there wasn’t much variation among contracts in the consumption of activities within a
department. If, for example, most activities within the design department were, in fact, driven by
design-hours, then the more refined system would be more costly and no more accurate than the
department-based cost system.
5-23 (30 min.) Activity-based costing, service company.
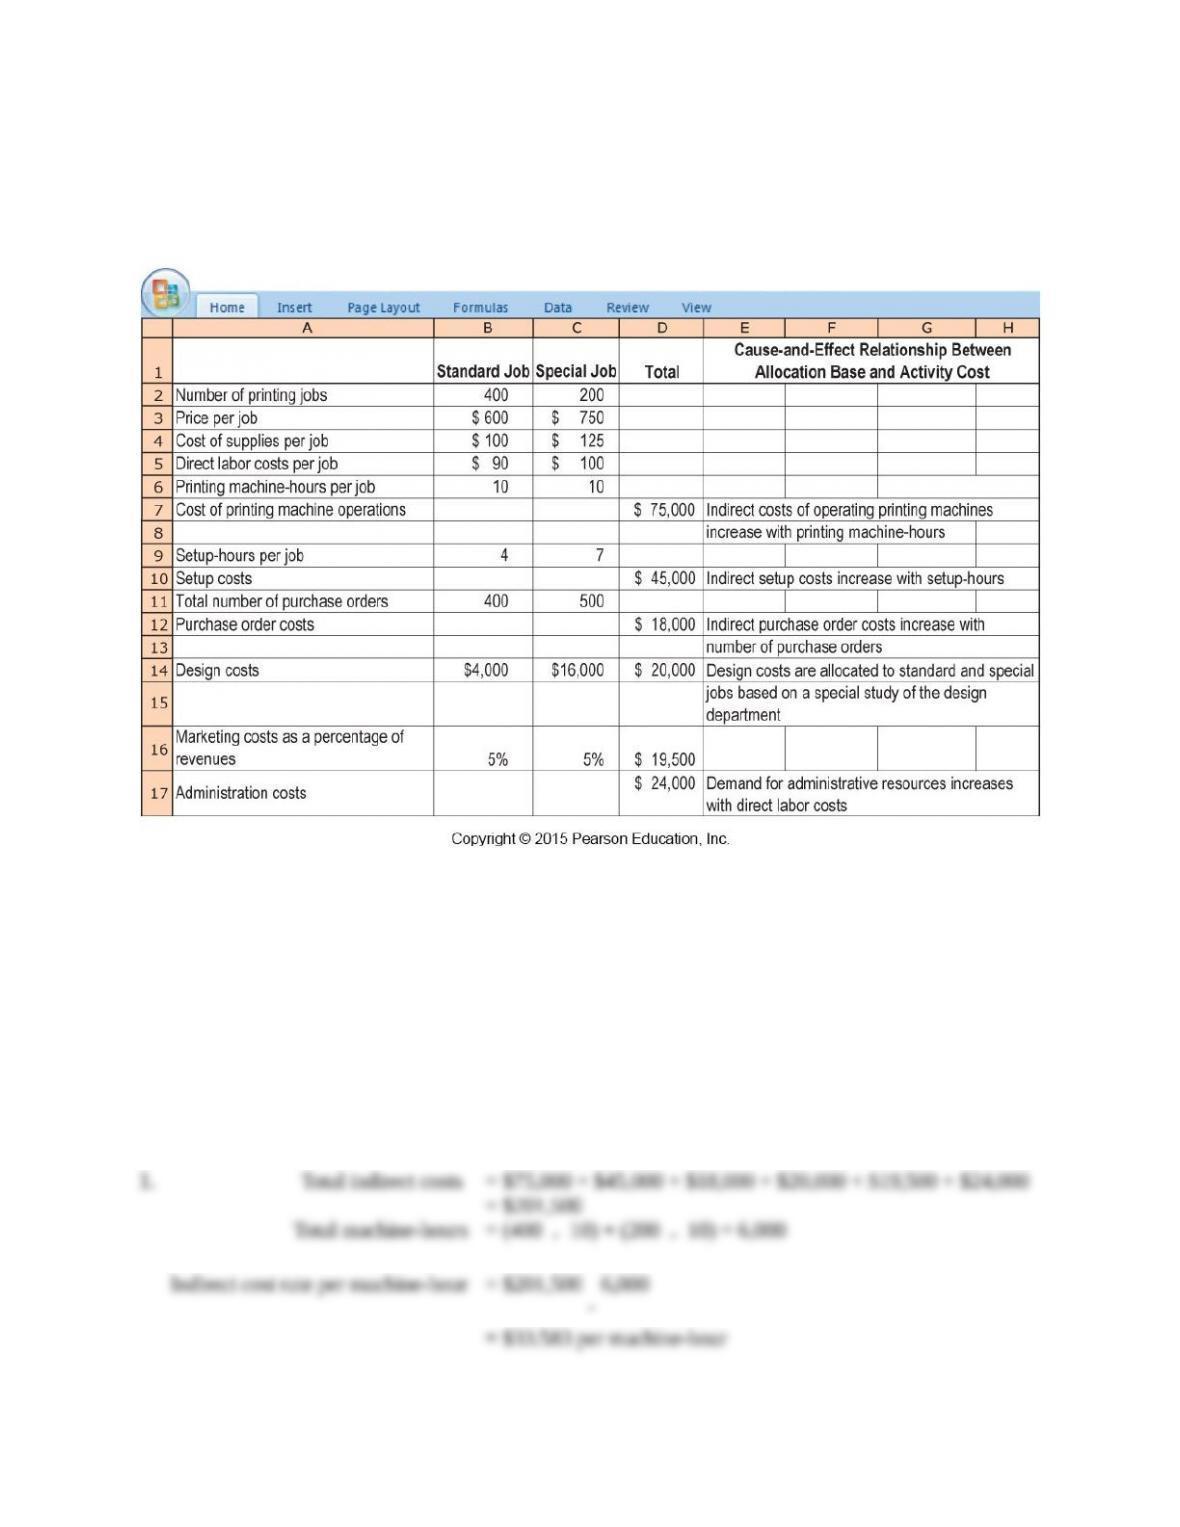
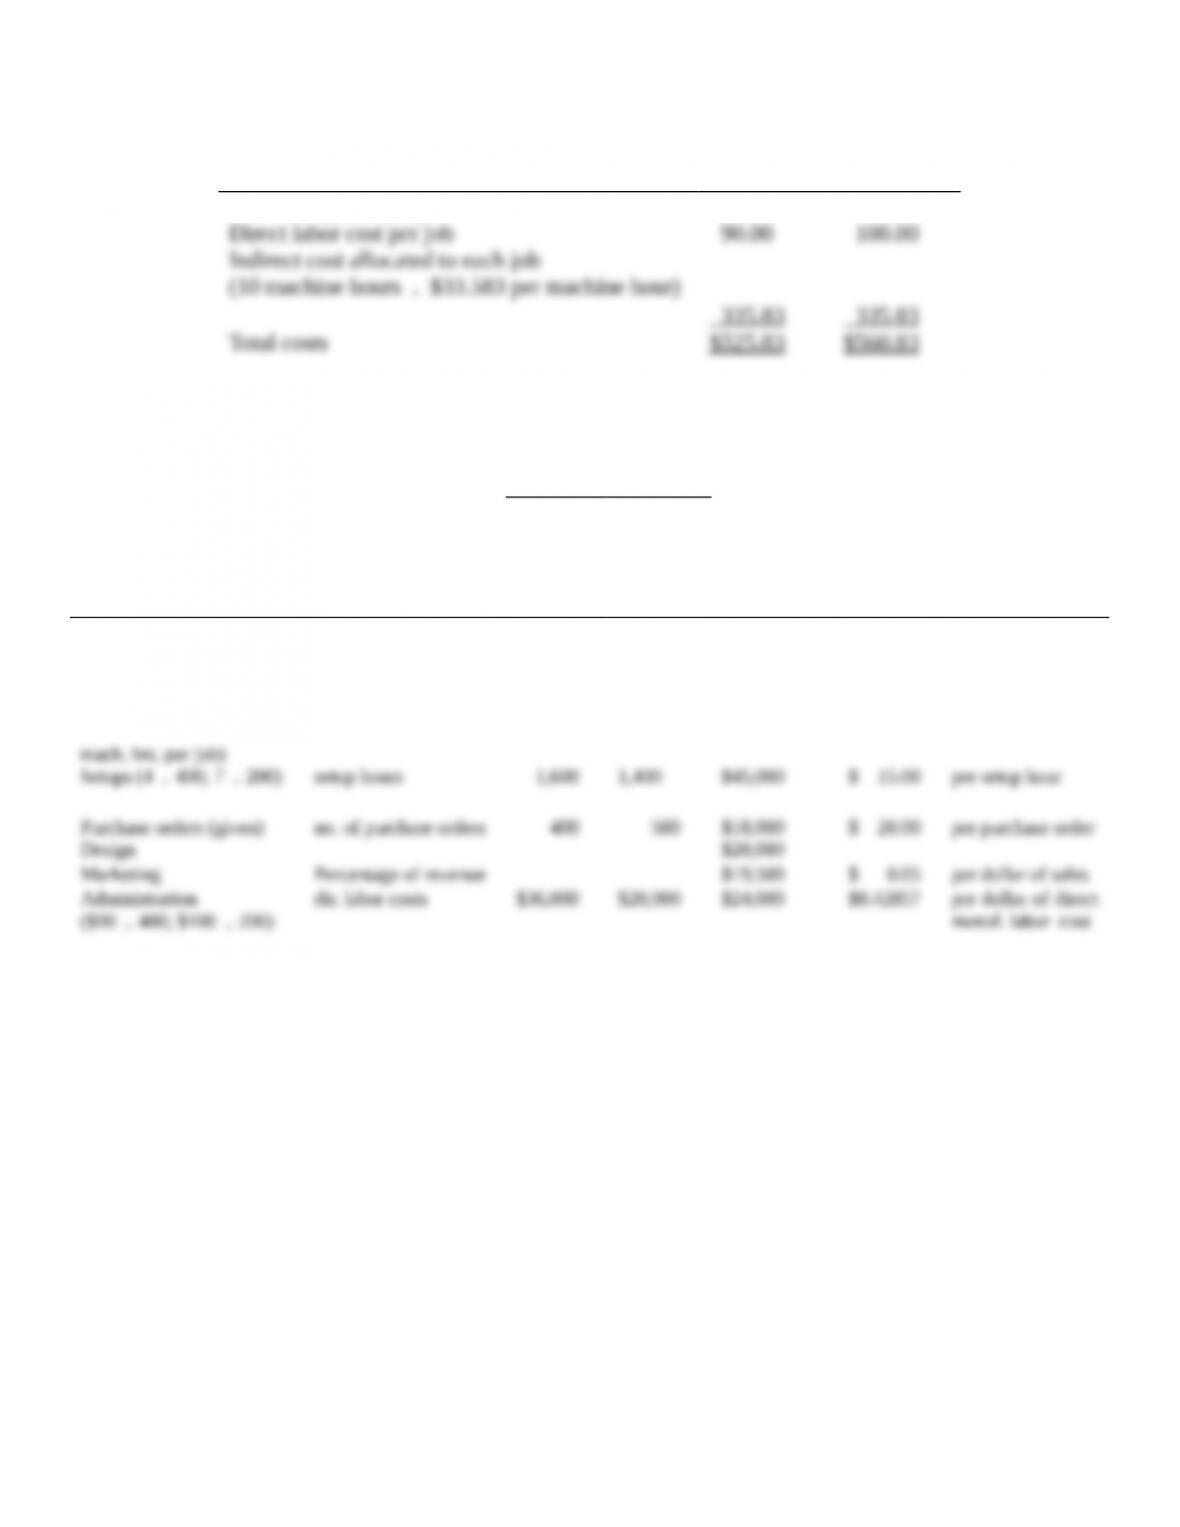
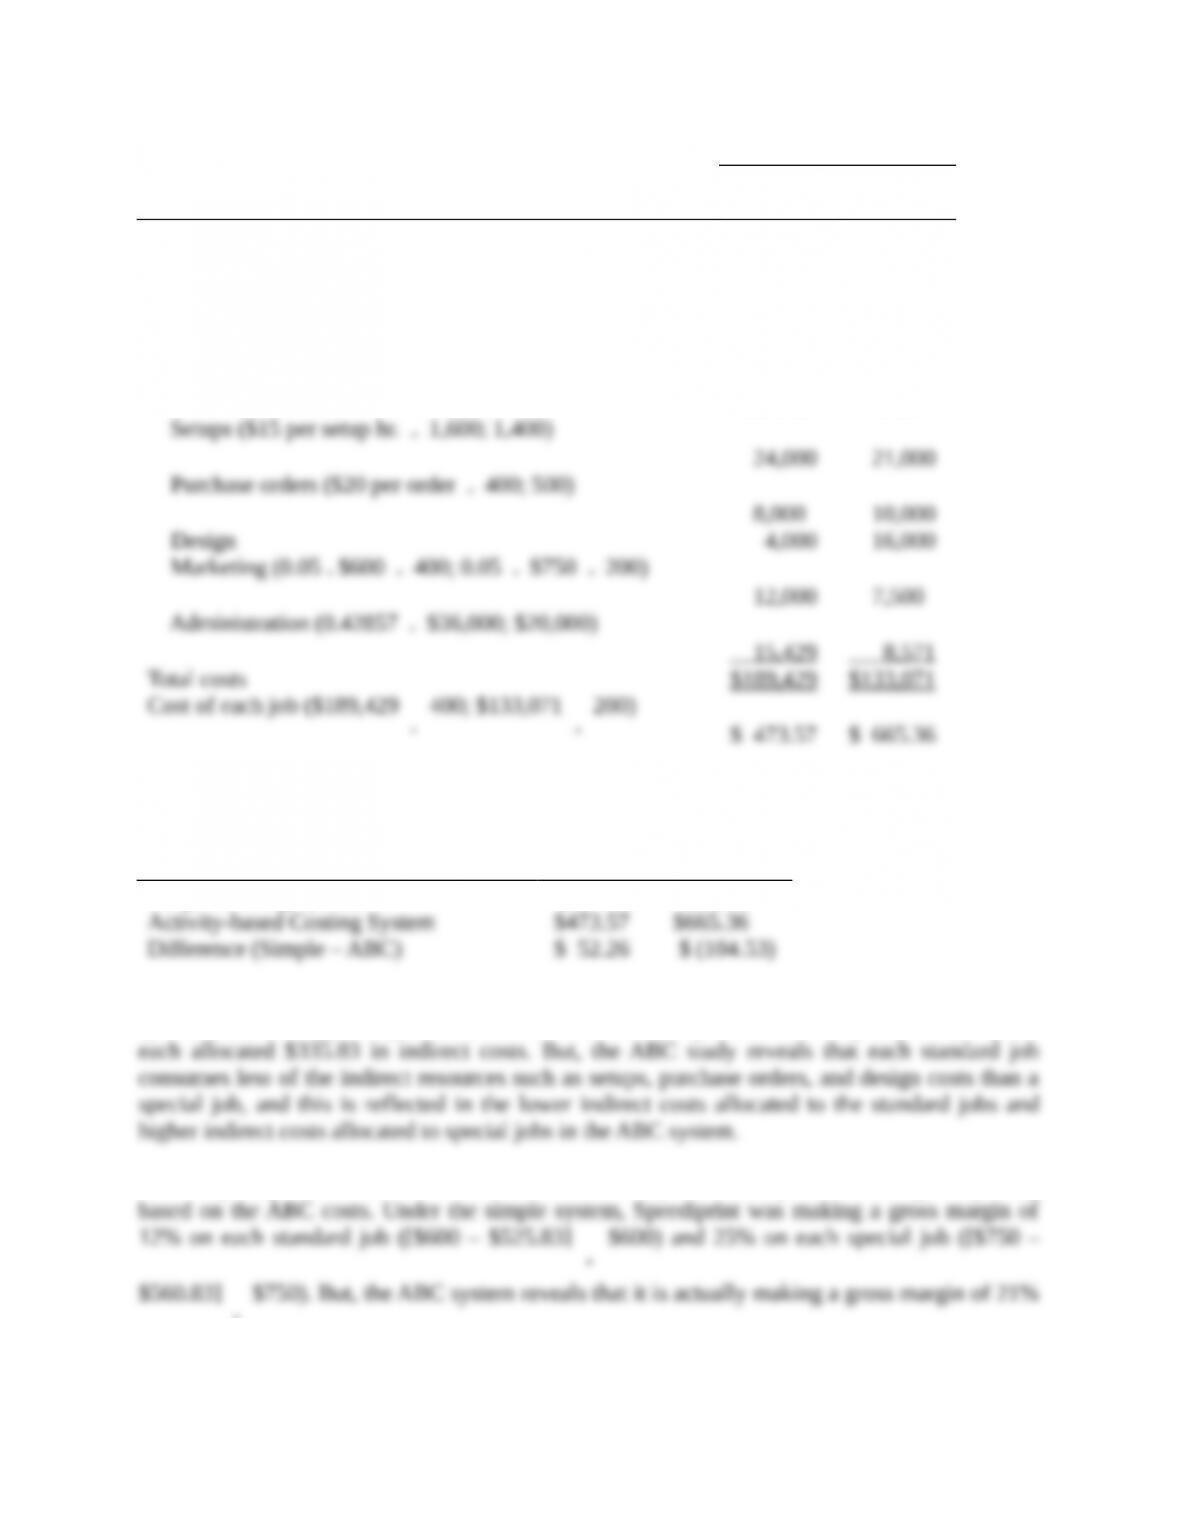
Speediprint Corporation owns a small printing press that prints leaflets, brochures, and advertising
materials. Speediprint classifies its various printing jobs as standard jobs or special jobs.
Speediprint’s simple job-costing system has two direct-cost categories (direct materials and direct
labor) and a single indirect-cost pool. Speediprint operates at capacity and allocates all indirect
costs using printing machine-hours as the allocation base.
Speediprint is concerned about the accuracy of the costs assigned to standard and special jobs
and therefore is planning to implement an activity-based costing system. Speediprint’s ABC
system would have the same direct–cost categories as its simple costing system. However, instead
of a single indirect-cost pool there would now be six categories for assigning indirect costs: design,
purchasing, setup, printing machine opera– tions, marketing, and administration. To see how
activity-based costing would affect the costs of standard and special jobs, Speediprint collects the
following information for the fiscal year 2014 that just ended.
Activity
(1)
Total Cost of
Activity
(2)
Cost Driver
(3)
Cost Driver
Quantity
(4)
Allocation Rate
(5) = (2) (4)
Product scheduling
$190,000
production runs
125c
$1,520.00
per production run
Material handling
$ 90,000
material moves
240d
$ 375.00
per material move
Machine setup
$ 50,000
machine setups
200e
$ 250.00
per setup
Assembly
$120,000
machine hours
10,000
$ 12.00
per machine hour
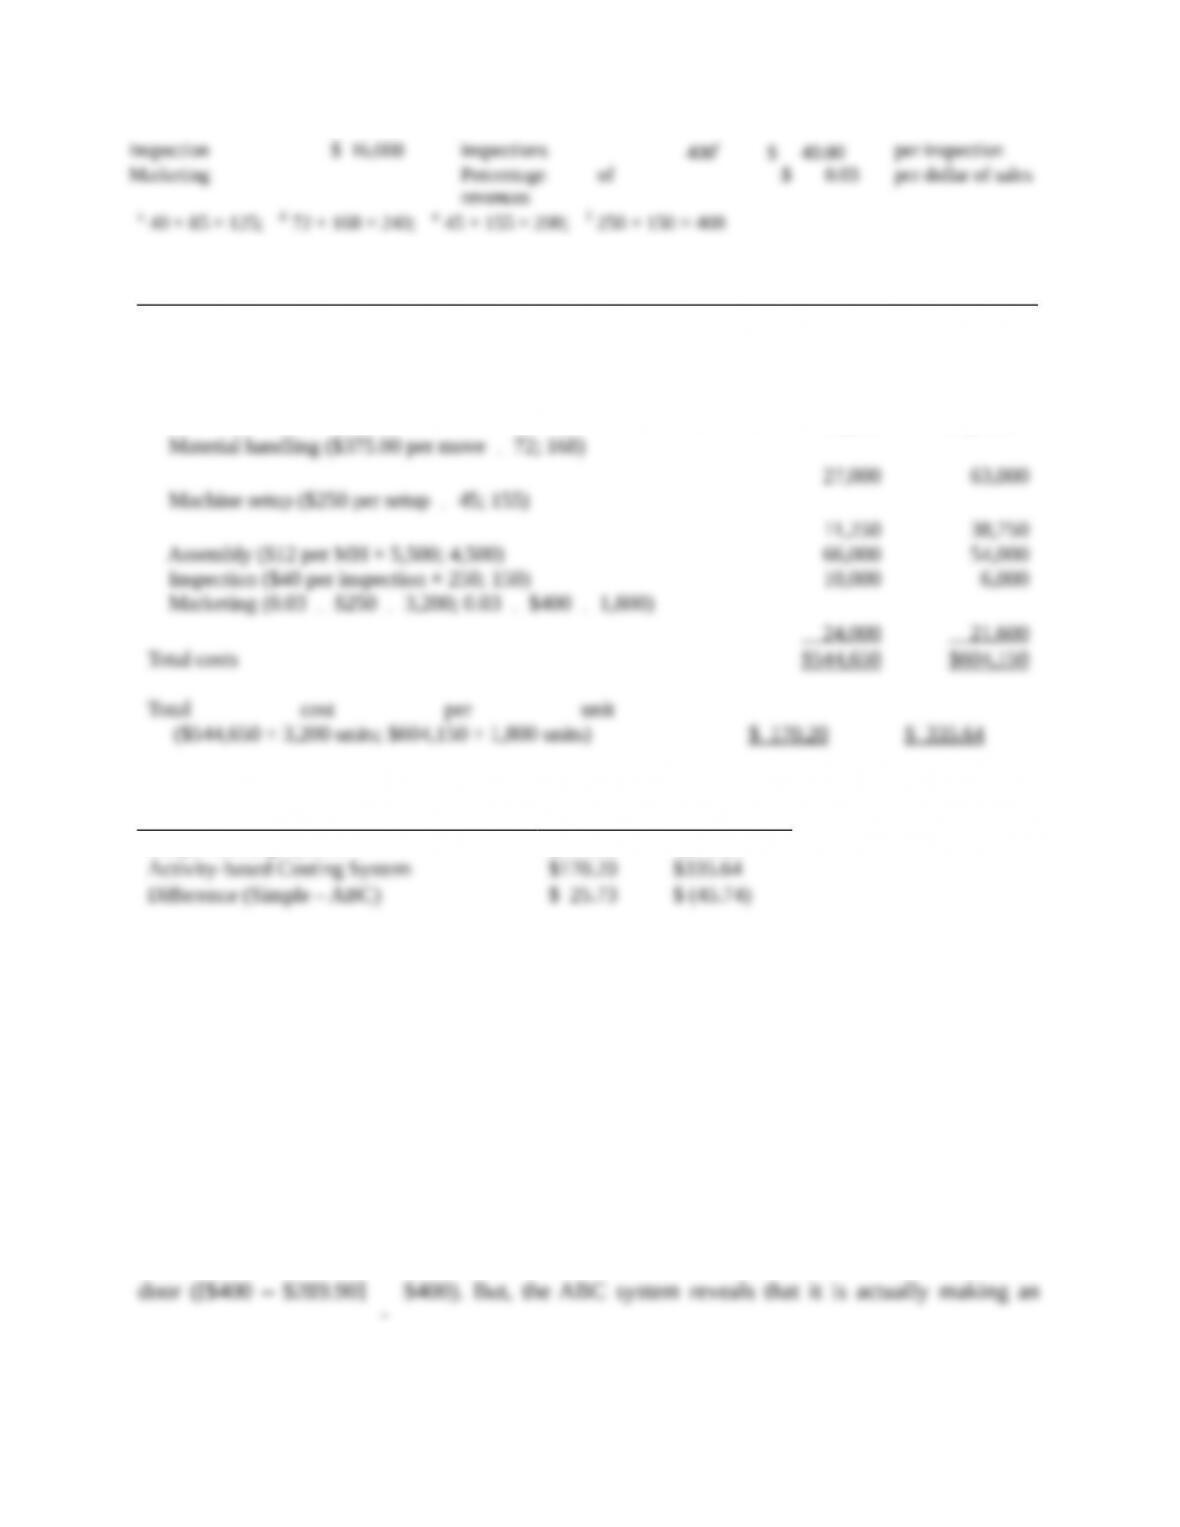
Inspection
$ 16,000
inspections
400f
$ 40.00
per inspection
Marketing
Percentage of
revenues
$ 0.03
per dollar of sales
c 40 + 85 = 125; d 72 + 168 = 240; e 45 + 155 = 200; f 250 + 150 = 400
ABC System
Interior
Exterior
Direct materials
$192,000
$162,000
Direct manufacturing labor
153,600
129,600
Indirect costs allocated:
Product scheduling ($1,520 per run
40; 85)
60,800
129,200
Material handling ($375.00 per move
72; 168)
27,000
63,000
Machine setup ($250 per setup
45; 155)
11,250
38,750
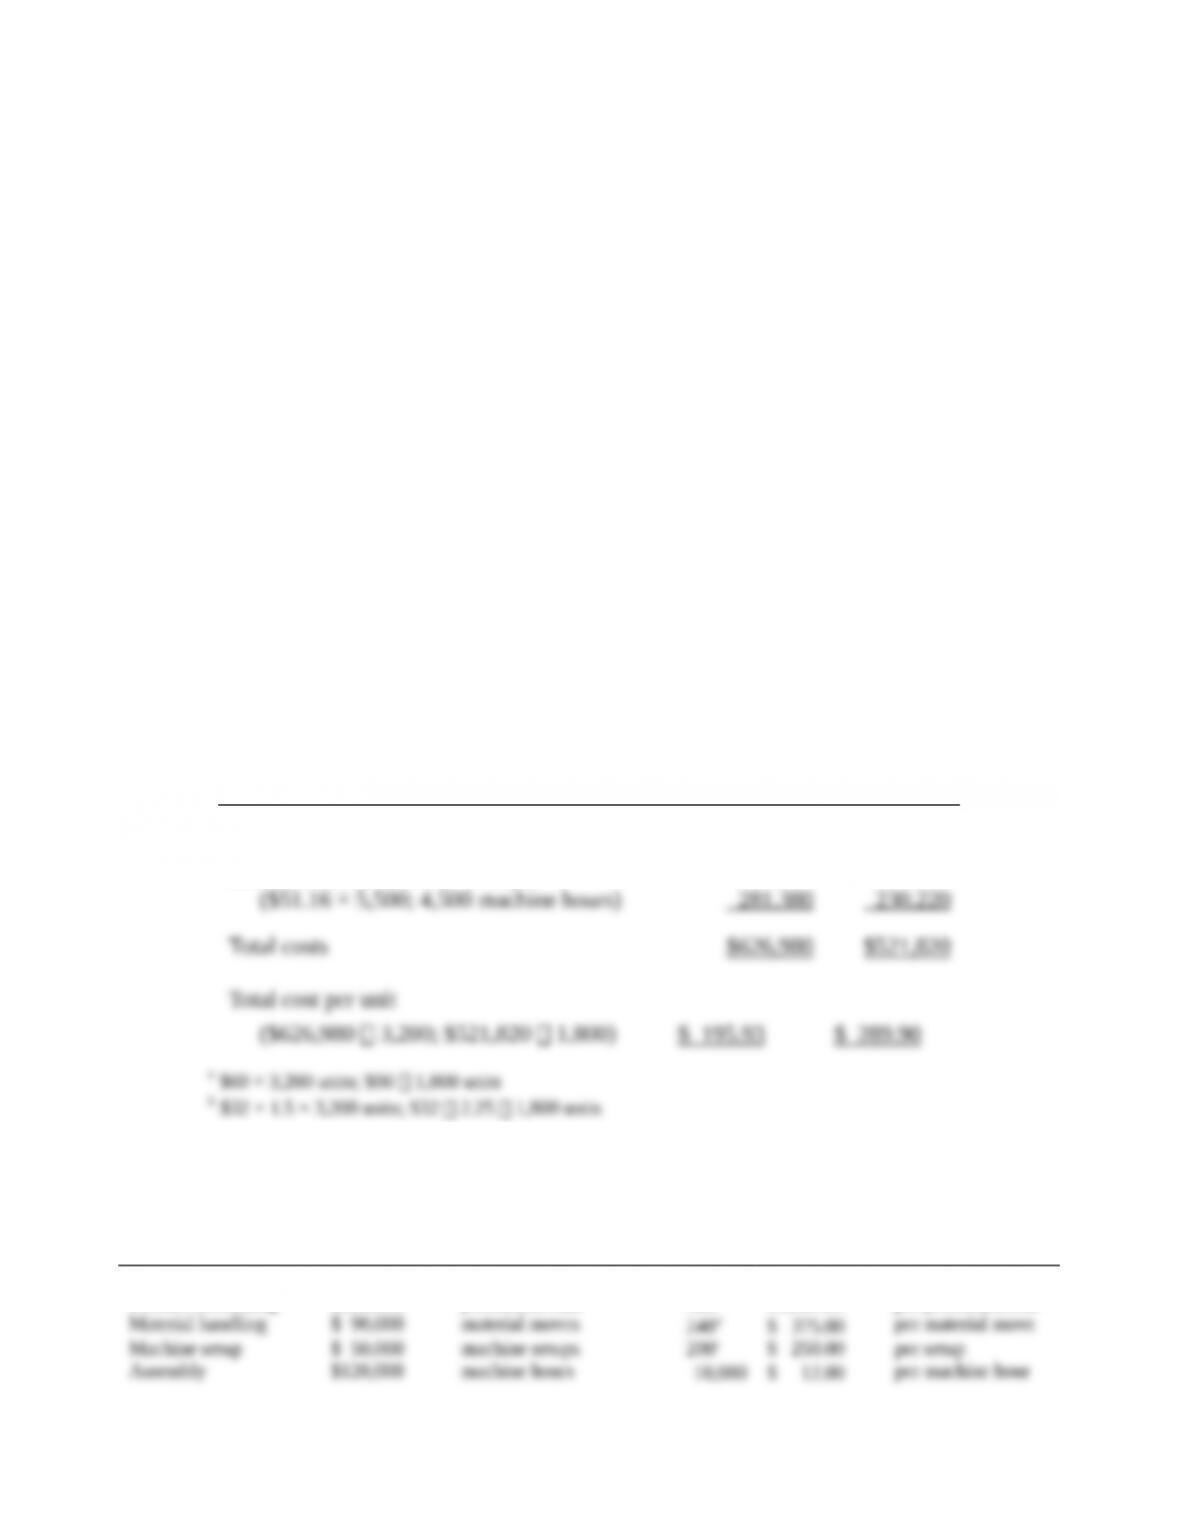
Assembly ($12 per MH × 5,500; 4,500)
66,000
54,000
Inspection ($40 per inspection × 250; 150)
10,000
6,000
Marketing (0.03
$250
3,200; 0.03
$400
1,800)
24,000
21,600
Total costs
$544,650
$604,150
Total cost per unit
($544,650 ÷ 3,200 units; $604,150 ÷ 1,800 units)
$ 170.20
$ 335.64
3.
Cost per unit
Interior
Exterior
Simple Costing System
$195.93
$289.90
Activity-based Costing System
$170.20
$335.64
Difference (Simple – ABC)
$ 25.73
$ (45.74)
Relative to the ABC system, the simple costing system overcosts interior doors and undercosts
exterior doors. Interior doors require 1.72 machine-hours per unit while exterior doors require 2.5
machine-hours per unit. In the simple-costing system, overhead costs are allocated to the interior
and exterior doors on the basis of the machine-hours used by each type of door. The ABC study
reveals that the ratio of the cost of production runs, material moves, and setups for each exterior
door versus each interior door is even higher than the ratio of 2.5 to 1.72 machine-hours for each
exterior relative to each interior door. This higher ratio results in higher indirect costs allocated to
exterior doors relative to interior doors in the ABC system.
4. Fancy Doors, Inc. can use the information revealed by the ABC system to change its pricing
based on the ABC costs. Under the simple system, Fancy Doors was making an operating margin
of 21.6% on each interior door ([$250 – $195.93]
$250) and 27.5% on each exterior door ([$400
– $289.90]
$400). But, the ABC system reveals that it is actually making an operating margin
of about 32% ([$250 – $170.20]
$250) on each interior door and about 16% ([$400 – $335.64]
$400) on each exterior door. Fancy Doors, Inc., should consider decreasing the price of its
interior doors to be more competitive. Fancy Doors should also consider increasing the price of
its exterior doors, depending on the competition it faces in this market.
Fancy Doors can also use the ABC information to improve its own operations. It could
examine each of the indirect cost categories and analyze whether it would be possible to deliver
the same level of service, but consume fewer indirect resources, or find a way to reduce the per–
unit-cost-driver cost of some of those indirect resources. Making these operational improvements
can help Fancy Doors to reduce costs, become more competitive, and reduce prices to gain further
market share while increasing its profits.
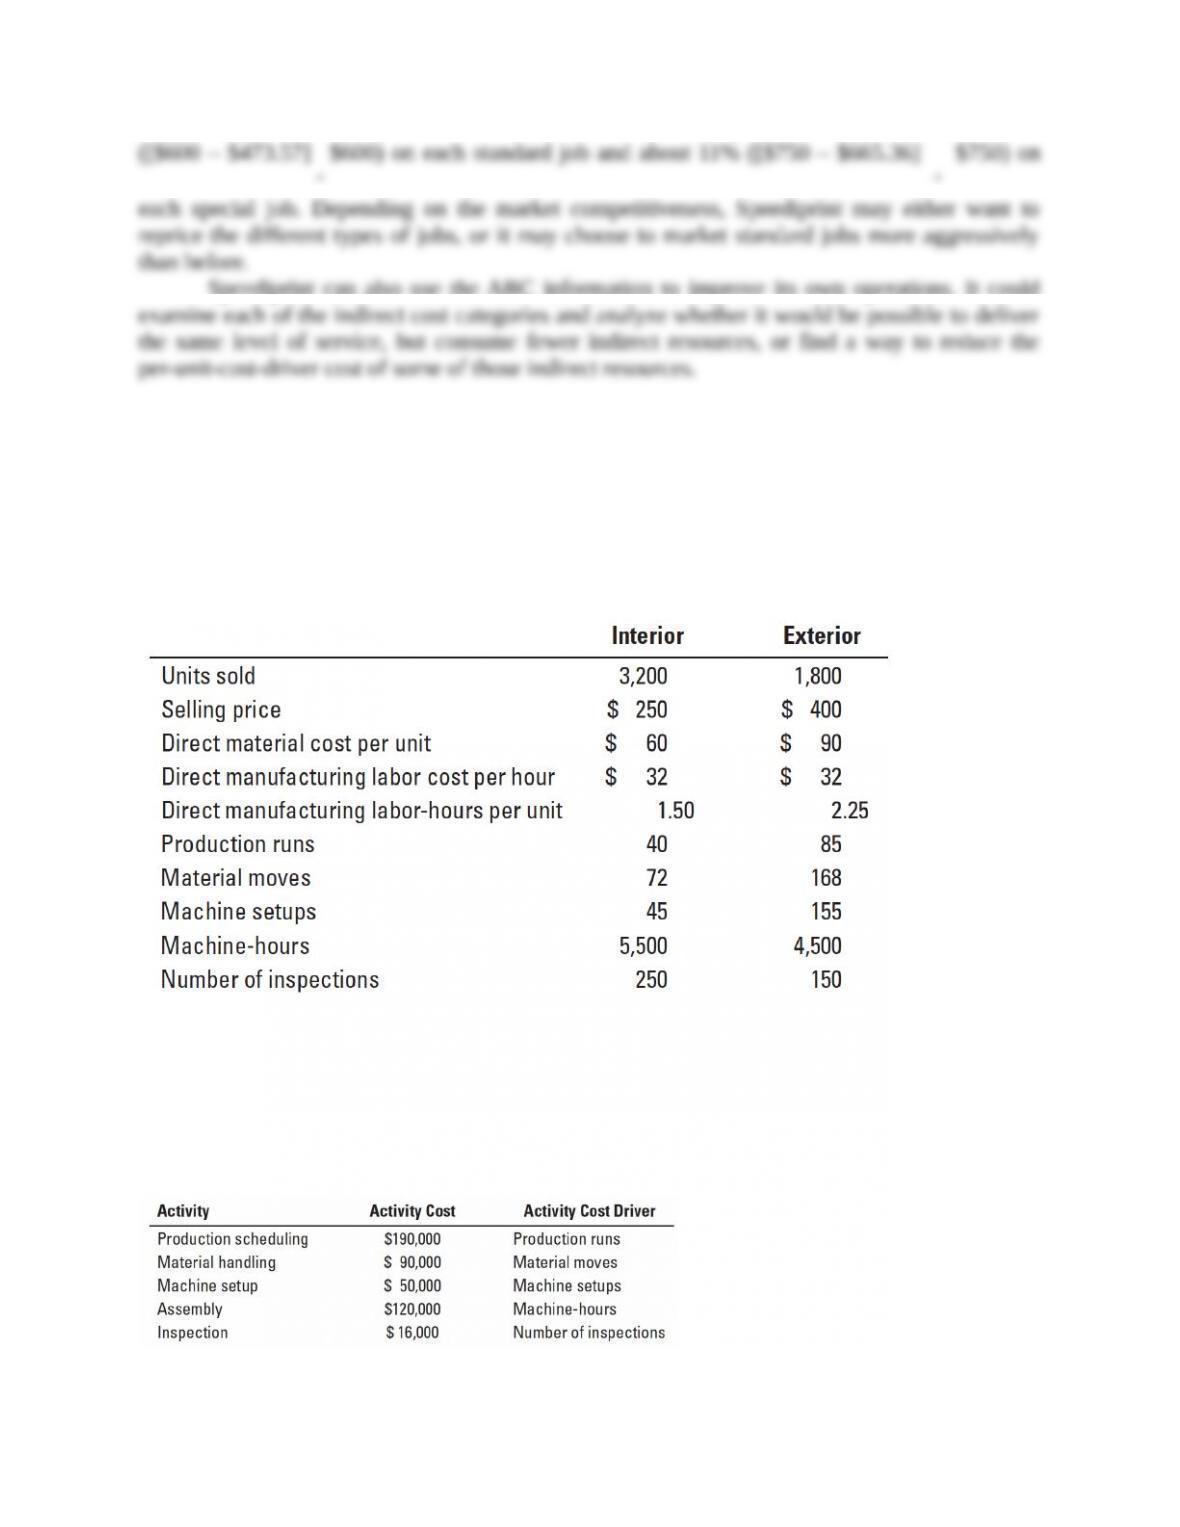
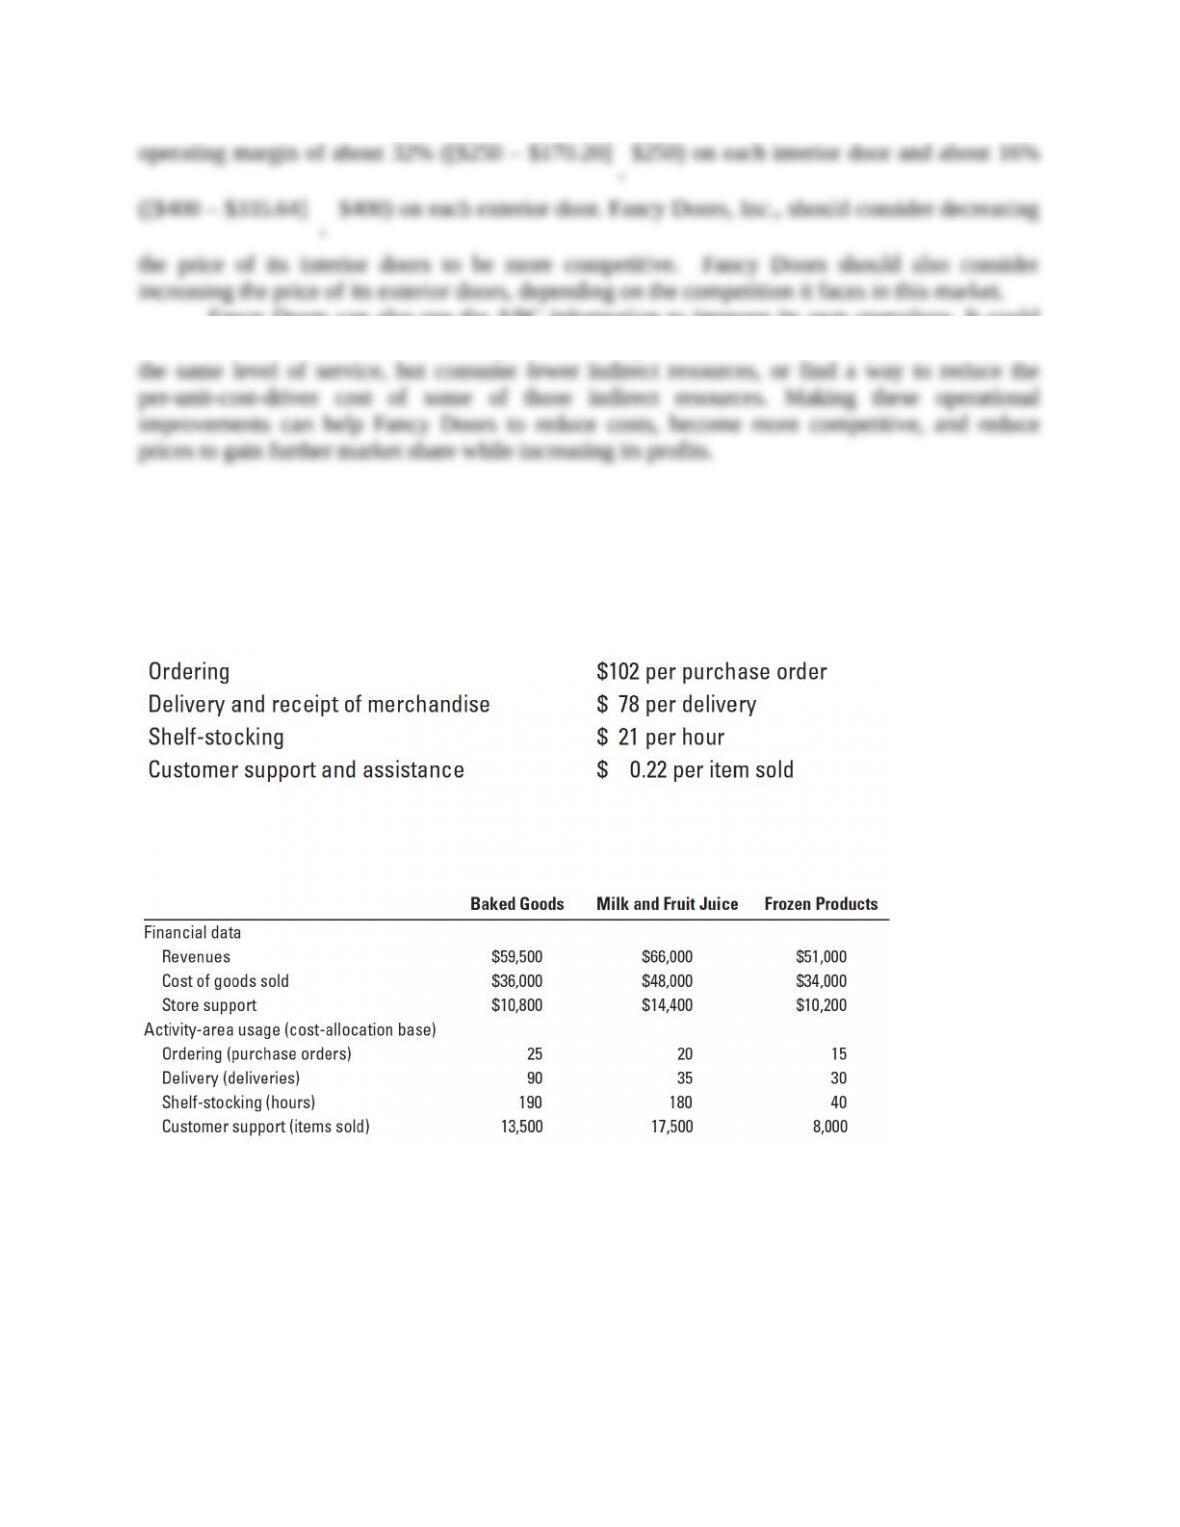
5-25 (30 min.) ABC, retail product-line profitability.
Henderson Supermarkets (HS) operates at capacity and decides to apply ABC analysis to three
product lines: baked goods, milk and fruit juice, and frozen foods. It identifies four activities and
their activity cost rates as follows:
The revenues, cost of goods sold, store support costs, activities that account for the store support
costs, and activity-area usage of the three product lines are as follows:
Under its simple costing system, HS allocated support costs to products at the rate of 30% of cost
of goods sold.
Required:
1. Use the simple costing system to prepare a product-line profitability report for HS.
2. Use the ABC system to prepare a product-line profitability report for HS.
3. What new insights does the ABC system in requirement 2 provide to HS managers?
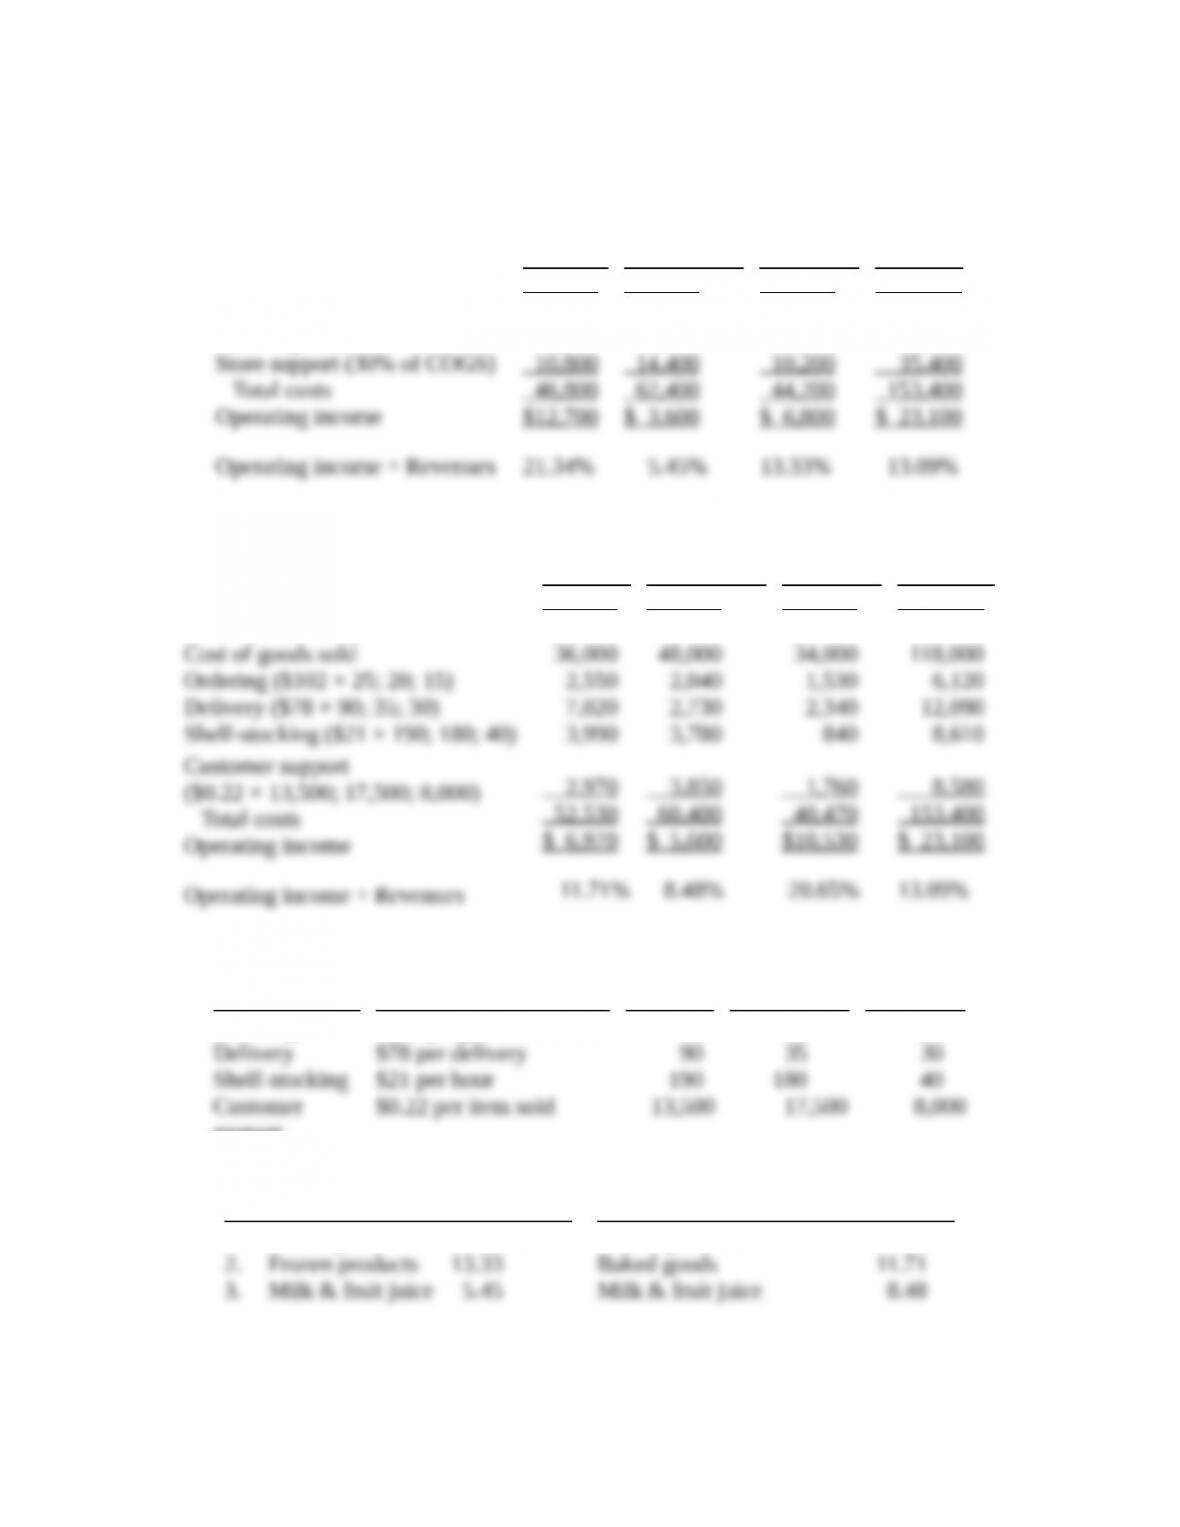
SOLUTION
1. The simple costing system (Panel A of Solution Exhibit 5-25) reports the following:
Baked
Goods
Milk &
Fruit Juice
Frozen
Products
Total
Revenues
Costs
Cost of goods sold
Store support (30% of COGS)
Total costs
Operating income
Operating income ÷ Revenues
$59,500
36,000
10,800
46,800
$12,700
21.34%
$66,000
48,000
14,400
62,400
$ 3,600
5.45%
$51,000
34,000
10,200
44,200
$ 6,800
13.33%
$176,500
118,000
35,400
153,400
$ 23,100
13.09%
2. The ABC system (Panel B of Solution Exhibit 5-25) reports the following:
Baked
Goods
Milk &
Fruit Juice
Frozen
Products
Total
Revenues
Costs
Cost of goods sold
Ordering ($102 × 25; 20; 15)
Delivery ($78 × 90; 35; 30)
Shelf-stocking ($21 × 190; 180; 40)
Customer support
($0.22 × 13,500; 17,500; 8,000)
Total costs
Operating income
Operating income ÷ Revenues
$59,500
36,000
2,550
7,020
3,990
2,970
52,530
$ 6,970
11.71%
$66,000
48,000
2,040
2,730
3,780
3,850
60,400
$ 5,600
8.48%
$51,000
34,000
1,530
2,340
840
1,760
40,470
$10,530
20.65%
$176,500
118,000
6,120
12,090
8,610
8,580
153,400
$ 23,100
13.09%
These activity costs are based on the following:
Activity
Cost Allocation Rate
Baked
Goods
Milk &
Fruit Juice
Frozen
Products
Ordering
Delivery
Shelf-stocking
Customer
support
$102 per purchase order
$78 per delivery
$21 per hour
$0.22 per item sold
25
90
190
13,500
20
35
180
17,500
15
30
40
8,000
3. The rankings of products in terms of relative profitability are:
Simple Costing System
ABC System
1. Baked goods 21.33%
2. Frozen products 13.33
3. Milk & fruit juice 5.45
Frozen products 20.65%
Baked goods 11.71
Milk & fruit juice 8.48
The percentage revenue, COGS, and activity costs for each product line are:
Baked
Goods
Milk &
Fruit Juice
Frozen
Products
Total
Revenues
COGS
Activity areas:
Ordering
Delivery
Shelf-stocking
Customer support
33.71
30.51
41.67
58.06
46.34
34.62
37.39
40.68
33.33
22.58
43.90
44.87
28.90
28.81
25.00
19.36
9.76
20.51
100.00
100.00
100.00
100.00
100.00
100.00
The baked goods line drops sizably in profitability when ABC is used. Although it constitutes
30.71% of COGS, it uses a higher percentage of total resources in each activity area, especially
the high-cost delivery activity area. In contrast, frozen products draw a much lower percentage of
total resources used in each activity area than its percentage of total COGS. Hence, under ABC,
frozen products are much more profitable.
Henderson Supermarkets may want to explore ways to increase sales of frozen products.
It may also want to explore price increases on baked goods.