Design
Engineering
Production
CAD-design hours
Engineering hours
Machine hours
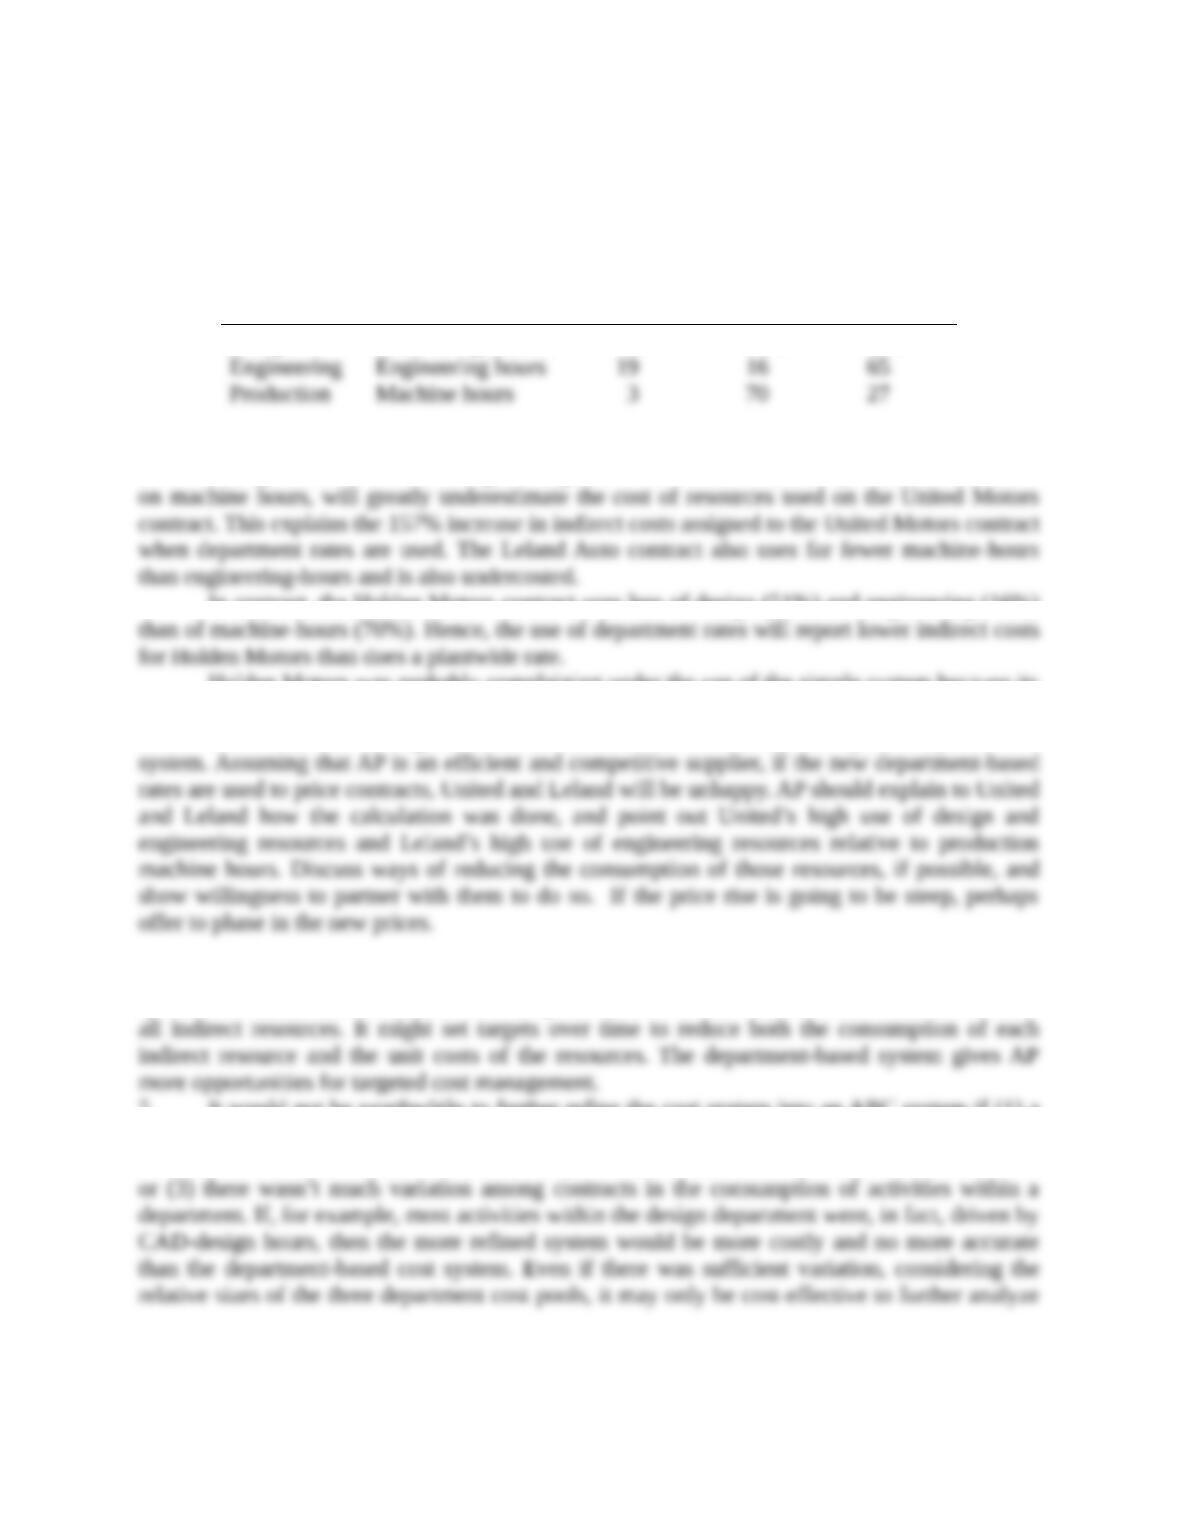
28%
19
3
51%
16
70
21%
65
27
The United Motors contract uses only 3% of total machines hours in 2011, yet uses 28%
of CAD design-hours and 19% of engineering hours. The result is that the plantwide rate, based
on machine hours, will greatly underestimate the cost of resources used on the United Motors
contract. This explains the 157% increase in indirect costs assigned to the United Motors contract
when department rates are used. The Leland Auto contract also uses far fewer machine-hours than
engineering-hours and is also undercosted.
In contrast, the Holden Motors contract uses less of design (51%) and engineering (16%)
than of machine-hours (70%). Hence, the use of department rates will report lower indirect costs
for Holden Motors than does a plantwide rate.
Holden Motors was probably complaining under the use of the simple system because its
contract was being overcosted relative to its consumption of MOH resources. United and Leland,
on the other hand, were having their contracts undercosted and underpriced by the simple
system. Assuming that AP is an efficient and competitive supplier, if the new department-based
rates are used to price contracts, United and Leland will be unhappy. AP should explain to United
and Leland how the calculation was done, and point out United’s high use of design and
engineering resources and Leland’s high use of engineering resources relative to production
machine hours. Discuss ways of reducing the consumption of those resources, if possible, and
show willingness to partner with them to do so. If the price rise is going to be steep, perhaps offer
to phase in the new prices.
4. Other than for pricing, AP can also use the information from the department-based system
to examine and streamline its own operations so that there is maximum value-added from all
indirect resources. It might set targets over time to reduce both the consumption of each indirect
resource and the unit costs of the resources. The department-based system gives AP more
opportunities for targeted cost management.
5. It would not be worthwhile to further refine the cost system into an ABC system if (1) a
single activity accounts for a sizable proportion of the department’s costs or (2) significant costs
are incurred on different activities within a department, but each activity has the same cost driver
or (3) there wasn’t much variation among contracts in the consumption of activities within a
department. If, for example, most activities within the design department were, in fact, driven by
CAD-design hours, then the more refined system would be more costly and no more accurate than
the department-based cost system. Even if there was sufficient variation, considering the relative
sizes of the three department cost pools, it may only be cost-effective to further analyze the
engineering cost pool, which consumes 78% ($240,000
$308,600) of the manufacturing
overhead.
5-20 (50 min.) Plantwide, department, and activity-cost rates.
Triumph Trophies makes trophies and plaques and operates at capacity. Triumph does large
custom orders, such as the participant trophies for the Minnetonka Little League. The controller
has asked you to compare plant-wide, department, and activity- based cost allocation.
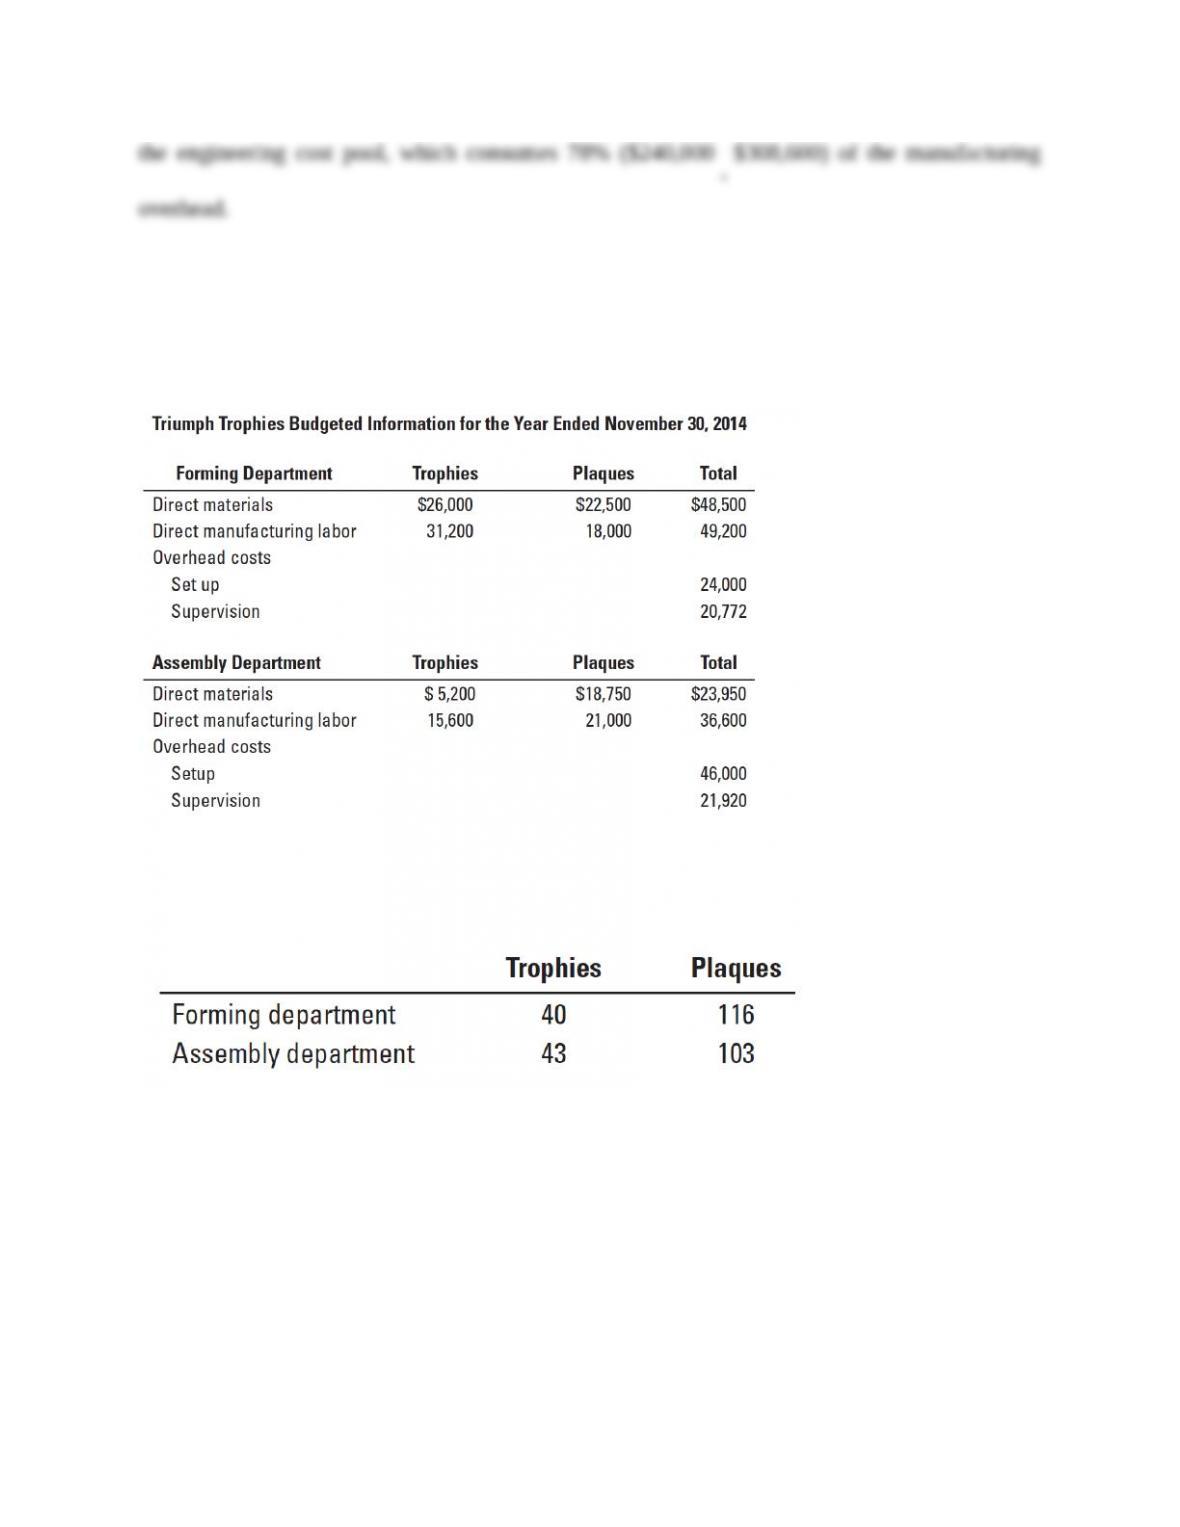
Forming
$26,000
$22,500
Assembly
5,200
18,750
Total
31,200
41,250
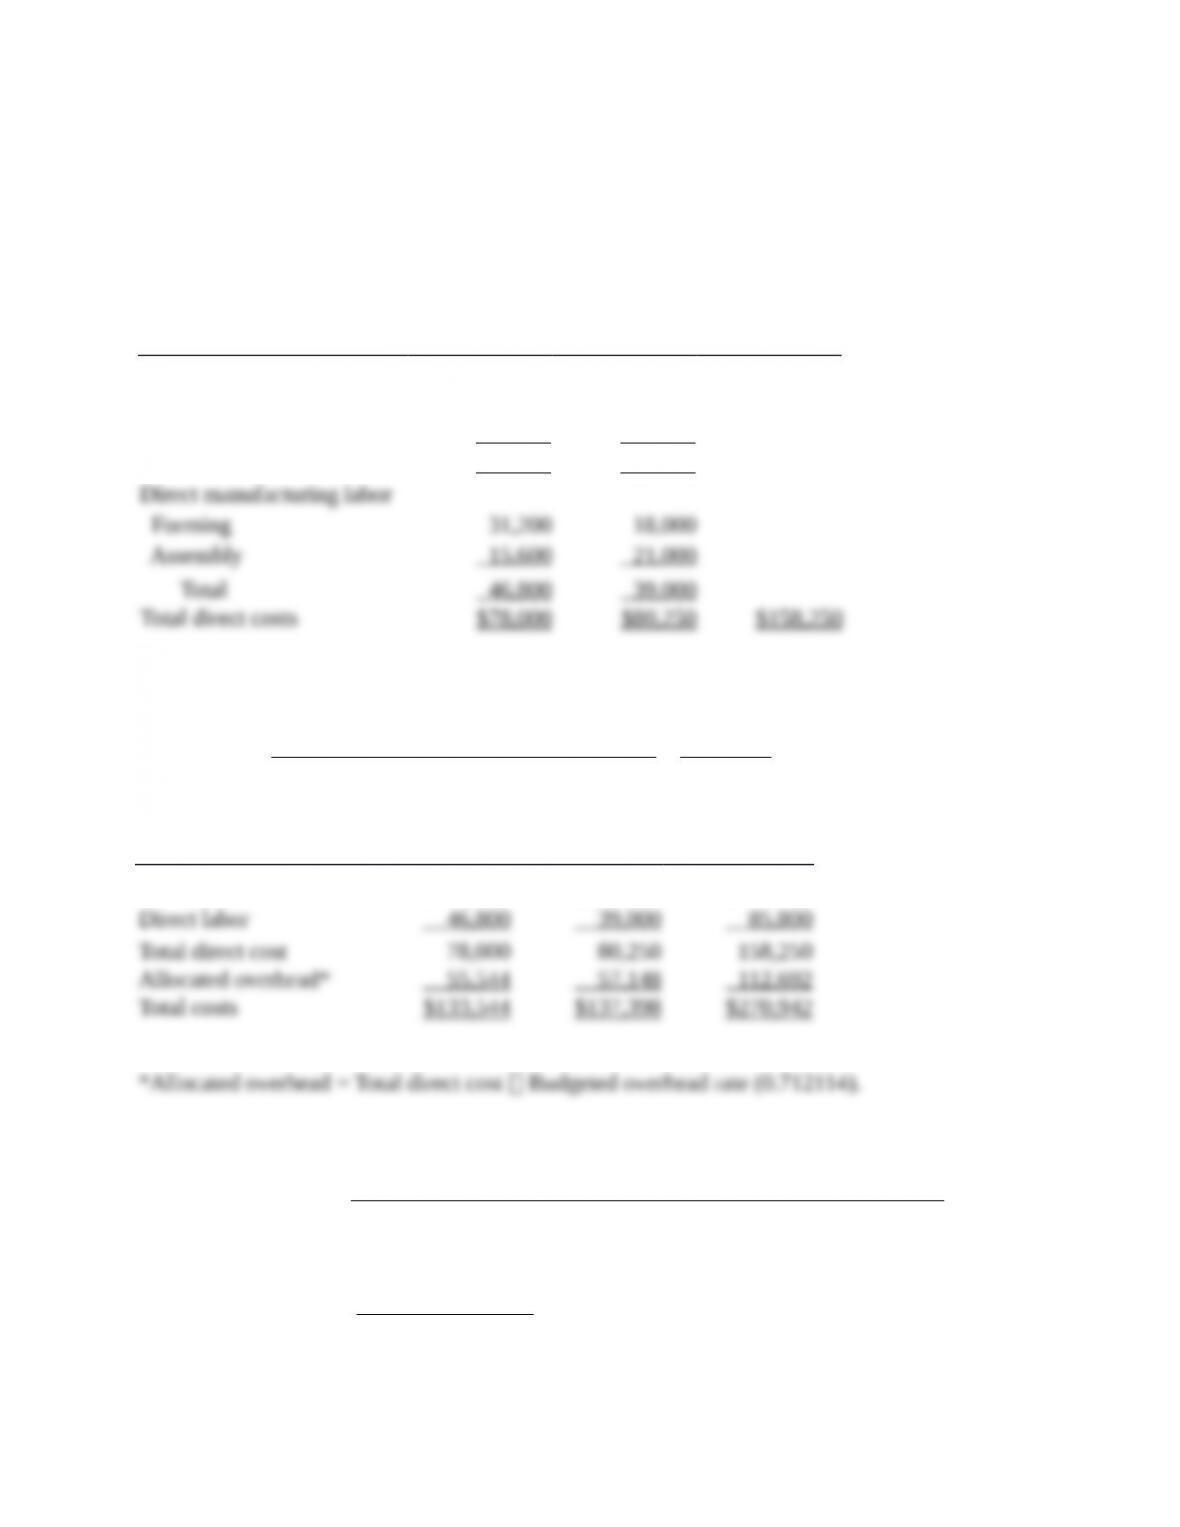
Direct manufacturing labor
Forming
31,200
18,000
Assembly
15,600
21,000
Total
46,800
39,000
Total direct costs
$78,000
$80,250
$158,250
Budgeted
overhead rate
=
($24,000 $20,772 $46,000 $21,920) $112,692
$158,250 $158,250
+++ =
=
$0.712114
per dollar of direct cost
Trophies
Plaques
Total
Direct materials
$ 31,200
$ 41,250
$ 72,450
Direct labor
46,800
39,000
85,800
Total direct cost
78,000
80,250
158,250
Allocated overhead*
55,544
57,148
112,692
Total costs
$133,544
$137,398
$270,942
*Allocated overhead = Total direct cost Budgeted overhead rate (0.712114).
2.
Budgeted
overhead rate
Forming Dept.
—
=
Budgeted Forming Department overhead costs
Budgeted Forming Department direct manufacturing labor costs
=
$24,000 $20,772
$31,200 $18,000
+
+
=
$44,772
$49,200 =
$0.91 per Forming Department direct manuf.-labor dollar
Budgeted
overhead rate
Assembly Dept.
—
=
Budgeted Assembly Department overhead costs
Budgeted Assembly Department direct costs
=
$46,000 $21,920
($5,200 $18,750 $15,600 $21,000)
+
+++
=
$67,920
$60,550 =
$1.121718 per Assembly Department direct cost dollar
Trophies
Plaques
Total
Direct materials
$ 31,200
$ 41,250
$ 72,450
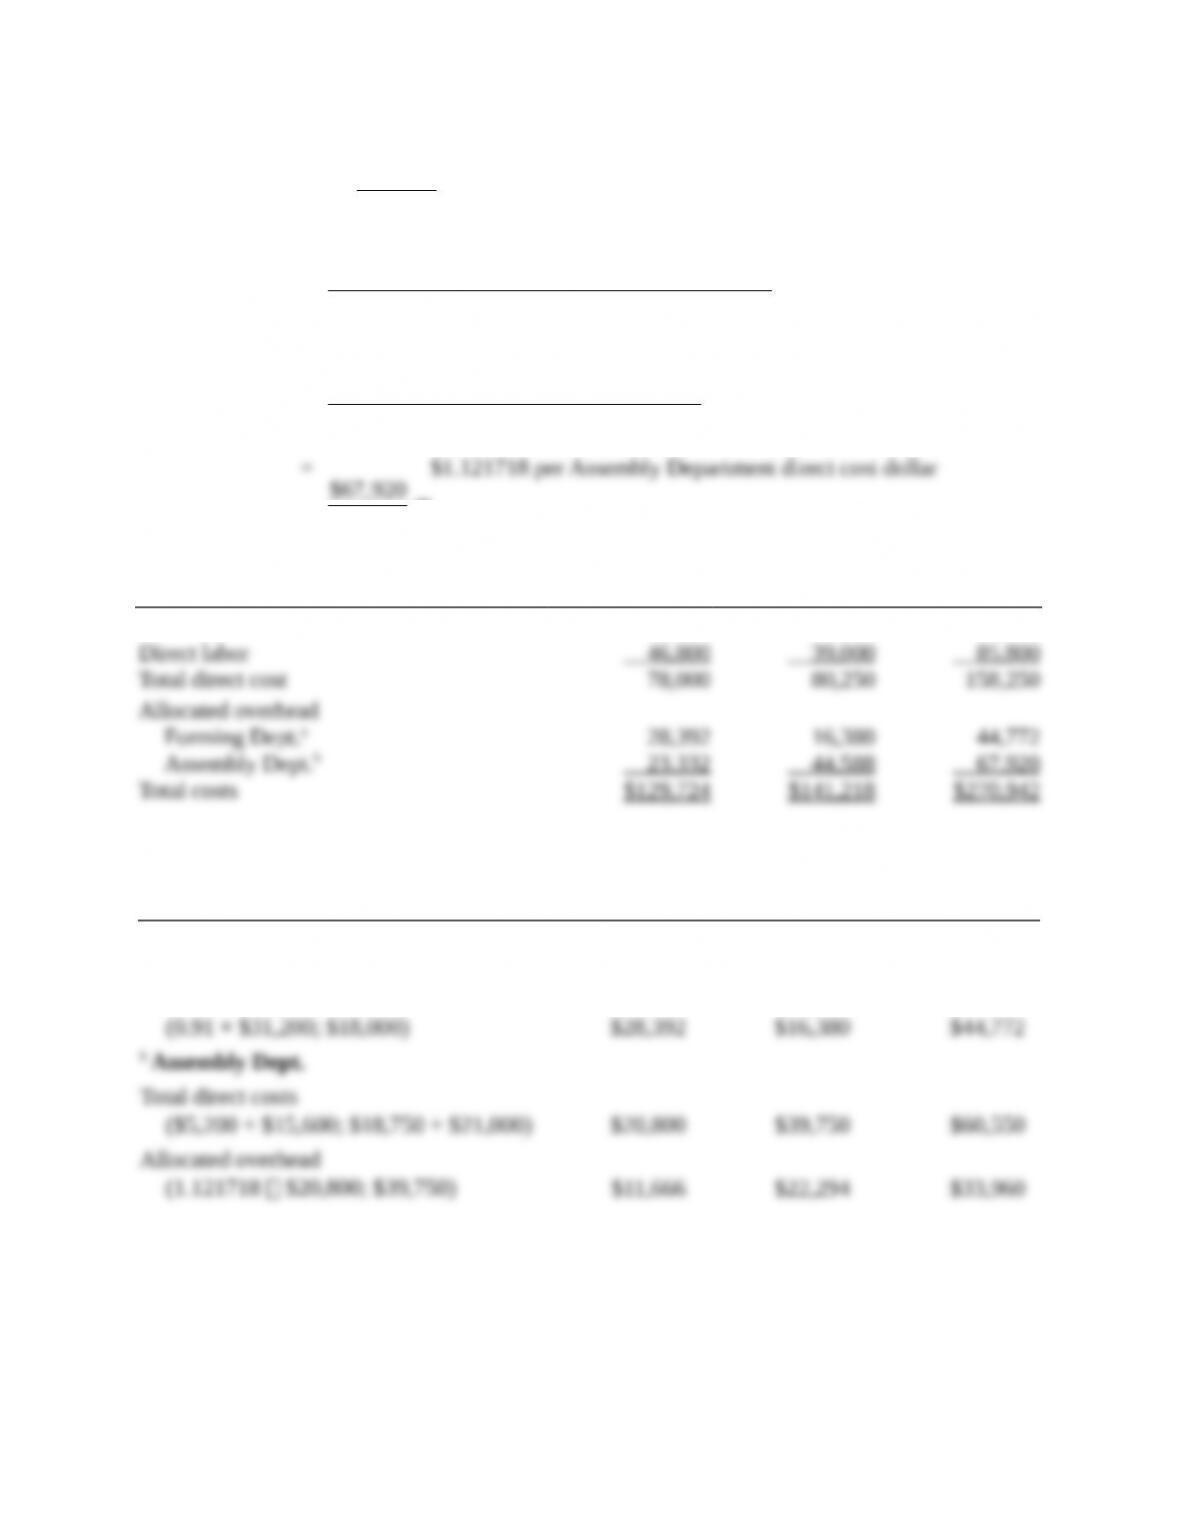
Direct labor
46,800
39,000
85,800
Total direct cost
78,000
80,250
158,250
Allocated overhead
Forming Dept.a
28,392
16,380
44,772
Assembly Dept.b
23,332
44,588
67,920
Total costs
$129,724
$141,218
$270,942
Trophies
Plaques
Total
a Forming Dept.
Direct manufacturing labor costs
$31,200
$18,000
$49,200
Allocated overhead
(0.91 × $31,200; $18,000)
$28,392
$16,380
$44,772
b Assembly Dept.
Total direct costs
($5,200 + $15,600; $18,750 + $21,000)
$20,800
$39,750
$60,550
Allocated overhead
(1.121718 $20,800; $39,750)
$11,666
$22,294
$33,960
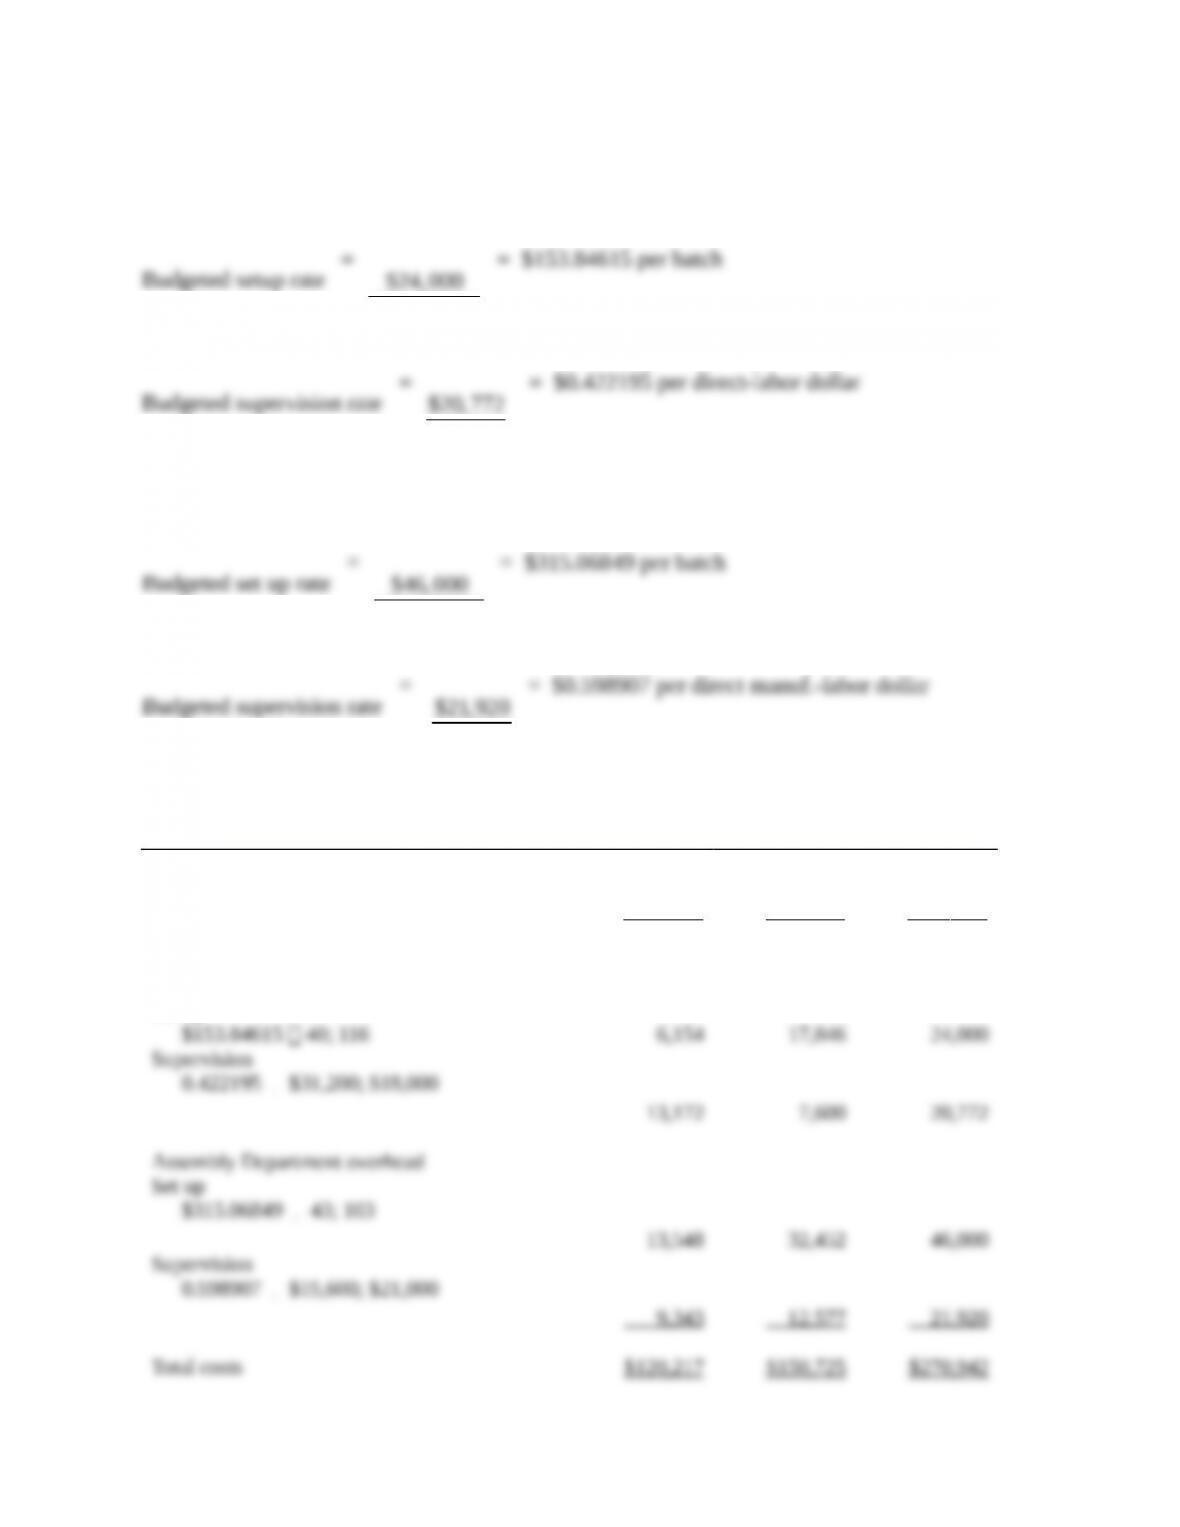
3.
Forming Department
Budgeted setup rate
=
$24,000
156 batches
= $153.84615 per batch
Budgeted supervision rate
=
$20,772
$49,200
= $0.422195 per direct-labor dollar
Assembly Department
Budgeted set up rate
=
$46,000
146 batches
= $315.06849 per batch
Budgeted supervision rate
=
$21,920
$36,600
= $0.598907 per direct manuf.-labor dollar
Trophies
Plaques
Total
Direct material costs
$ 31,200
$ 41,250
$ 72,450
Direct labor costs
46,800
39,000
85,800
Total direct costs
78,000
80,250
158,250
Forming Dept. overhead
Set up
$153.84615 40; 116
6,154
17,846
24,000
Supervision
0.422195
$31,200; $18,000
13,172
7,600
20,772
Assembly Department overhead
Set up
$315.06849
43; 103
13,548
32,452
46,000
Supervision
0.598907
$15,600; $21,000
9,343
12,577
21,920
Total costs
$120,217
$150,725
$270,942
4. As Triumph uses more refined cost pools, the costs of trophies decreases, and costs of
plaques increases. This is because plaques use a higher proportion of cost drivers (batches of
set ups and direct manufacturing labor costs) than trophies, whereas the direct costs (the
allocation base used in the simple costing system) are slightly smaller for plaques compared to
trophies. This results in plaques being undercosted and trophies overcosted in the simple
costing system.
Department costing systems increase the costs of plaques relative to trophies because
the forming department costs are allocated based on direct manufacturing labor costs in the
forming department and plaques use more direct manufacturing labor in this department
compared to trophies.
Disaggregated information can improve decisions by allowing managers to see the
details that help them understand how different aspects of cost influence total cost per unit.
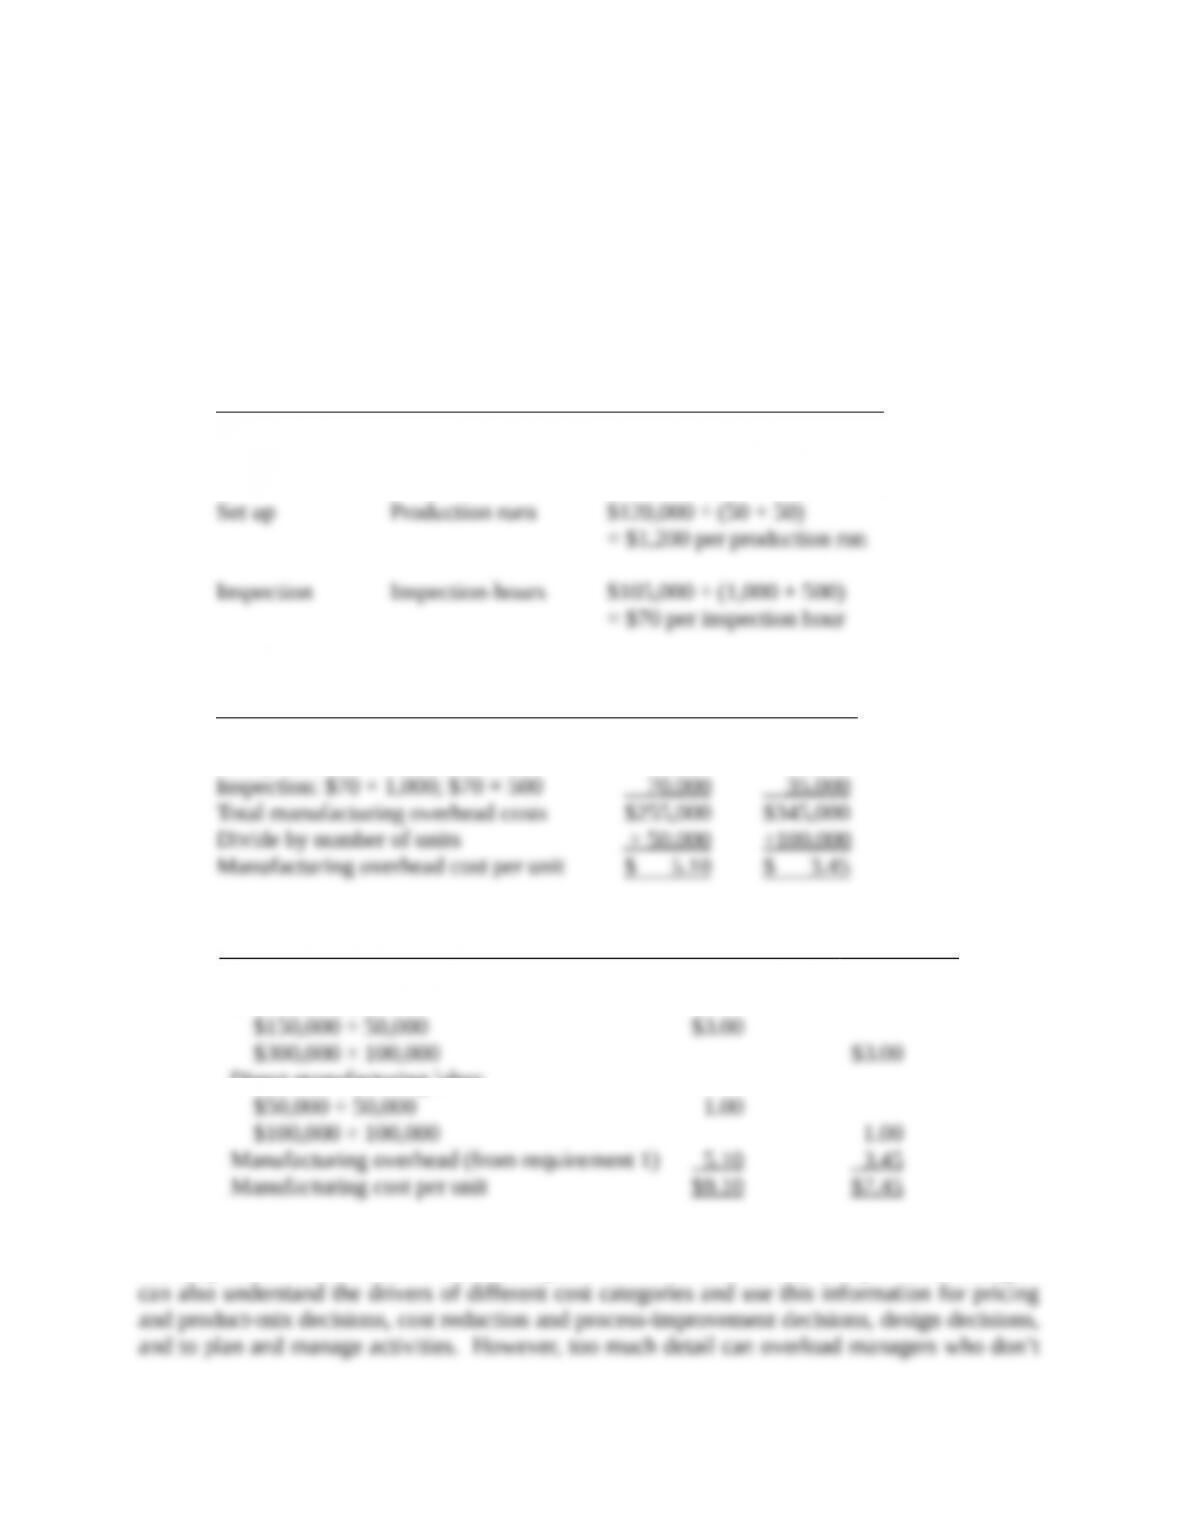
Managers can also understand the drivers of different cost categories and use this information
for pricing and product-mix decisions, cost reduction and process-improvement decisions,
design decisions, and to plan and manage activities. However, too much detail can overload
managers who don’t understand the data or what it means. Also, managers looking at per-unit
data may be misled when considering costs that aren’t unit-level costs.
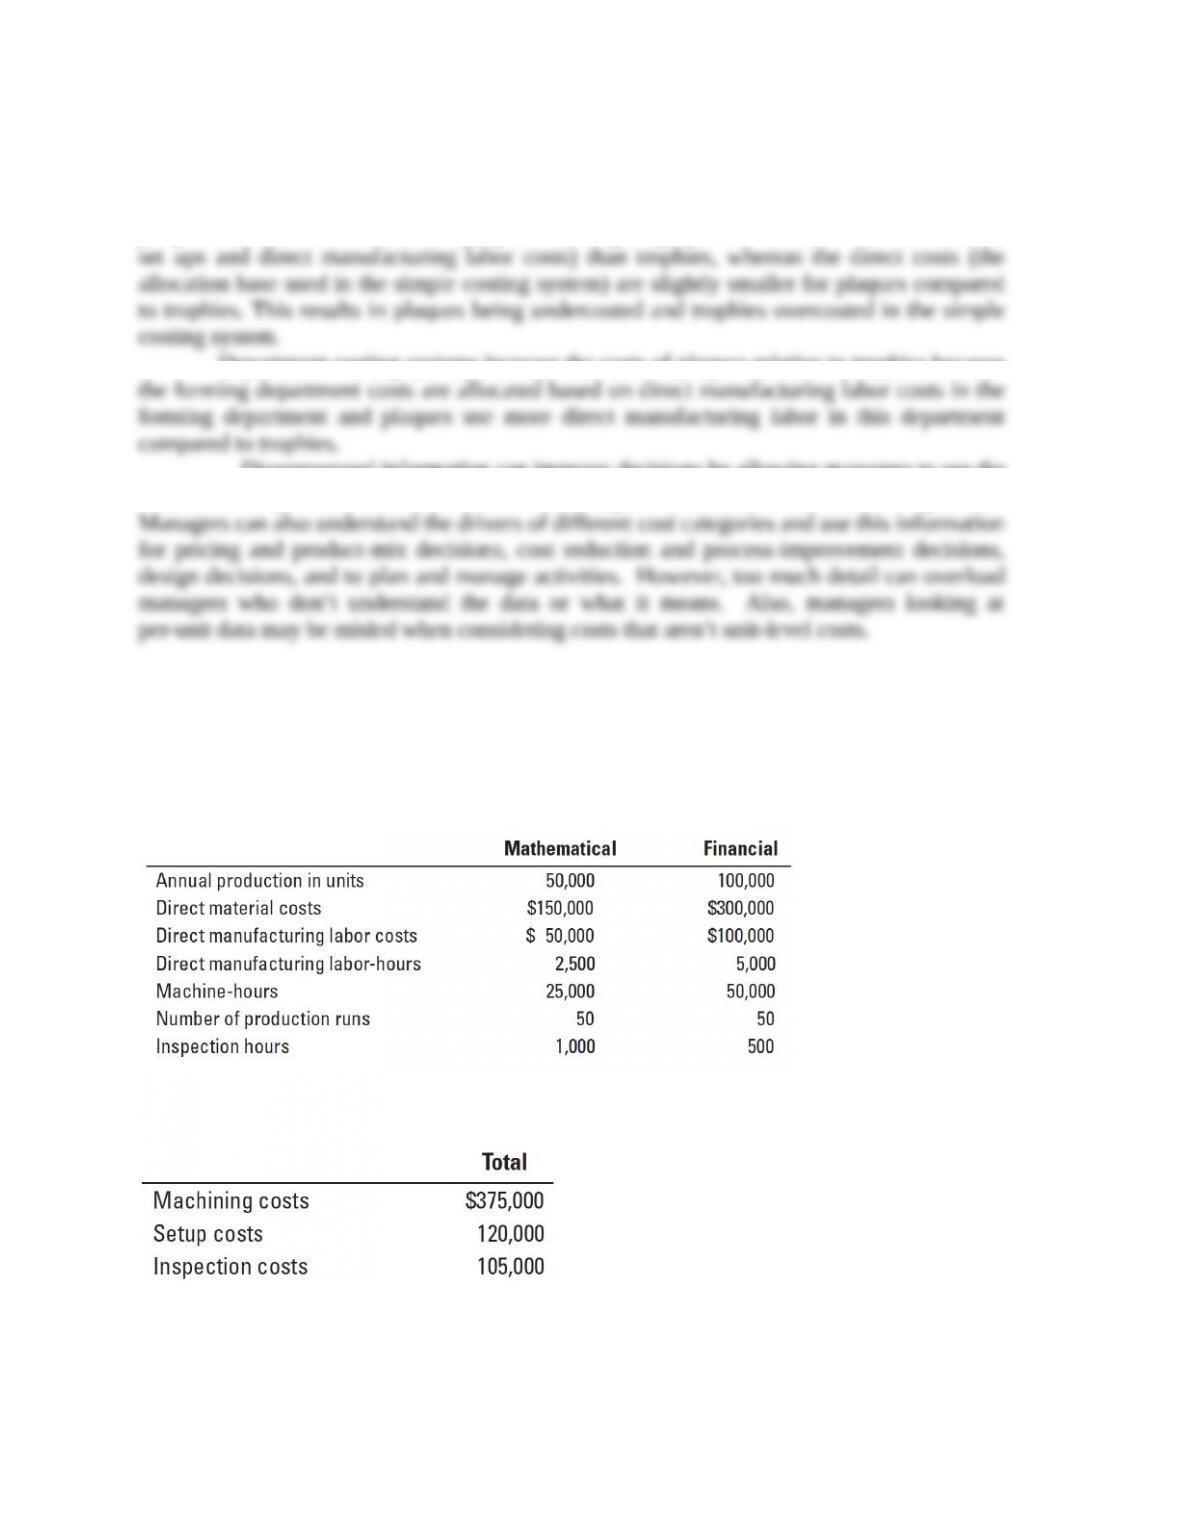
5-21 (10–15 min.) ABC, process costing.
Parker Company produces mathematical and financial calculators and operates at capacity. Data
related to the two products are presented here: