$2,250,000

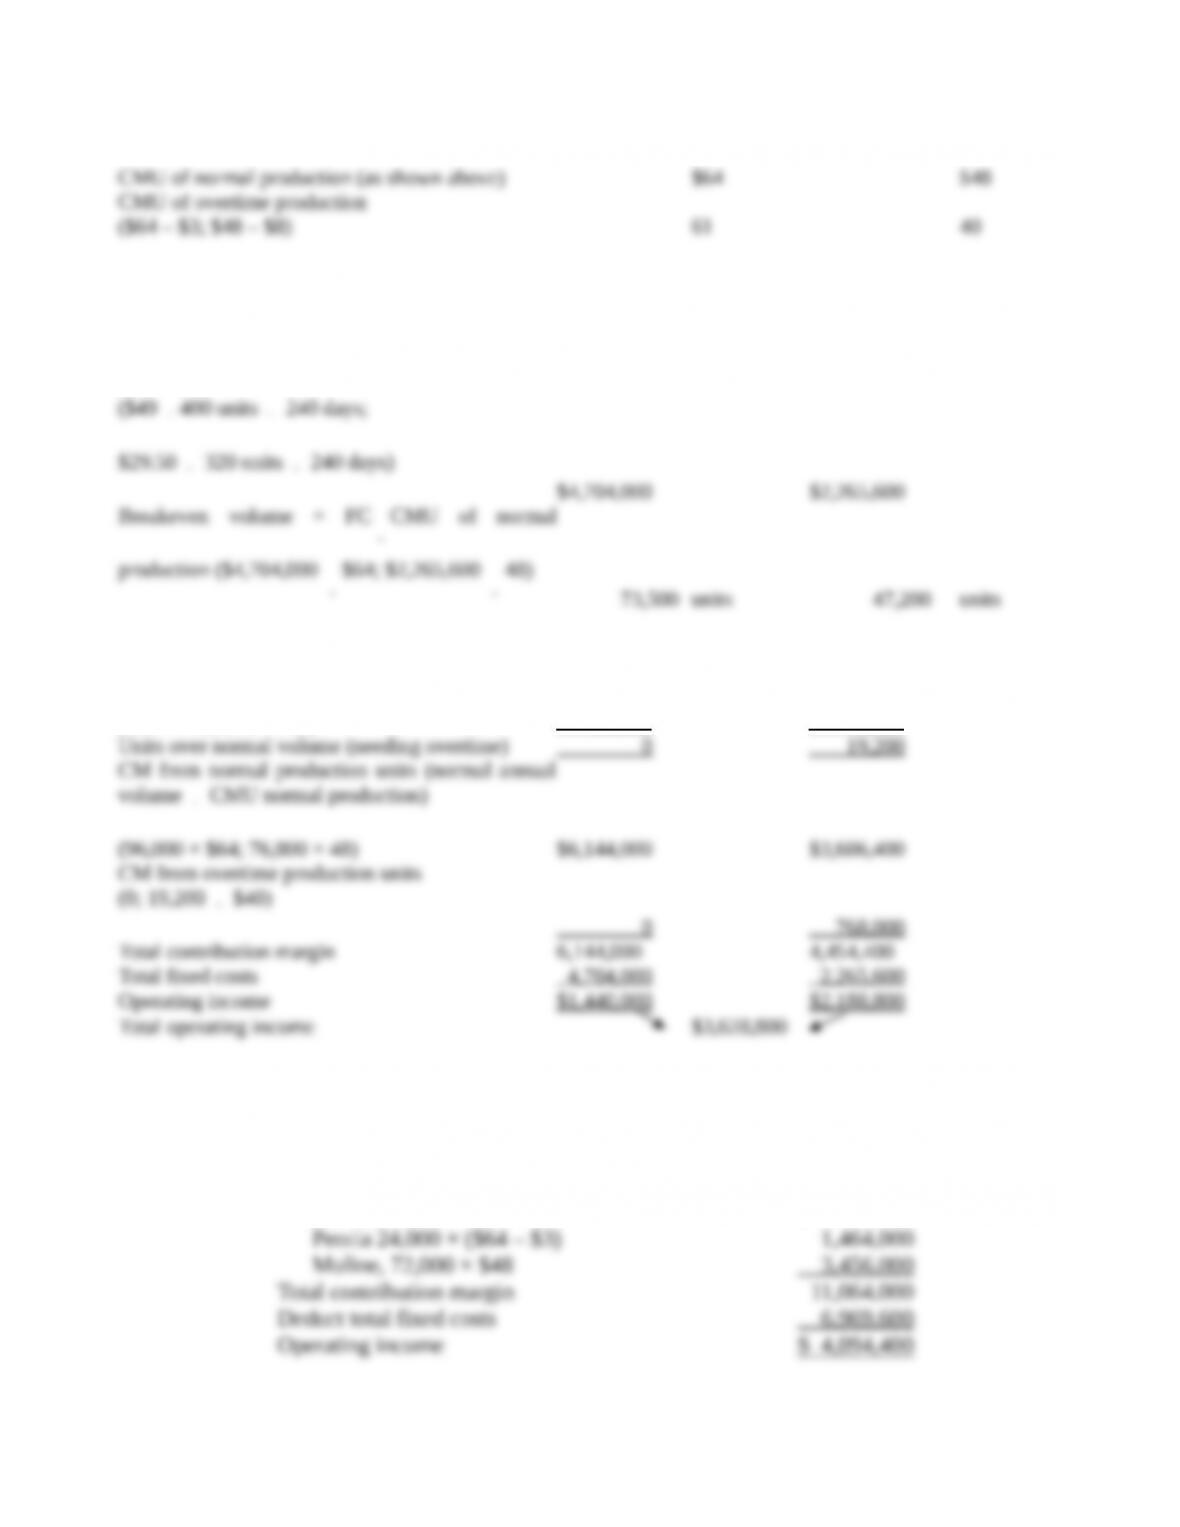
Operating income
$1,440,000
$2,188,800
Total operating income
$3,628,800
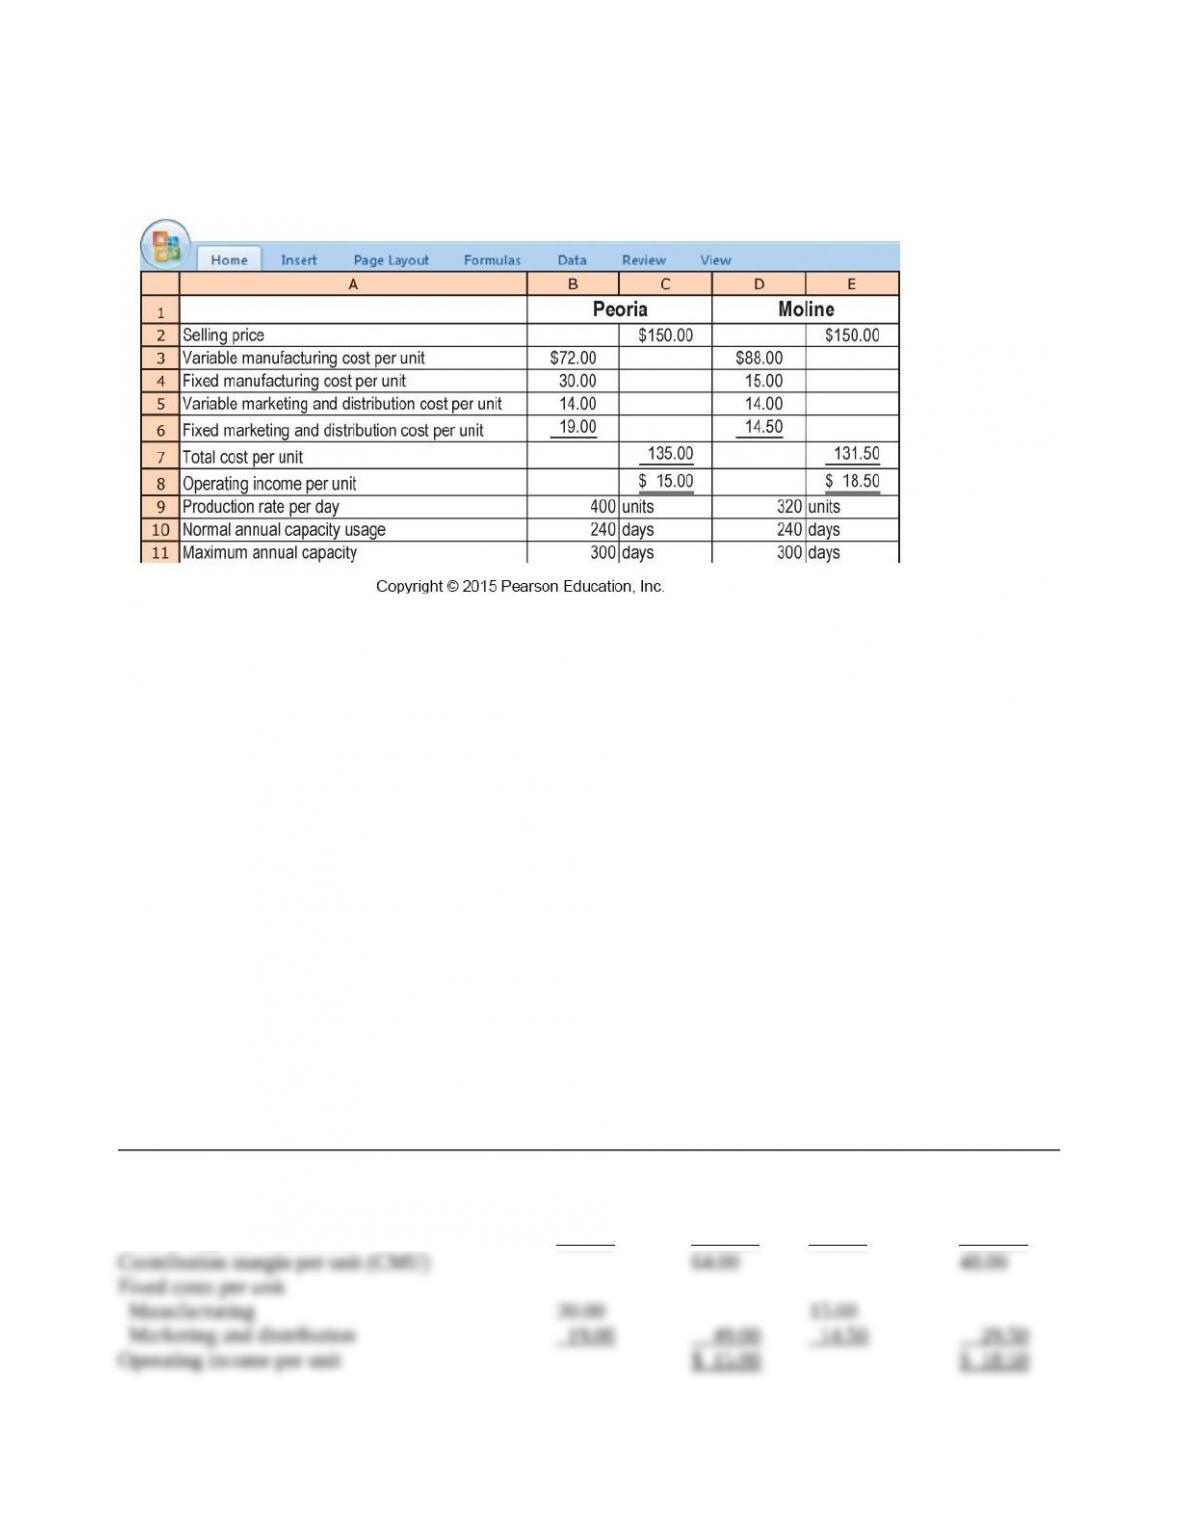
3. The optimal production plan is to produce 120,000 units at the Peoria plant and 72,000
units at the Moline plant. The full capacity of the Peoria plant, 120,000 units (400 units × 300
days), should be used because the contribution from these units is higher at all levels of production
than is the contribution from units produced at the Moline plant.
Contribution margin per plant:
Peoria, 96,000 × $64 $ 6,144,000
Peoria 24,000 × ($64 – $3) 1,464,000
Moline, 72,000 × $48 3,456,000
Total contribution margin 11,064,000
Deduct total fixed costs 6,969,600
Operating income $ 4,094,400
The contribution margin is higher when 120,000 units are produced at the Peoria plant and 72,000
units at the Moline plant. As a result, operating income will also be higher in this case because
total fixed costs for the division remain unchanged regardless of the quantity produced at each
plant.