3-
1
SOLUTION
1. Variable cost percentage is $3.80 $9.50 = 40%
Let R = Revenues needed to obtain target net income
R – 0.40R – $456,000 =
$159,600
1 0.30−
0.60R = $456,000 + $228,000
R = $684,000 0.60
R = $1,140,000
or,
Fixed costs + Target operating income
Target revenues Contribution margin percentage
=
Target net income $159,600
Fixed costs + $456,000
1 Tax rate 1 0.30
Target revenues $1,140,000
Contribution margin percentage 0.60
+
−−
= = =
Proof: Revenues $1,140,000
Variable costs (at 40%) 456,000
Contribution margin 684,000
Fixed costs 456,000
Operating income 228,000
Income taxes (at 30%) 68,400
Net income $ 159,600
2.a. Customers needed to break even:
Contribution margin per customer = $9.50 – $3.80 = $5.70
Breakeven number of customers = Fixed costs Contribution margin per customer
= $456,000 $5.70 per customer
= 80,000 customers
2.b. Customers needed to earn net income of $159,600:
Total revenues Sales check per customer
$1,140,000 $9.50 = 120,000 customers
3. Using the shortcut approach:
Change in net income =
( )
Change in Unit
number of contribution 1 Tax rate
customers margin
−
= (145,000 – 120,000) $5.70 (1 – 0.30)
= $142,500 0.7 = $99,750
New net income = $99,750 + $159,600 = $259,350
Alternatively, with 145,000 customers,
3-
2
Operating income = Number of customers Selling price per customer
– Number of customers Variable cost per customer – Fixed costs
= 145,000 $9.50 – 145,000 $3.80 – $456,000 = $370,500
Net income = Operating income × (1 – Tax rate) = $370,500 × 0.70 = $259,350
The alternative approach is:
Revenues, 145,000 $9.50 $1,377,500
Variable costs at 40% 551,000
Contribution margin 826,500
Fixed costs 456,000
Operating income 370,500
Income tax at 30% 111,150
Net income $ 259,350
3-23 CVP analysis, sensitivity analysis.
Tuff Kids Jeans Co. sells blue jeans wholesale to major retailers across the country. Each pair of
jeans has a selling price of $30 with $21 in variable costs of goods sold. The company has fixed
manufacturing costs of $1,200,000 and fixed marketing costs of $300,000. Sales commissions are
paid to the wholesale sales reps at 5% of revenues. The company has an income tax rate of 25%.
Required:
1. How many jeans must Tuff Kids sell in order to break even?
2. How many jeans must the company sell in order to reach:
a. a target operating income of $450,000?
b. a net income of $450,000?
3. How many jeans would TuffKids have to sell to earn the net income in part 2b if (consider
each require-ment independently).
a. The contribution margin per unit increases by 10%
b. The selling price is increased to $32.50
c. The company outsources manufacturing to an overseas company increasing variable costs
per unit by $2.00 and saving 60% of fixed manufacturing costs.
SOLUTION
1. CMU = $30−$21−(0.05 × $30) = $7.50
Q =
CMU
FC
=
$1,500,000
$7.50 per pair
= 200,000 pairs
Note: No income taxes are paid at the breakeven point because operating income is $0.
3-
3
2a. Q =
CMU
TOI FC +
=
$1,500,000 $450,000
$7.50 per pair
+
=
$1,950,000
$7.50 per pair
= 260,000 pairs
2b. Target operating income =
Target net income $450,000 $450,000
1 tax rate (1 0.25) 0.75
===
−−
$600,000
Quantity of output units
required to be sold
=
Fixed costs + Target operating income $1,500,000 $600,000
Contribution margin per unit $7.50
+
=
= 280,000 pairs
3a. Contribution margin per unit increases by 10%
Contribution margin per unit = $7.50 × 1.10 = $8.25
Quantity of output units
required to be sold
=
Fixed costs + Target operating income $1,500,000 $600,000
Contribution margin per unit $8.25
+
=
= 254,545 pairs (rounded)
The net income target in units decreases from 280,000 pairs in requirement 2b to 254,545 pairs.
3b. Increasing the selling price to $32.50
Contribution margin per unit = $32.50 − $21 − (0.05 × $32.50) = $9.875
Quantity of output units
required to be sold
=
Fixed costs + Target operating income $1,500,000 $600,000
Contribution margin per unit $9.875
+
=
= 212,658 pairs (rounded)
The net income target in units decreases from 280,000 pairs in requirement 2b to 212,658 pairs.
3c. Increase variable costs by $2.50 per unit and decrease fixed manufacturing costs by 50%.
Contribution margin per unit = $30 – $23 ($21 + $2) – (0.05 × $30) = $5.50
Fixed manufacturing costs = (1 – 0.6) × $1,200,000 = $480,000
Fixed marketing costs = $300,000
Total fixed costs = $480,000 + $300,000 = $780,000
Quantity of output units
required to be sold
=
Fixed costs + Target operating income $780,000 $600,000
Contribution margin per unit $5.50
+
=
= 250,909 pairs (rounded)
3-
4
The net income target in units decreases from 280,000 pairs in requirement 2b to 250,909 pairs.
3-24 (10 min.) CVP analysis, margin of safety.
Suppose Lattin Corp.’s breakeven point is revenues of $1,500,000. Fixed costs are $720,000.
Required:
1. Compute the contribution margin percentage.
2. Compute the selling price if variable costs are $13 per unit.
3. Suppose 90,000 units are sold. Compute the margin of safety in units and dollars.
4. What does this tell you about the risk of Lattin making a loss? What are the most likely reasons
for this risk to increase?
SOLUTION
1. Breakeven point revenues =
percentagemargin on Contributi
costs Fixed
Contribution margin percentage =
$720,000
$1,500,000
= 0.48 or 48%
2. Contribution margin percentage =
price Selling
unit per cost Variable price Selling −
0.48 =
SP $13
SP
−
0.48 SP = SP – $13
0.52 SP = $13
SP = $25
3. Breakeven sales in units = Revenues ÷ Selling price = $1,500,000 ÷ $25 = 60,000 units
Margin of safety in units = Sales in units – Breakeven sales in units
= 90,000 – 60,000 = 30,000 units
Revenues, 90,000 units $25 $2,250,000
Breakeven revenues 1,500,000
Margin of safety $ 750,000
3. The risk of making a loss is low. Sales would need to decrease by 30,000 units ÷ 90,000 units
= 33.33% before Lattin Corp. will make a loss. The most likely reasons for this risk to increase
competition, weakness in the economy, or bad management.
3-25 (25 min.) Operating leverage.
Carmel Rugs is holding a 2-week carpet sale at Jean’s Club, a local warehouse store. Carmel Rugs
plans to sell carpets for $1,000 each. The company will purchase the carpets from a local distributor
for $400 each, with the privilege of returning any unsold units for a full refund. Jean’s Club has
offered Carmel Rugs two payment alternatives for the use of space.
▪ Option 1: A fixed payment of $17,400 for the sale period
3-
5
▪ Option 2: 20% of total revenues earned during the sale period
Assume Carmel Rugs will incur no other costs.
Required:
1. Calculate the breakeven point in units for (a) option 1 and (b) option 2.
2. At what level of revenues will Carmel Rugs earn the same operating income under either
option?
a. For what range of unit sales will Carmel Rugs prefer option 1?
b. For what range of unit sales will Carmel Rugs prefer option 2?
3. Calculate the degree of operating leverage at sales of 87 units for the two rental options.
4. Briefly explain and interpret your answer to requirement 3.
SOLUTION
1a. Let Q denote the quantity of carpets sold
Breakeven point under Option 1
$1,000Q − $400Q = $17,400
$600Q = $17,400
Q = $17,400 $600 = 29 carpets
1b. Breakeven point under Option 2
$1,000Q − $400Q − (0.20 $1,000Q) = 0
400Q = 0
Q = 0
2. Operating income under Option 1 = $600Q − $17,400
Operating income under Option 2 = $400Q
Find Q such that $600Q − $17,400 = $400Q
$200Q = $17,400
Q = $17,400 $200 = 87 carpets
Revenues = $1,000 × 87 carpets = $87,000
For Q = 87 carpets, operating income under both Option 1 ($600 × 87 – $17,400) and
Option 2 ($400 × 87) = $34,800
For Q > 87, say, 88 carpets,
Option 1 gives operating income = ($600 88) − $17,400 = $35,400
Option 2 gives operating income = $400 88 = $35,200
So Color Rugs will prefer Option 1.
For Q < 87, say, 86 carpets,
Option 1 gives operating income = ($600 86) − $17,000 = $34,200
Option 2 gives operating income = $400 86 = $34,400
So Color Rugs will prefer Option 2.
3-
6
3. Degree of operating leverage =
Contribution margin
Operating income
Contribution margin per unit Quantity of carpets sold
Operating income
=
Under Option 1, contribution margin per unit = $1,000 – $400 = $600, so
Degree of operating leverage =
$600 87
$34,800
= 1.5
Under Option 2, contribution margin per unit = $1,000 – $400 – 0.20 $1,000 = $400, so
Degree of operating leverage =
$400 87
$34,800
= 1.0
5.The calculations in requirement 3 indicate that when sales are 87 units, a percentage change
in sales and contribution margin will result in 1.5 times that percentage change in operating
income for Option 1, but the same percentage change in operating income for Option 2
(because there are no fixed costs in Option 2). The degree of operating leverage at a given
level of sales helps managers calculate the effect of fluctuations in sales on operating
incomes.
3-26 (15 min.) CVP analysis, international cost structure differences.
Plush Decor, Inc., is considering three possible countries for the sole manufacturing site of its
newest area rug: Italy, Spain, and Singapore. All area rugs are to be sold to retail outlets in the
United States for $200 per unit. These retail outlets add their own markup when selling to final
customers. Fixed costs and variable cost per unit (area rug) differ in the three countries.
Country
Sales Price
to Retail
Outlets
Annual
Fixed
Costs
Variable
Manufacturing
Cost per
Area Rug
Variable
Marketing &
Distribution Cost
per Area Rug
Italy
$200.00
$6,386,000
$70.00
$27.00
Spain
200.00
5,043,000
61.00
16.00
Singapore
200.00
12,240,00
84.00
14.00
Required:
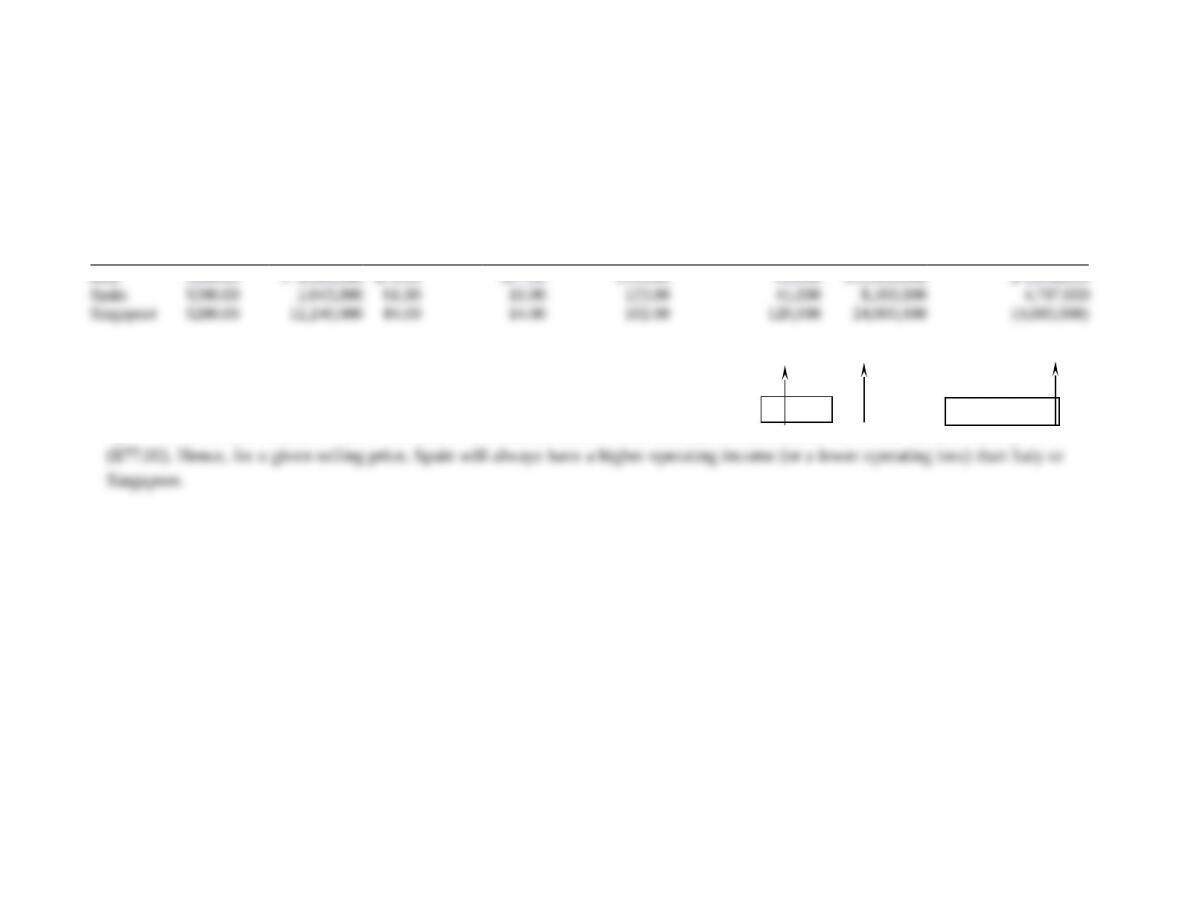
1. Compute the breakeven point for Plush Decor, Inc., in each country in (a) units sold and (b)
revenues.
2. If Plush Decor, Inc., plans to produce and sell 80,000 rugs in 2014, what is the budgeted
operating in-come for each of the three manufacturing locations? Comment on the results.
SOLUTION
Variable
Variable
Sales Price
Annual
Manufacturing
Marketing and
Contribution
Operating Income
to Retail
Fixed
Cost per
Distribution Cost
Margin
Breakeven
Breakeven
for Budgeted Sales
Country
Outlets
Costs
Rug
per Rug
Per Rug
Units
Revenues
of 80,000 Rugs
(1)
(2)
(3)
(4)
(5) = (1) – (3)
– (4)
(6) = (2)
(5)
(6)
(1)
(7) = [80,000
(5)]–(2)
Italy
$200.00
$ 6,386,000
$70.00
$27.00
$103.00
62,000
$12,400,000
$ 1,854,000
Spain
$200.00
5,043,000
61.00
16.00
123.00
41,000
8,200,000
4,797,000
Singapore
$200.00
12,240,000
84.00
14.00
102.00
120,000
24,000,000
(4,080,000)
Spain has the lowest breakeven point because it has both the lowest fixed costs ($5,043,000) and the lowest variable cost per unit
($77.00). Hence, for a given selling price, Spain will always have a higher operating income (or a lower operating loss) than Italy or
Singapore.
The Singapore breakeven point is 120,000 units. Hence, with sales of only 80,000 units, it has an operating loss of $4,080,000.
Requirement 1
Requirement 2
3-27 (30 min.) Sales mix, new and upgrade customers.
Chartz 1-2-3 is a top-selling electronic spreadsheet product. Chartz is about to release version 5.0.
It divides its customers into two groups: new customers and upgrade customers (those who
previously purchased Chartz 1-2-3 4.0 or earlier versions). Although the same physical product is
provided to each customer group, sizable differences exist in selling prices and variable marketing
costs:
New Customers Upgrade Customers______
Selling price $195 $115
Variable costs
Manufacturing $15 $15
Marketing 50 65 20 35
Contribution margin $130 $ 80
The fixed costs of Chartz 1-2-3 5.0 are $16,500,000. The planned sales mix in units is 60% new
customers and 40% upgrade customers.
Required:
1. What is the Chartz 1-2-3 5.0 breakeven point in units, assuming that the planned 60%>40%
sales mix is attained?
2. If the sales mix is attained, what is the operating income when 170,000 total units are sold?
3. Show how the breakeven point in units changes with the following customer mixes:
a. New 40% and upgrade 60%
b. New 80% and upgrade 20%
c. Comment on the results.
SOLUTION
1.
New
Customers
Upgrade
Customers
SP
VCU
CMU
$195
65
130
$115
35
80
The 60%/40% sales mix implies that, in each bundle, 3 units are sold to new customers and 2 units
are sold to upgrade customers.
Contribution margin of the bundle = 3 $130 + 2 $80 = $390 + $160 = $550
Breakeven point in bundles =
$16,500,000
$550
= 30,000 bundles
Breakeven point in units is:
Sales to new customers:
30,000 bundles 3 units per bundle
90,000 units
Sales to upgrade customers:
30,000 bundles 2 units per bundle
60,000 units
3-
9
Total number of units to breakeven (rounded)
150,000 units
Alternatively,
Let S = Number of units sold to upgrade customers
1.5S = Number of units sold to new customers
Revenues – Variable costs – Fixed costs = Operating income
[$195 (1.5S) + $115S] – [$65 (1.5S) + $35S] – $16,500,000 = OI
$407.5S – $132.5S – $16,500,000 = OI
Breakeven point is 150,000 units when OI = $0 because
$275S = $16,500,000
S = 60,000 units sold to upgrade customers
1.5S = 90,000 units sold to new customers
BEP = 150,000 units
Check
Revenues ($195 90,000) + ($115 60,000) $24,450,000
Variable costs ($65 90,000) + ($35 60,000) 7,950,000
Contribution margin 16,500,000
Fixed costs 16,500,000
Operating income $ 0
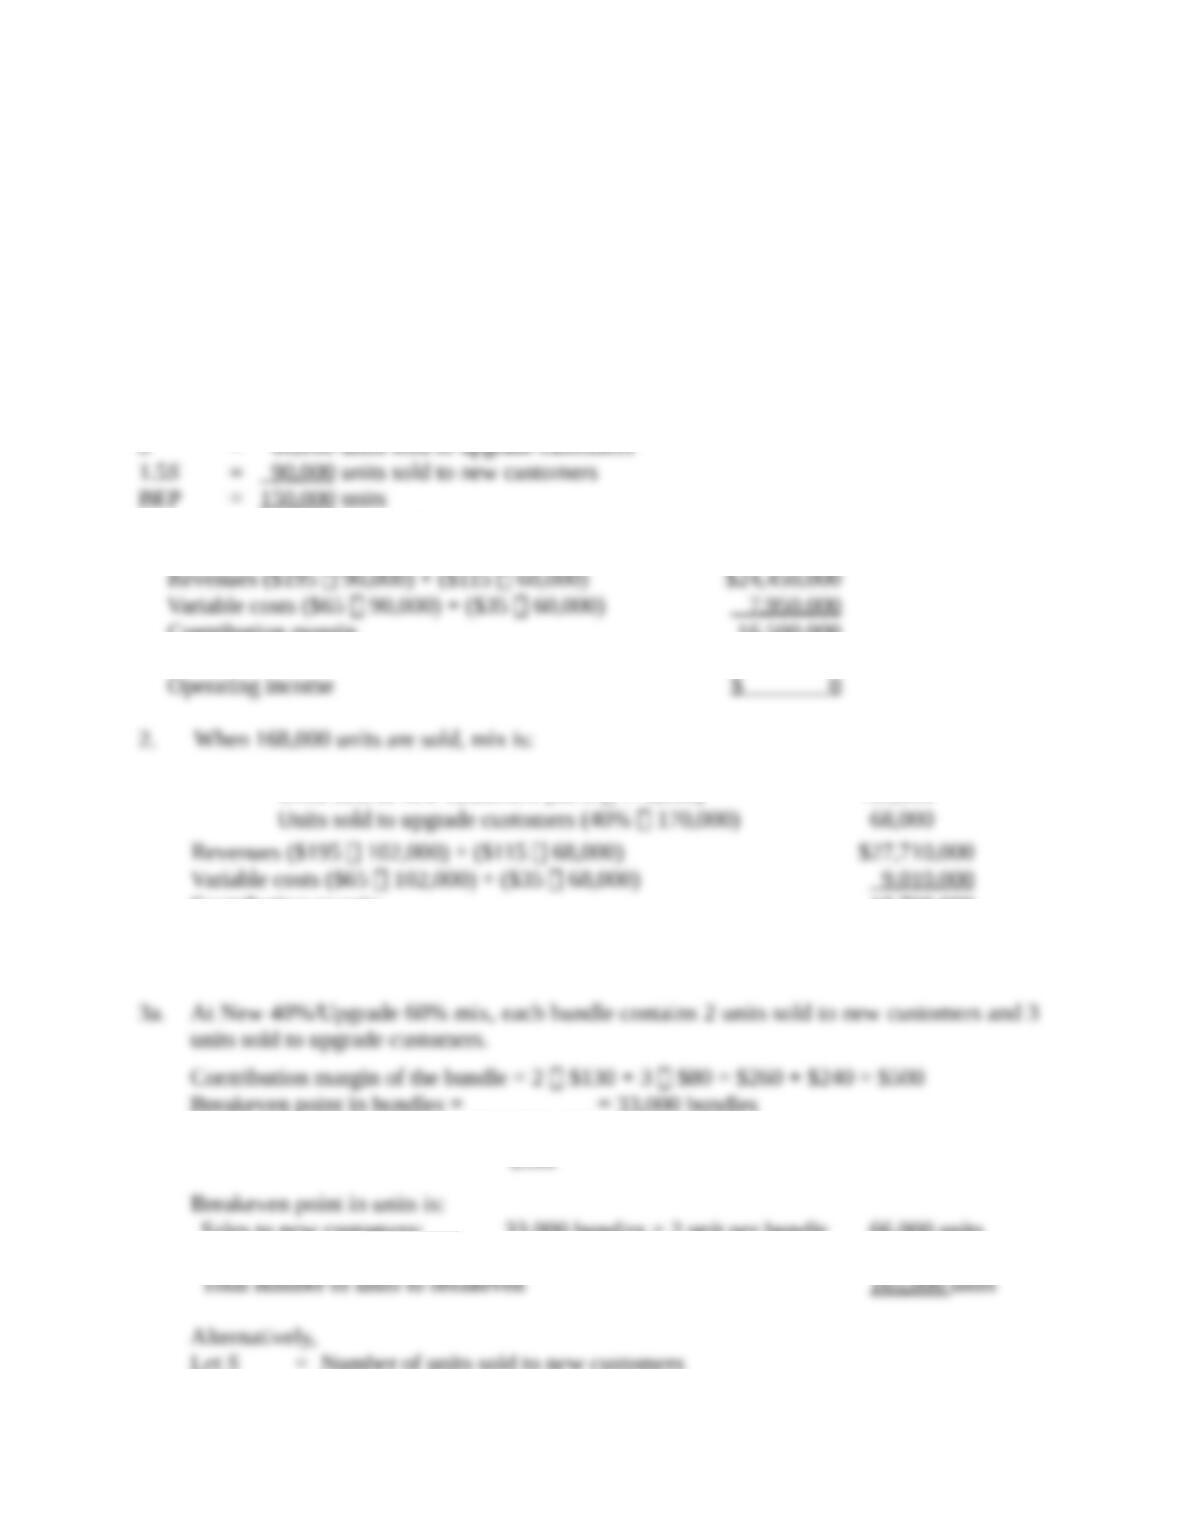
2. When 168,000 units are sold, mix is:
Units sold to new customers (60% 170,000) 102,000
Units sold to upgrade customers (40% 170,000) 68,000
Revenues ($195 102,000) + ($115 68,000) $27,710,000
Variable costs ($65 102,000) + ($35 68,000) 9,010,000
Contribution margin 18,700,000
Fixed costs 16,500,000
Operating income $ 2,200,000
3a. At New 40%/Upgrade 60% mix, each bundle contains 2 units sold to new customers and 3
units sold to upgrade customers.
Contribution margin of the bundle = 2 $130 + 3 $80 = $260 + $240 = $500
Breakeven point in bundles =
$16,500,000
$500
= 33,000 bundles
Breakeven point in units is:
Sales to new customers:
33,000 bundles × 2 unit per bundle
66,000 units
Sales to upgrade customers:
33,000 bundles × 3 unit per bundle
99,000 units
Total number of units to breakeven
165,000 units
Alternatively,
Let S = Number of units sold to new customers
then 1.5S = Number of units sold to upgrade customers
3-
10
[$195S + $115 (1.5S)] – [$65S + $35 (1.5S)] – $16,500,000 = OI
367.5S – 117.5S = $16,500,000
250S = $16,500,000
S = 66,000 units sold to new customers
1.5S = 99,000 units sold to upgrade customers
BEP = 165,000 units
Check
Revenues ($195 66,000) + ($115 99,000) $24,255,000
Variable costs ($65 66,000) + ($35 99,000) 7,755,000
Contribution margin 16,500,000
Fixed costs 16,500,000
Operating income $ 0
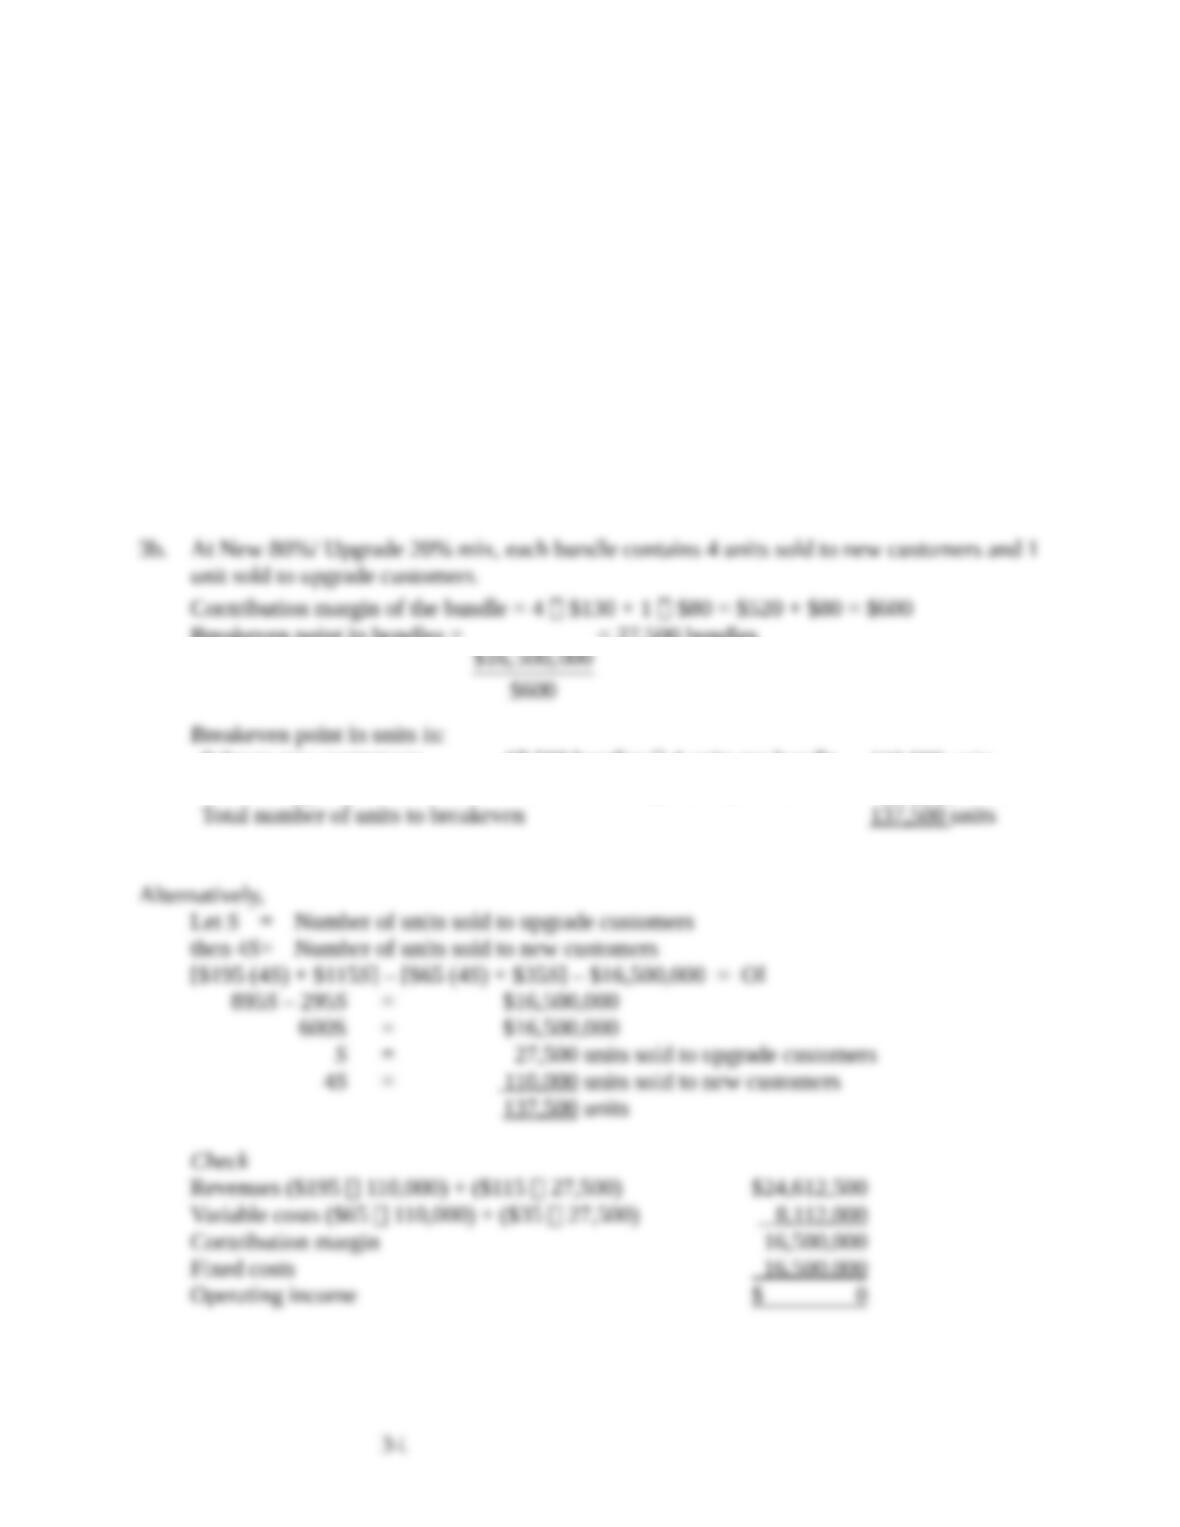
3b. At New 80%/ Upgrade 20% mix, each bundle contains 4 units sold to new customers and 1
unit sold to upgrade customers.
Contribution margin of the bundle = 4 $130 + 1 $80 = $520 + $80 = $600
Breakeven point in bundles =
$16,500,000
$600
= 27,500 bundles
Breakeven point in units is:
Sales to new customers:
27,500 bundles 4 units per bundle
110,000 units
Sales to upgrade customers:
27,500 bundles 1 unit per bundle
27,500 units
Total number of units to breakeven
137,500 units
Alternatively,
Let S = Number of units sold to upgrade customers
then 4S = Number of units sold to new customers
[$195 (4S) + $115S] – [$65 (4S) + $35S] – $16,500,000 = OI
895S – 295S = $16,500,000
600S = $16,500,000
S = 27,500 units sold to upgrade customers
4S = 110,000 units sold to new customers
137,500 units
Check
Revenues ($195 110,000) + ($115 27,500) $24,612,500
Variable costs ($65 110,000) + ($35 27,500) 8,112,000
Contribution margin 16,500,000
Fixed costs 16,500,000
Operating income $ 0
3-
11
3c. As Chartz increases its percentage of new customers, which have a higher contribution
margin per unit than upgrade customers, the number of units required to break even decreases:
New
Customers
Upgrade
Customers
Breakeven
Point
Requirement 3(a)
Requirement 1
Requirement 3(b)
40%
60
80
60%
40
20
165,000
150,000
137,500
3-28 (15–25 min.) Sales mix, three products.
The Janowski Company has three product lines of mugs—A, B, and C— with contribution margins
of $5, $4, and $3, respectively. The president foresees sales of 168,000 units in the coming period,
consisting of 24,000 units of A, 96,000 units of B, and 48,000 units of C. The company’s fixed
costs for the period are $405,000.
Required:
1. What is the company’s breakeven point in units, assuming that the given sales mix is
maintained?
2. If the sales mix is maintained, what is the total contribution margin when 168,000 units are
sold? What is the operating income?
3. What would operating income be if the company sold 24,000 units of A, 48,000 units of B,
and 96,000 units of C? What is the new breakeven point in units if these relationships persist
in the next period?
4. Comparing the breakeven points in requirements 1 and 3, is it always better for a company to
choose the sales mix that yields the lower breakeven point? Explain.