Unlock document.
This document is partially blurred.
Unlock all pages and 1 million more documents.
Get Access
23-
1
CHAPTER 23
PERFORMANCE MEASUREMENT, COMPENSATION, AND
MULTINATIONAL CONSIDERATIONS
23-1 Examples of financial and nonfinancial measures of performance are
Financial: ROI, residual income, economic value added, and return on sales
Nonfinancial: Customer perspective: Market share, customer satisfaction
Internal-business-processes perspective: Manufacturing lead time, yield,
on-time performance, number of new product launches, and number of
new patents filed
Learning-and-growth perspective: employee satisfaction, information-
system availability
23-2 The three steps in designing an accounting-based performance measure are as follows:
1. Choose performance measures that align with top management’s financial goals.
2. Choose the details of each performance measure in Step 1, including the time horizon and
measurement of various aspects of the measure.
3. Choose a target level of performance and feedback mechanism for each performance
measure in Step 1.
23-3 The DuPont method highlights that ROI is increased by any action that increases return on
sales or investment turnover. ROI increases with
1. increases in revenues,
2. decreases in costs, or
3. decreases in investments,
while holding the other two factors constant.
23-4 Yes. Residual income (RI) is not identical to return on investment (ROI). ROI is a
percentage with investment as the denominator of the computation. RI is an absolute monetary
amount which includes an imputed interest charge based on investment.
23-5 Economic value added (EVA) is a specific type of residual income measure that is
calculated as follows:
Economic value
added (EVA)
=
After-tax
operating income
–
( )
Total assets minus
Weighted-average
cost of capital current liabilities
Economic value
added (EVA)
=
After-tax
operating income
–
( )
Total assets minus
Weighted-average
cost of capital current liabilities
23-6 Definitions of investment used in practice when computing ROI are as follows:
1. Total assets available
2. Total assets employed
3. Total assets employed minus current liabilities
4. Stockholders’ equity
23-
2
23-7 Current cost is the cost of purchasing an asset today identical to the one currently held if
an identical asset can currently be purchased; it is the cost of purchasing an asset that provides
services like the one currently held if an identical asset cannot be purchased. Historical-cost-based
measures of ROI compute the asset base as the original purchase cost of an asset minus any
accumulated depreciation.
Some commentators argue that current cost is oriented to current prices, while historical
cost is past-oriented.
23-8 Special problems arise when evaluating the performance of divisions in multinational
companies because
a. the economic, legal, political, social, and cultural environments differ significantly
across countries.
b. governments in some countries may impose controls and limit selling prices of
products.
c. availability of materials and skilled labor, as well as costs of materials, labor, and
infrastructure may differ significantly across countries.
d. divisions operating in different countries keep score of their performance in different
currencies.
23-9 In some cases, the subunit’s performance may not be a good indicator of a manager’s
performance. For example, companies often put the most skillful division manager in charge of
the weakest division in an attempt to improve the performance of the weak division. Such an effort
may yield results in years, not months. The division may continue to perform poorly with respect
to other divisions of the company. But it would be a mistake to conclude from the poor
performance of the division that the manager is performing poorly.
A second example of the distinction between the performance of the manager and the
performance of the subunit is the use of historical cost-based ROIs to evaluate the manager even
though historical cost-based ROIs may be unsatisfactory for evaluating the economic returns
earned by the organization subunit. Historical cost-based ROI can be used to evaluate a manager
by comparing actual results to budgeted historical cost-based ROIs.
23-10 Moral hazard describes situations in which an employee prefers to exert less effort (or to
report distorted information) compared with the effort (or accurate information) desired by the
owner because the employee’s effort (or validity of the reported information) cannot be accurately
monitored and enforced.
The situation in which the employee's effort cannot be accurately monitored and enforced and then
could not reach the expected effort from the owner is considered as moral hazard.
23-11 No. Since the performance of managers can be affected by external and uncontrollable
factors, thus the performance could not completely reflect the effort of the managers. Therefore,
when performance-based incentives are used, they are generally more costly to the owner because
it involves both compensation on basic performance and extra risk. In order to balance the benefits
of incentives against the extra costs of imposing uncontrollable risk on the manager, the motivation
for having some salary and some performance-based bonus in compensation arrangements is
suggested.
23-12 Benchmarking or relative performance evaluation is the process of evaluating a manager’s
performance against the performance of other similar operations. The ideal benchmark is another
operation that is affected by the same noncontrollable factors that affect the manager’s
23-
3
performance. Benchmarking cancels the effects of the common noncontrollable factors and
provides better information about the manager’s performance.
23-13 When employees have to perform multiple tasks as part of their jobs, incentive problems
can arise when one task is easy to monitor and measure while the other task is more difficult to
evaluate. Employers want employees to intelligently allocate time and effort among various tasks.
If, however, employees are rewarded on the basis of the task that is more easily measured, they
will tend to focus their efforts on that task and ignore the others.
23-14 Disclosures required by the Securities and Exchange Commission are as follows:
a. A summary compensation table showing the salary, bonus, stock options, other stock
awards, and other compensation earned by the five top officers in the previous three
years
b. The principles underlying the executive compensation plans, and the performance
criteria, such as profitability, sales growth, and market share used in determining
compensation
c. How well a company’s stock performed relative to the stocks of other companies in the
same industry
23-15 The four levers of control in an organization are diagnostic control systems, boundary
systems, belief systems, and interactive control systems.
• Diagnostic control systems are the set of critical performance variables that help
managers track progress toward the strategic goal. These measures are periodically
monitored and action is usually only taken if a measure is outside its acceptable limits.
• Boundary systems describe standards of behavior and codes of conduct expected of all
employees, particularly by defining actions that are off-limits. Boundary systems
prevent employees from performing harmful actions.
• Belief systems articulate the mission, purpose, and core values of a company. They
describe the accepted norms and patterns of behavior expected of all managers and
other employees with respect to each other, shareholders, customers, and communities.
• Interactive control systems are formal information systems that managers use to focus
an organization's attention and learning on key strategic issues. They form the basis of
ongoing discussion and debate about strategic uncertainties that the business faces and
help position the organization for the opportunities and threats of tomorrow.
23-16 (30 min.) ROI, comparisons of three companies.
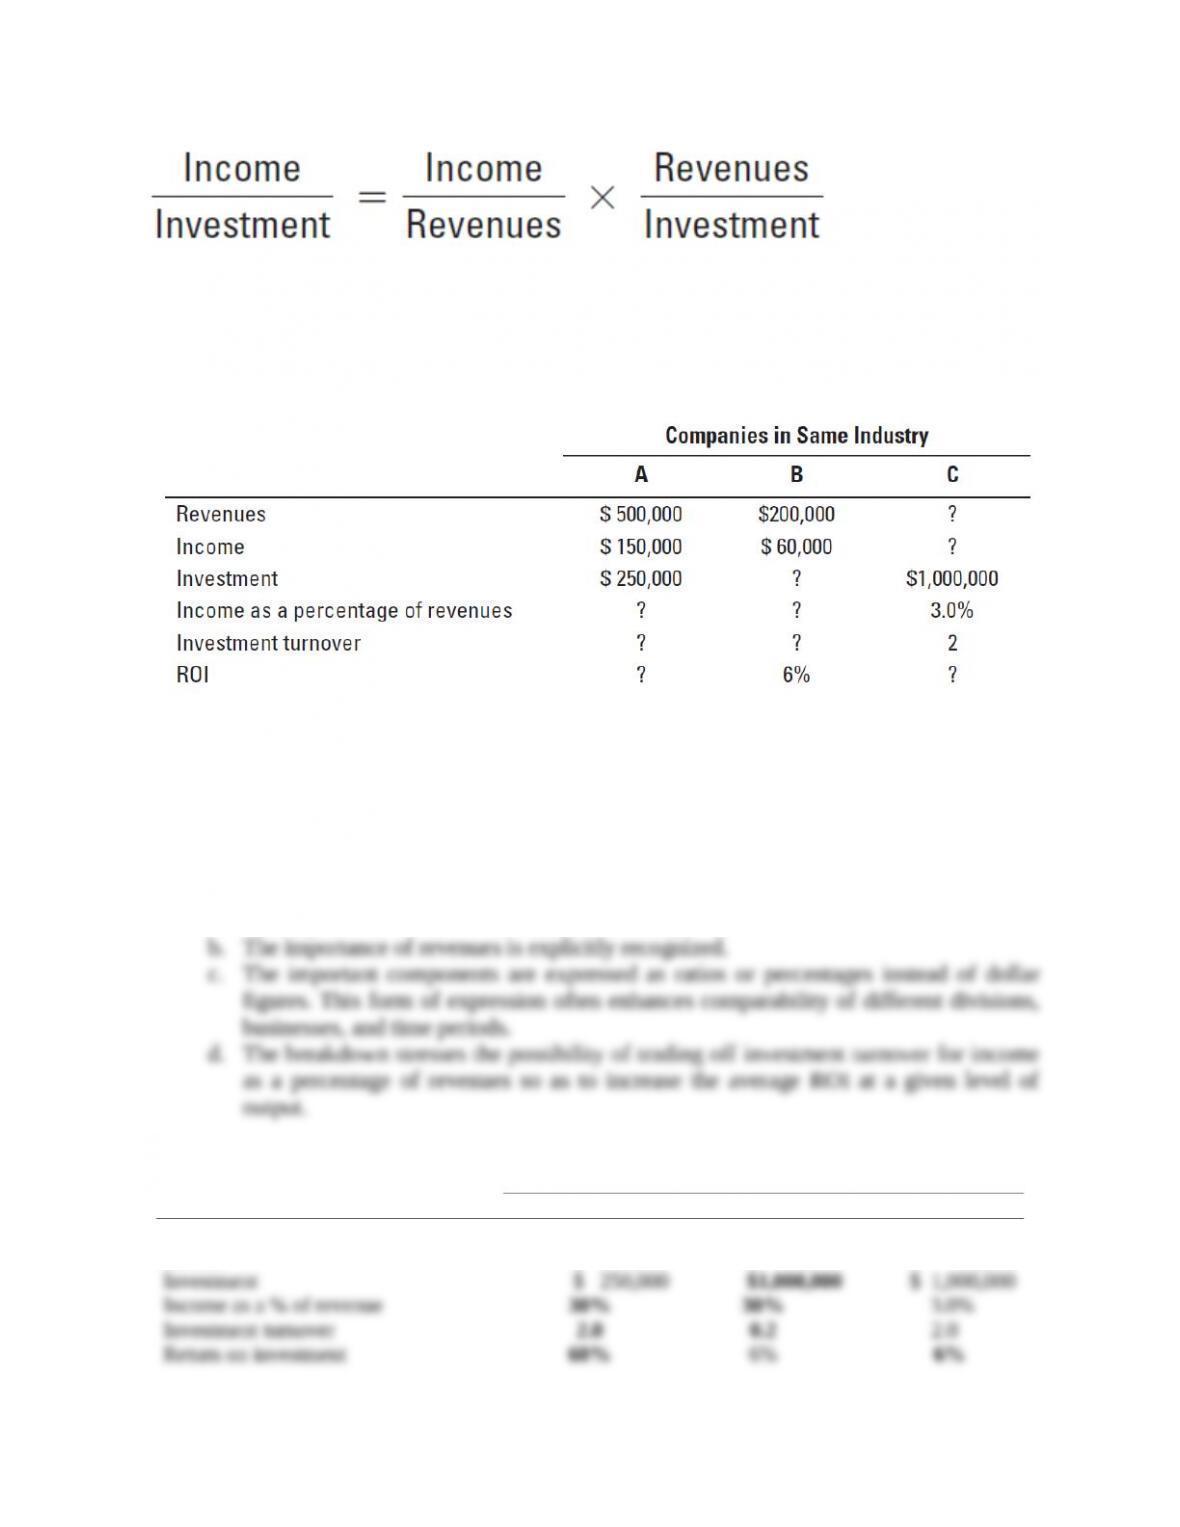
(CMA, adapted) Return on investment (ROI) is often expressed as follows:
Required:
1. What advantages are there in the breakdown of the computation into two separate components?
2. Fill in the following blanks:
23-
4
After filling in the blanks, comment on the relative performance of these companies as thoroughly
as the data permit.
SOLUTION
1. The separate components highlight several features of return on investment not revealed
by a single calculation:
a. The importance of investment turnover as a key to income is stressed.
b. The importance of revenues is explicitly recognized.
c. The important components are expressed as ratios or percentages instead of dollar
figures. This form of expression often enhances comparability of different divisions,
businesses, and time periods.
d. The breakdown stresses the possibility of trading off investment turnover for income
as a percentage of revenues so as to increase the average ROI at a given level of output.
2. (Filled-in blanks are in bold face.)
Companies in Same Industry
A
B
C
Revenue
Income
Investment
Income as a % of revenue
Investment turnover
Return on investment
$500,000
$ 150,000
$ 250,000
30%
2.0
60%
$ 200,000
$ 60,000
$1,000,000
30%
0.2
6%
$2,000,000
$ 60,000
$ 1,000,000
3.0%
2.0
6%
Income and investment alone shed little light on comparative performances because of
disparities in size between Company A and the other two companies. Thus, it is impossible to say
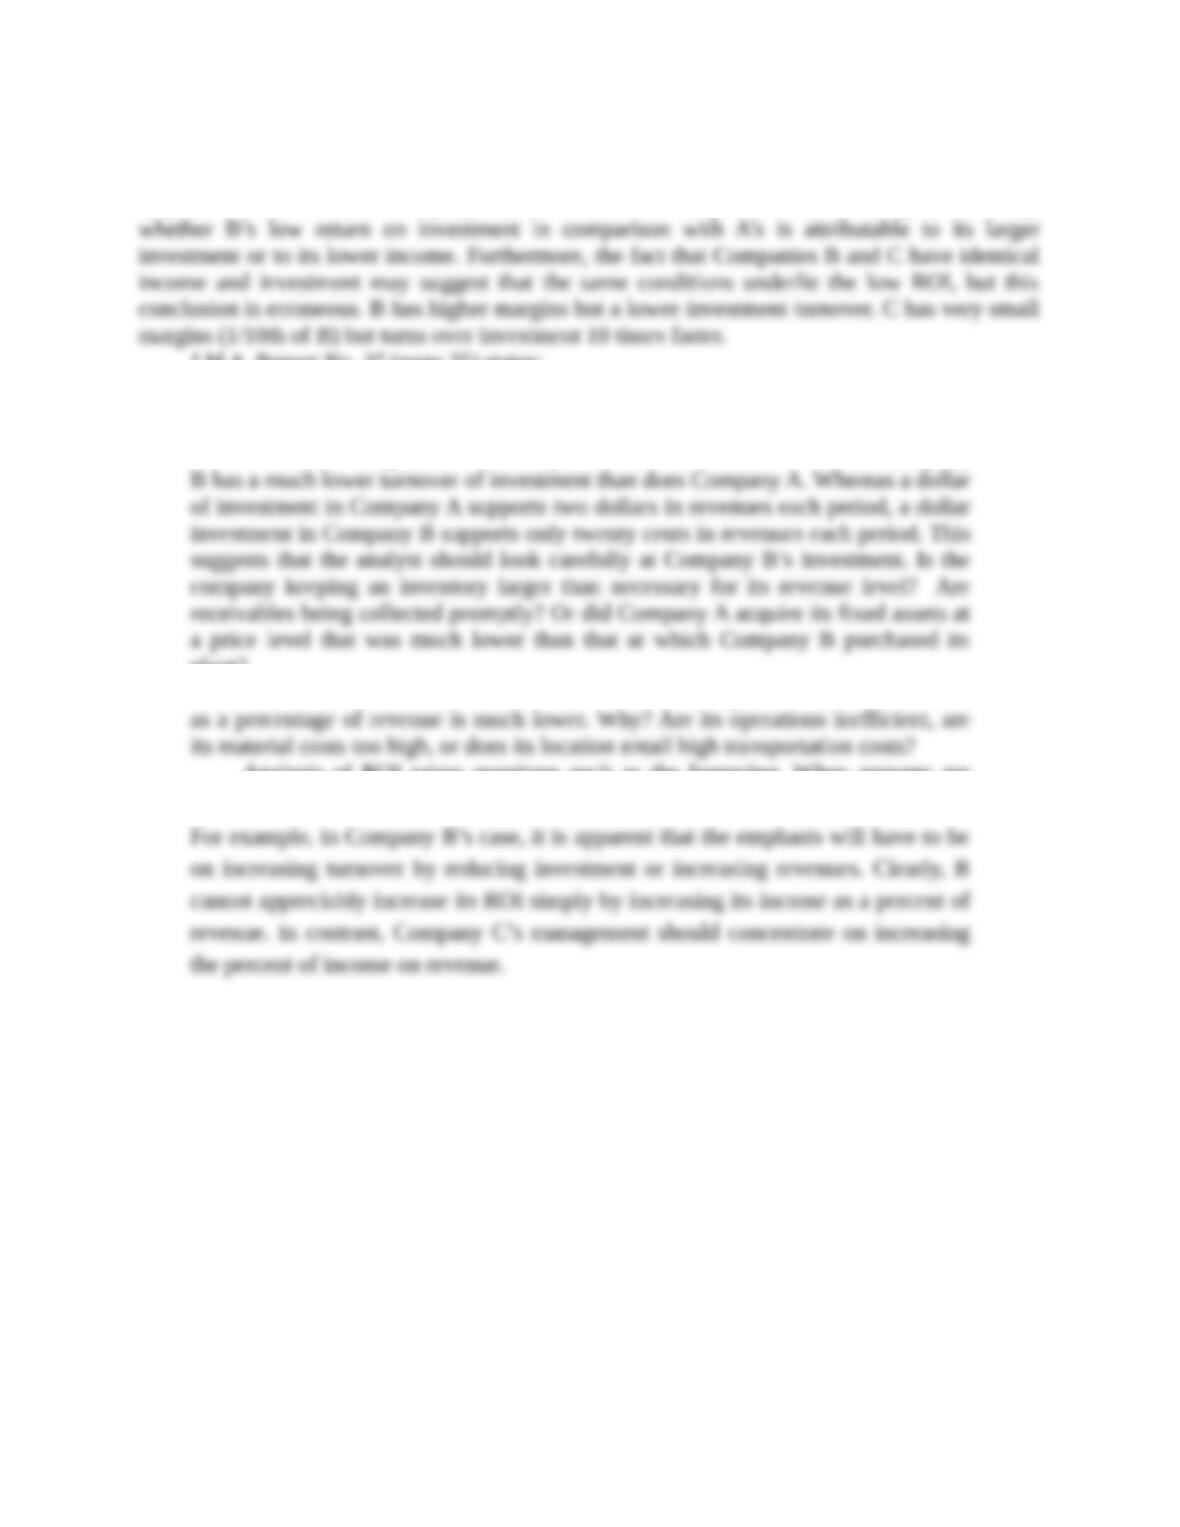
whether B’s low return on investment in comparison with A’s is attributable to its larger
investment or to its lower income. Furthermore, the fact that Companies B and C have identical
income and investment may suggest that the same conditions underlie the low ROI, but this
conclusion is erroneous. B has higher margins but a lower investment turnover. C has very small
margins (1/10th of B) but turns over investment 10 times faster.
I.M.A. Report No. 35 (page 35) states:
Introducing revenues to measure level of operations helps to disclose specific
areas for more intensive investigation. Company B does as well as Company A in
23-
5
terms of income margin, for both companies earn 30% on revenues. But Company B
has a much lower turnover of investment than does Company A. Whereas a dollar of
investment in Company A supports two dollars in revenues each period, a dollar
investment in Company B supports only twenty cents in revenues each period. This
suggests that the analyst should look carefully at Company B’s investment. Is the
company keeping an inventory larger than necessary for its revenue level? Are
receivables being collected promptly? Or did Company A acquire its fixed assets at
a price level that was much lower than that at which Company B purchased its plant?
On the other hand, C’s investment turnover is as high as A’s, but C’s income as
a percentage of revenue is much lower. Why? Are its operations inefficient, are its
material costs too high, or does its location entail high transportation costs?
Analysis of ROI raises questions such as the foregoing. When answers are
obtained, basic reasons for differences between rates of return may be discovered.
For example, in Company B’s case, it is apparent that the emphasis will have to be
on increasing turnover by reducing investment or increasing revenues. Clearly, B
cannot appreciably increase its ROI simply by increasing its income as a percent of
revenue. In contrast, Company C’s management should concentrate on increasing the
percent of income on revenue.
23-
6
23-17 (30 min.) Analysis of return on invested assets, comparison of two divisions,
DuPont method.
Global Data, Inc., has two divisions: Test Preparation and Language Arts. Results (in millions) for
the past three years are partially displayed here:
Required:
1. Complete the table by filling in the blanks.
2. Use the DuPont method of profitability analysis to explain changes in the operating-income-
to-total assets ratios over the 2012–2014 period for each division and for Global Data as a
whole. Comment on the results.
23-
7
SOLUTION
1.
Operating Income
Operating Revenues
Total Assets
Operating
Income
Operating
Revenues
Operating Revenues
Total Assets
Test Preparation Division
2012
$720
$9,000
$1,800
8.0%
5.0
2013
920
$920
11.5% = $8,000
$920
46% = $2,000
11.5%
4.0
2014
1,140
$1,140
9.5% = $12,000
$12,000
6 = $2,000
9.5%
6.0
Language Arts Division
2012
$660
$3,000
$2,000
22.0%
1.5
2013
$3,525
20%= $705
3,525
2,350
20.0%
1.5
2014
$2,900
20% = $580
$2,900
1.6 = $4,640
2,900
12.5%
1.6
Global Data, Inc.
2012
$1,380
$12,000
$3,800
11.5%
3.2
2013
$920 + $705 = $1,625
$8,000 + $3,525 = $11,525
$2,000 + $2,350 = $4,350
14.1%
2.6
2014
$1,140 + $580 = $1,720
$12,000 + $4,640 = $16,640
$2,000 + $2,900 = $4,900
10.3%
3.4
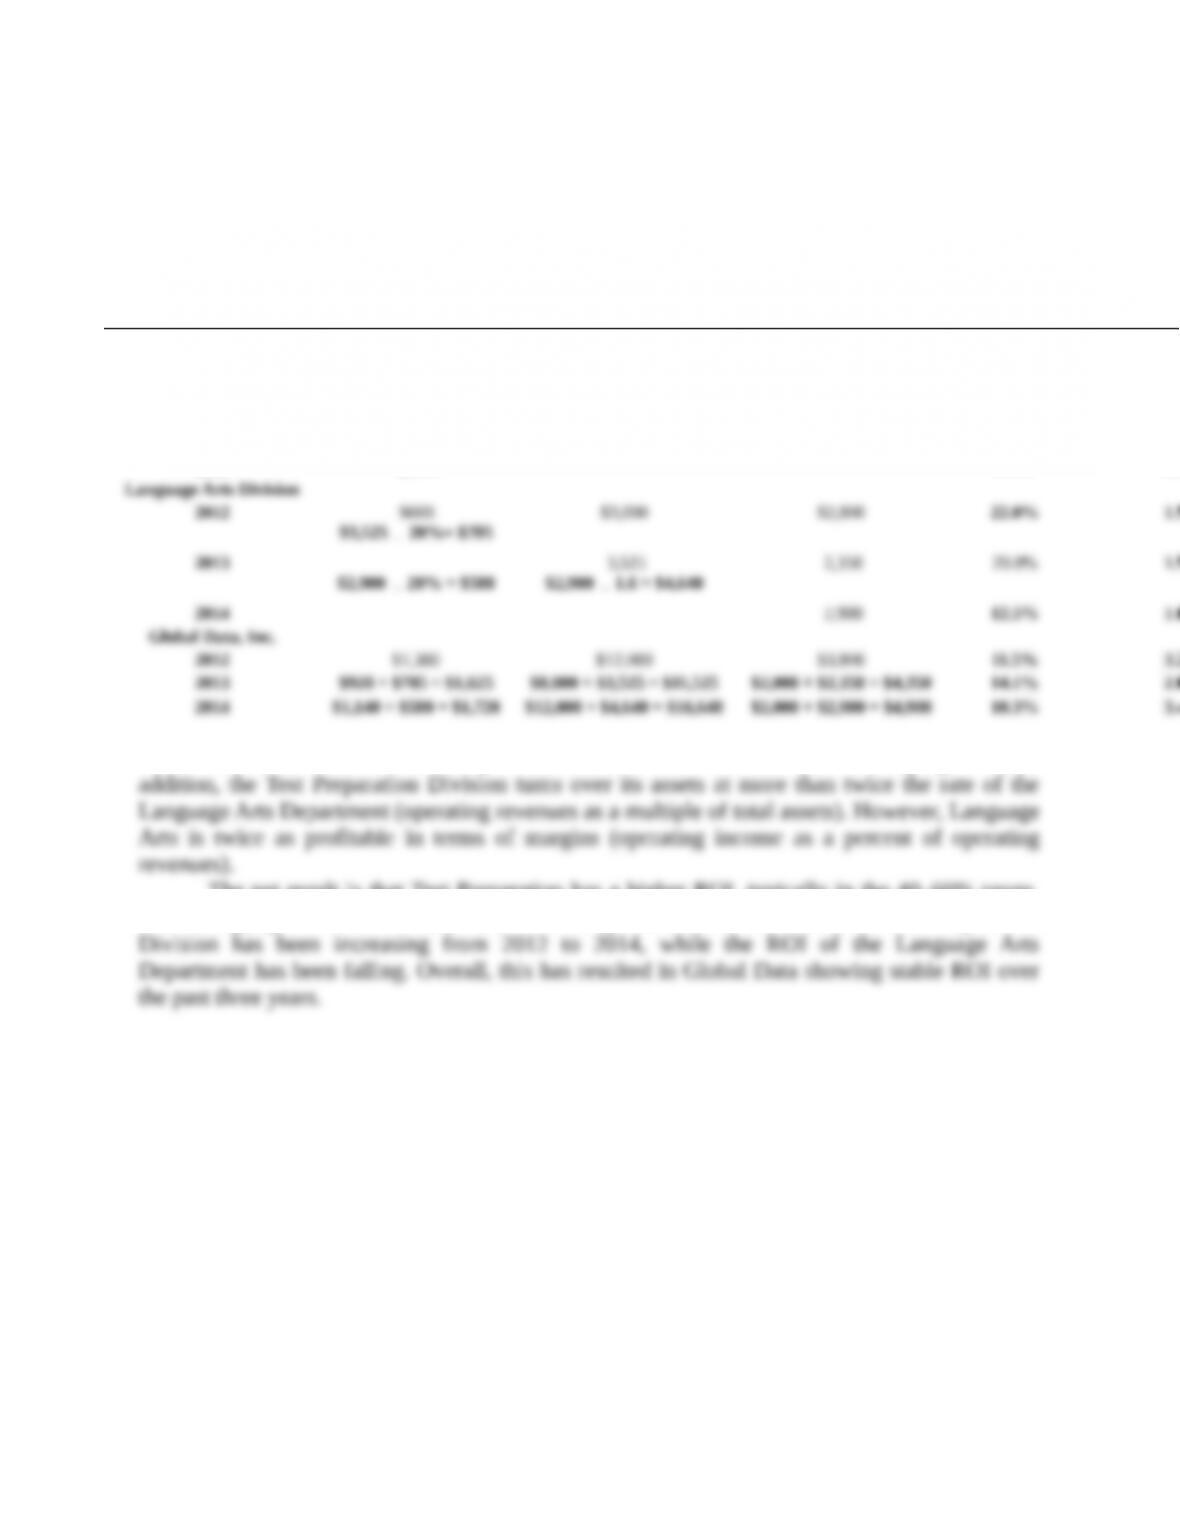
2. Based on revenues, Test Preparation is more than twice the size of Language Arts. In
addition, the Test Preparation Division turns over its assets at more than twice the rate of the
Language Arts Department (operating revenues as a multiple of total assets). However, Language
Arts is twice as profitable in terms of margins (operating income as a percent of operating
revenues).
The net result is that Test Preparation has a higher ROI, typically in the 40–60% range,
while Language Arts has ROI in the 20–35% range. Moreover, the ROI of the Test Preparation
Division has been increasing from 2012 to 2014, while the ROI of the Language Arts Department
has been falling. Overall, this has resulted in Global Data showing stable ROI over the past three
years.
SOLUTION
23-18 (10–15 min.) ROI and RI.
(D. Kleespie, adapted) The Outdoor Sports Company produces a wide variety of outdoor sports
equipment. Its newest division, Golf Technology, manufactures and sells a single product—
AccuDriver, a golf club that uses global positioning satellite technology to improve the accuracy
of golfers’ shots. The demand for AccuDriver is relatively insensitive to price changes. The
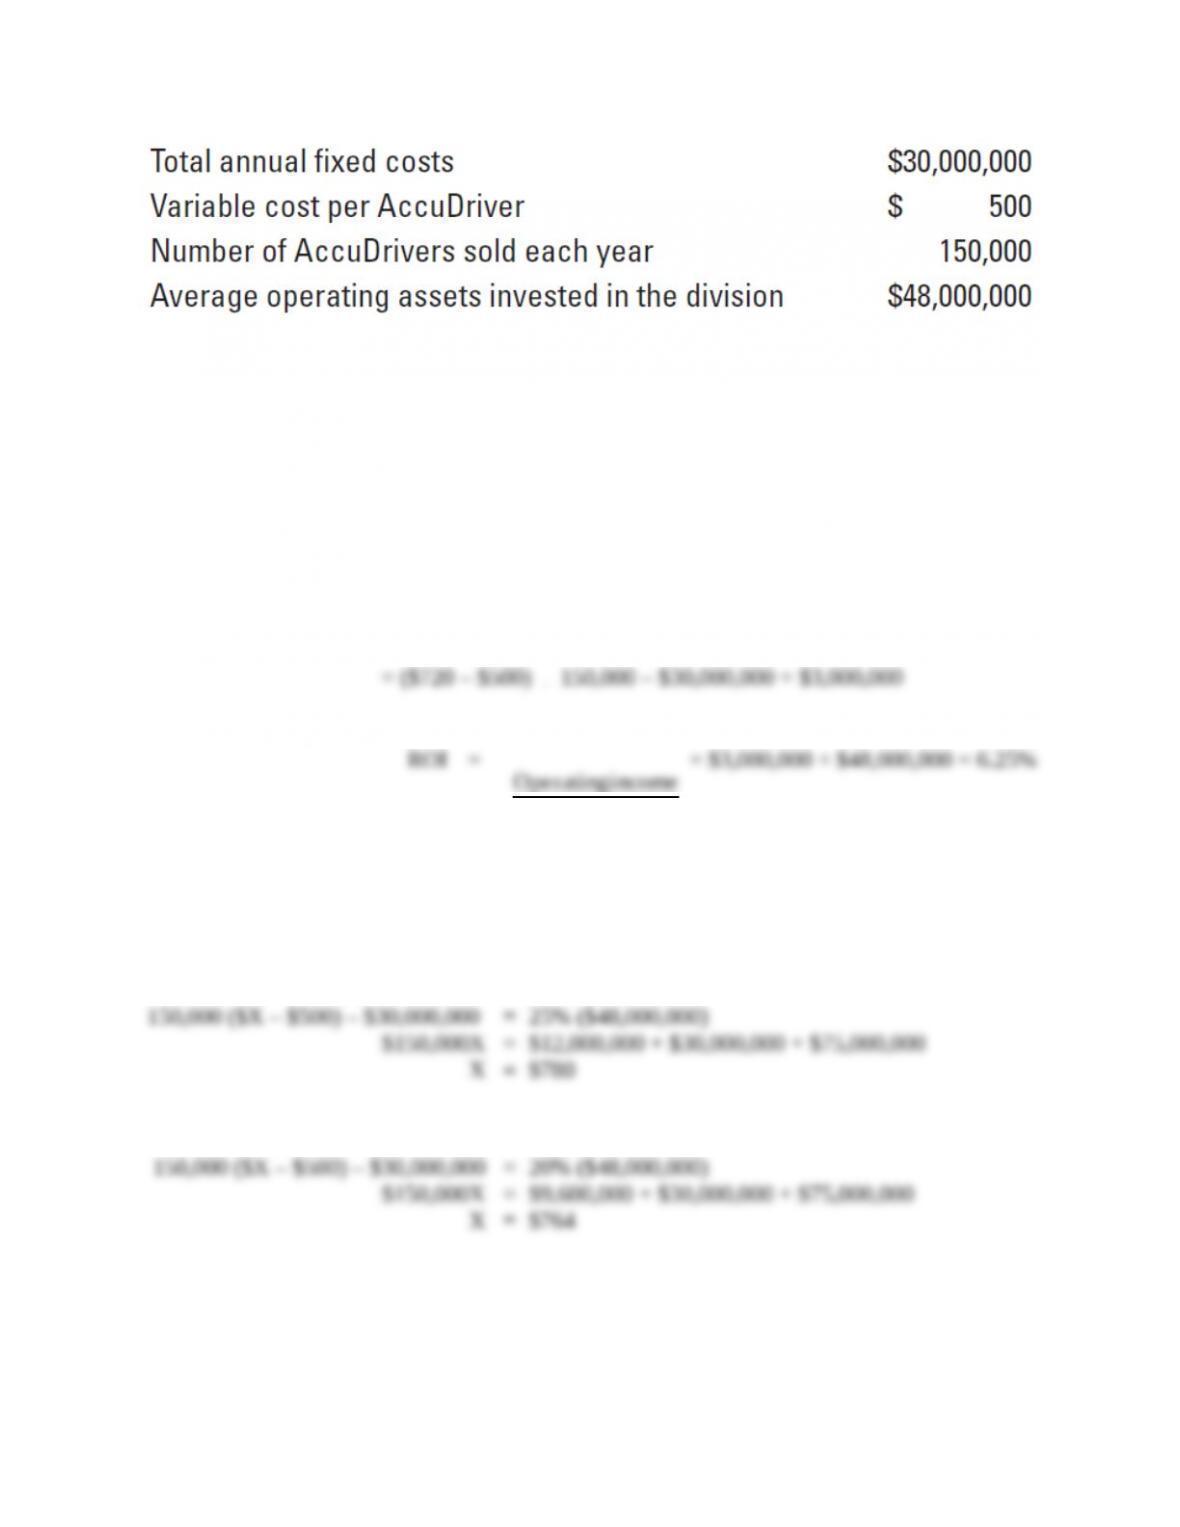
following data are available for Golf Technology, which is an investment center for Outdoor
Sports:
23-
8
Required:
1. Compute Golf Technology’s ROI if the selling price of AccuDrivers is $720 per club.
2. If management requires an ROI of at least 25% from the division, what is the minimum selling
price that the Golf Technology Division should charge per AccuDriver club?
3. Assume that Outdoor Sports judges the performance of its investment centers on the basis of
RI rather than ROI. What is the minimum selling price that Golf Technology should charge
per AccuDriver if the company’s required rate of return is 20%?
SOLUTION
1. Operating income = (Contribution margin per unit
150,000 units) – Fixed costs
= ($720 – $500)
150,000 – $30,000,000 = $3,000,000
ROI =
Investment
income Operating
= $3,000,000 ÷ $48,000,000 = 6.25%
2. Operating income = ROI Investment
[No. of pairs sold (Selling price – Var. cost per unit)] – Fixed costs = ROI Investment
Let $X = minimum selling price per unit to achieve a 25% ROI
150,000 ($X – $500) – $30,000,000 = 25% ($48,000,000)
$150,000X = $12,000,000 + $30,000,000 + $75,000,000
X = $780
3. Let $X = minimum selling price per unit to achieve a 20% rate of return
150,000 ($X – $500) – $30,000,000 = 20% ($48,000,000)
$150,000X = $9,600,000 + $30,000,000 + $75,000,000
X = $764
23-19 (20 min.) ROI and RI with manufacturing costs.
Fabulous Motor Company makes electric cars and has two products, the Simplegreen and the
Fabulousgreen. To produce the Simplegreen, Fabulous Motor employed assets of $24,500,000 at
the beginning of the period and $30,000,000 of assets at the end of the period. Other costs to
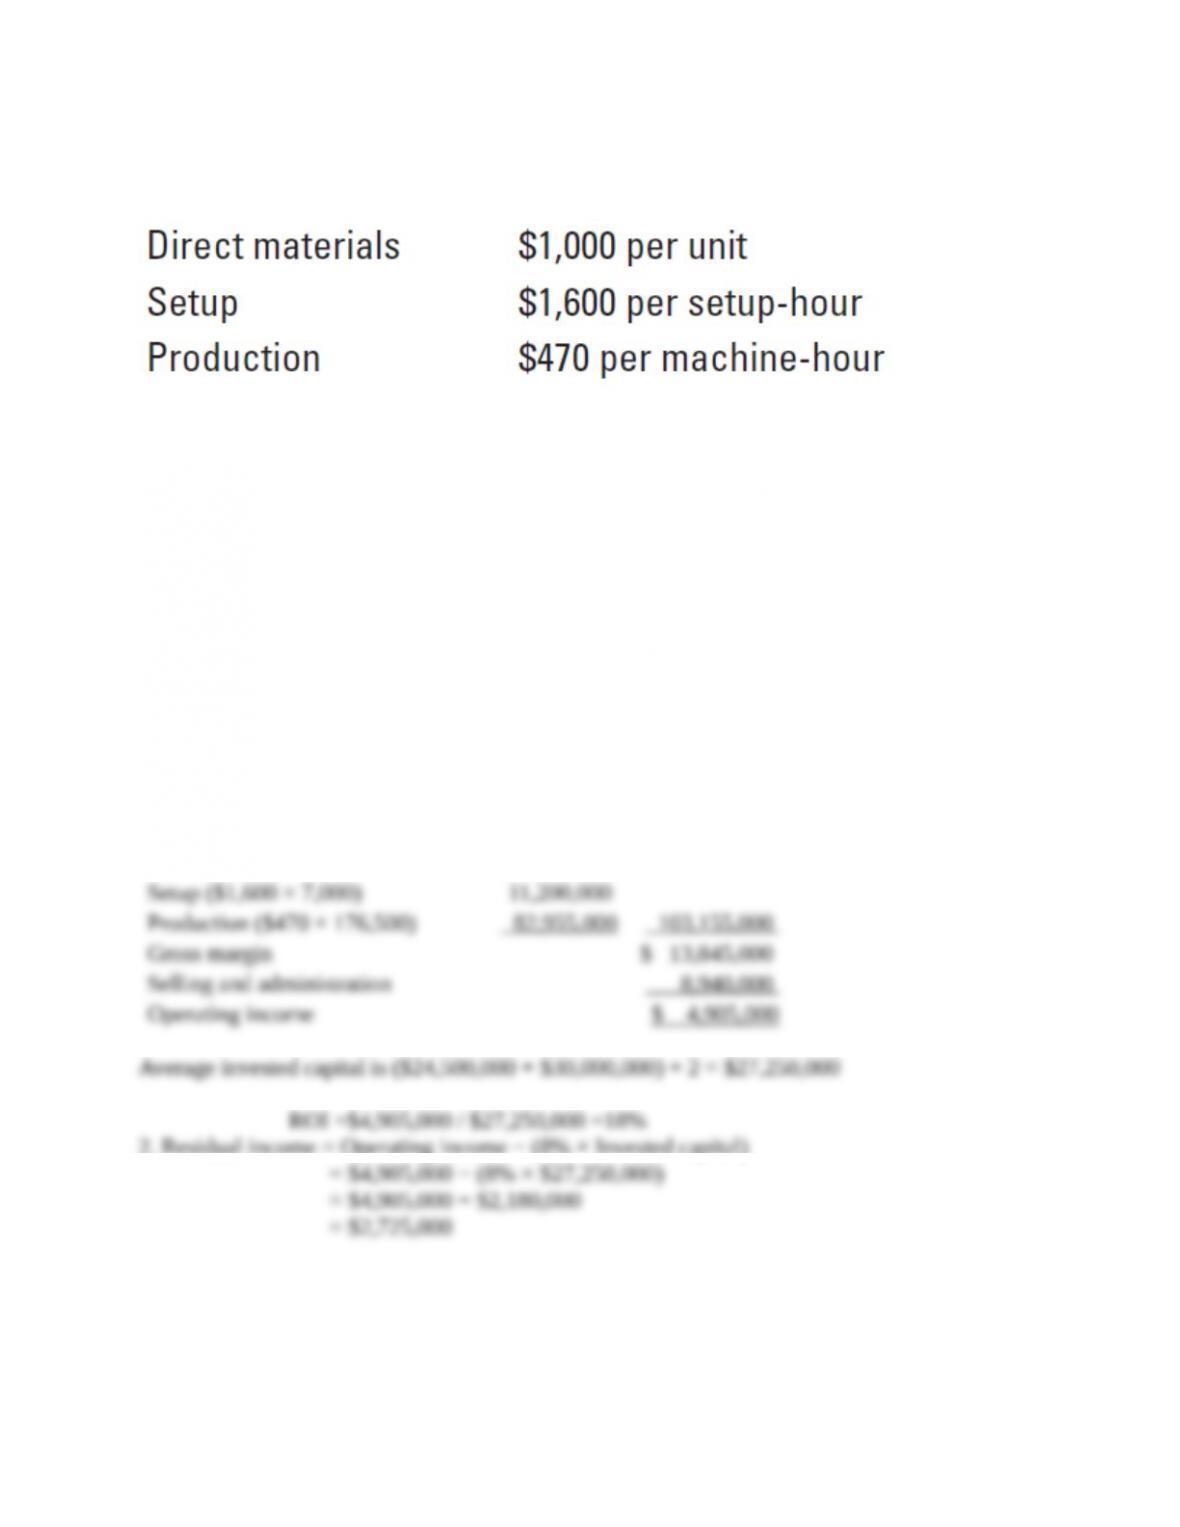
manufacture the Simplegreen include the following:
23-
9
General administration and selling costs total $8,940,000 for the period. In the current period,
Fabulous Motor produced 9,000 Simplegreen cars using 7,000 setup-hours and 176,500 machine-
hours. Fabulous Motor sold these cars for $13,000 each.
Required:
1. Assuming that Fabulous Motor defines investment as average assets during the period, what is
the return on investment for the Simplegreen division?
2. Calculate the residual income for Simplegreen if Fabulous Motor has a required rate of return
of 8% on investments.
SOLUTION
1. The operating income is:
Sales revenue ($13,000 × 9,000)
$117,000,000
Less:
Direct materials ($1,000 × 9,000)
$ 9,000,000
Setup ($1,600 × 7,000)
11,200,000
Production ($470 × 176,500)
82,955,000
103,155,000
Gross margin
$ 13,845,000
Selling and administration
8,940,000
Operating income
$ 4,905,000
Average invested capital is ($24,500,000 + $30,000,000) ÷ 2 = $27,250,000
ROI =$4,905,000 / $27,250,000 =18%
2. Residual income = Operating income − (8% × Invested capital)
= $4,905,000 − (8% × $27,250,000)
= $4,905,000 − $2,180,000
= $2,725,000


