Unlock document.
This document is partially blurred.
Unlock all pages and 1 million more documents.
Get Access
21-1
SOLUTION
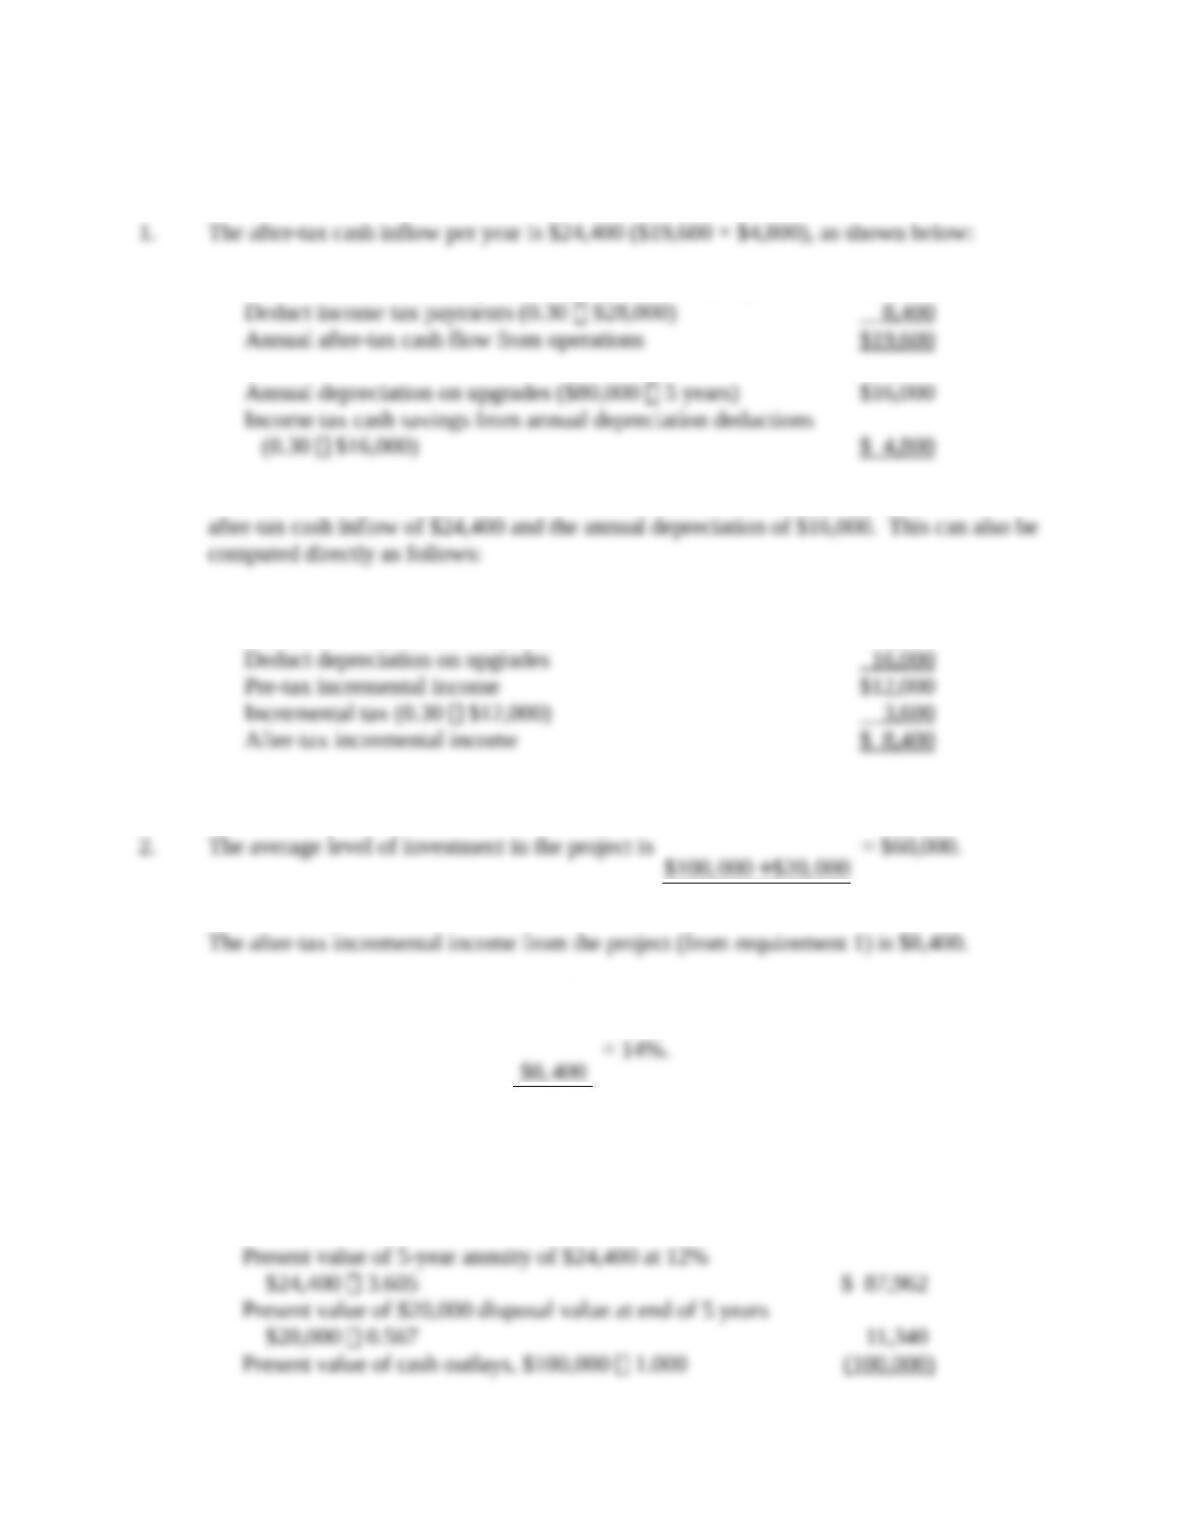
1. The after-tax cash inflow per year is $24,400 ($19,600 + $4,800), as shown below:
Annual cash flow from operations ($43,000 – $15,000)
$28,000
Deduct income tax payments (0.30 $28,000)
8,400
Annual after-tax cash flow from operations
$19,600
Annual depreciation on upgrades ($80,000 5 years)
$16,000
Income tax cash savings from annual depreciation deductions
(0.30 $16,000)
$ 4,800
The expected increase in net annual income is $8,400, the difference between the after-
tax cash inflow of $24,400 and the annual depreciation of $16,000. This can also be
computed directly as follows:
Incremental margins
$43,000
Deduct incremental cash expenses
15,000
Deduct depreciation on upgrades
16,000
Pre-tax incremental income
$12,000
Incremental tax (0.30 $12,000)
3,600
After-tax incremental income
$ 8,400
2. The average level of investment in the project is
$100,000 $20,000
2
+
= $60,000.
The after-tax incremental income from the project (from requirement 1) is $8,400.
The accrual accounting rate of return on average investment is therefore
$8,400
$60,000
= 14%.
1. The project is not worth investing in from an NPV standpoint. Its NPV is $(698),
calculated as follows:
Present value of 5-year annuity of $24,400 at 12%
$24,400 3.605 $ 87,962
Present value of $20,000 disposal value at end of 5 years
$20,000 0.567 11,340
Present value of cash outlays, $100,000 1.000 (100,000)
Net present value $ (698)
21-2
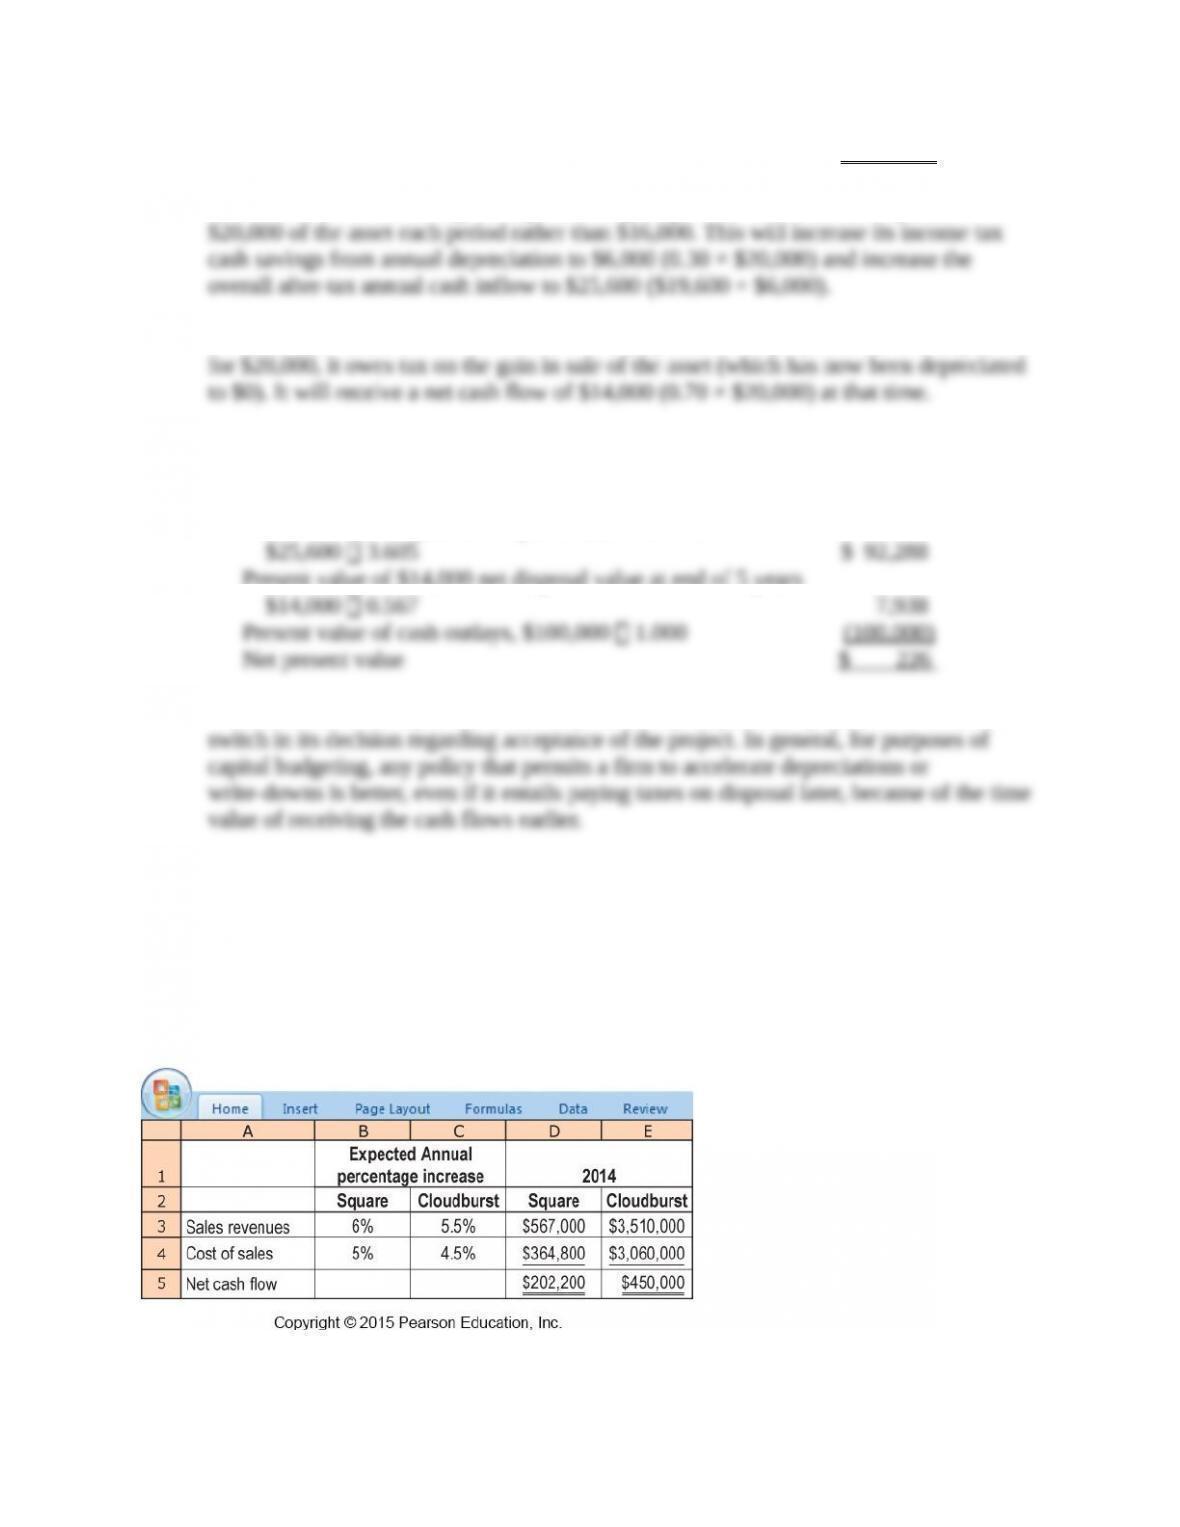
4. The first effect of the change in depreciation policy is that Harrison can depreciate
$20,000 of the asset each period rather than $16,000. This will increase its income tax
cash savings from annual depreciation to $6,000 (0.30 × $20,000) and increase the
overall after-tax annual cash inflow to $25,600 ($19,600 + $6,000).
The second effect is that now when Harrison disposes of the project at the end of year 5
for $20,000, it owes tax on the gain in sale of the asset (which has now been depreciated
to $0). It will receive a net cash flow of $14,000 (0.70 × $20,000) at that time.
The project is now worth investing in from an NPV standpoint. Its NPV is $226,
calculated as follows:
Present value of 5-year annuity of $25,600 at 12%
$25,600 3.605 $ 92,288
Present value of $14,000 net disposal value at end of 5 years
$14,000 0.567 7,938
Present value of cash outlays, $100,000 1.000 (100,000)
Net present value $ 226
From Harrison’s standpoint, the new depreciation policy is clearly better and leads to a
switch in its decision regarding acceptance of the project. In general, for purposes of
capital budgeting, any policy that permits a firm to accelerate depreciations or write-
downs is better, even if it entails paying taxes on disposal later, because of the time value
of receiving the cash flows earlier.
21-27 (40 min.) Customer value.
Ortel Telecom sells telecommunication products and services to a variety of small businesses. Two
of Ortel’s key clients are Square and Cloudburst, both fast-growing technology start- ups located
in New York City. Ortel has compiled information regarding its transactions with Square and
Cloudburst for 2014, as well as its expectations regarding their interactions for the next 3 years:
Ortel’s transactions with Square and Cloudburst are in cash. Assume that they occur at year-end.
Ortel is headquartered in the Cayman Islands and pays no income taxes. The owners of Ortel insist
on a required rate of return of 12%.
21-3
Required:
1. What is the expected net cash flow from Square and Cloudburst for the next 3 years?
2. Based on the net present value from cash flows over the next 3 years, is Cloudburst or Square
a more valuable customer for Ortel?
3. Cloudburst threatens to switch to another supplier unless Ortel gives a 10% price reduction on
all sales starting in 2015. Calculate the 3-year NPV of Cloudburst after incorporating the 10%
discount. Should Ortel continue to transact with Cloudburst? What other factors should it
consider before making its final decision?
SOLUTION
1.
Square
Annual
Increases*
2014
2015
2016
2017
Cash Revenues
6%
$567,000
$601,020
$637,081
$675,306
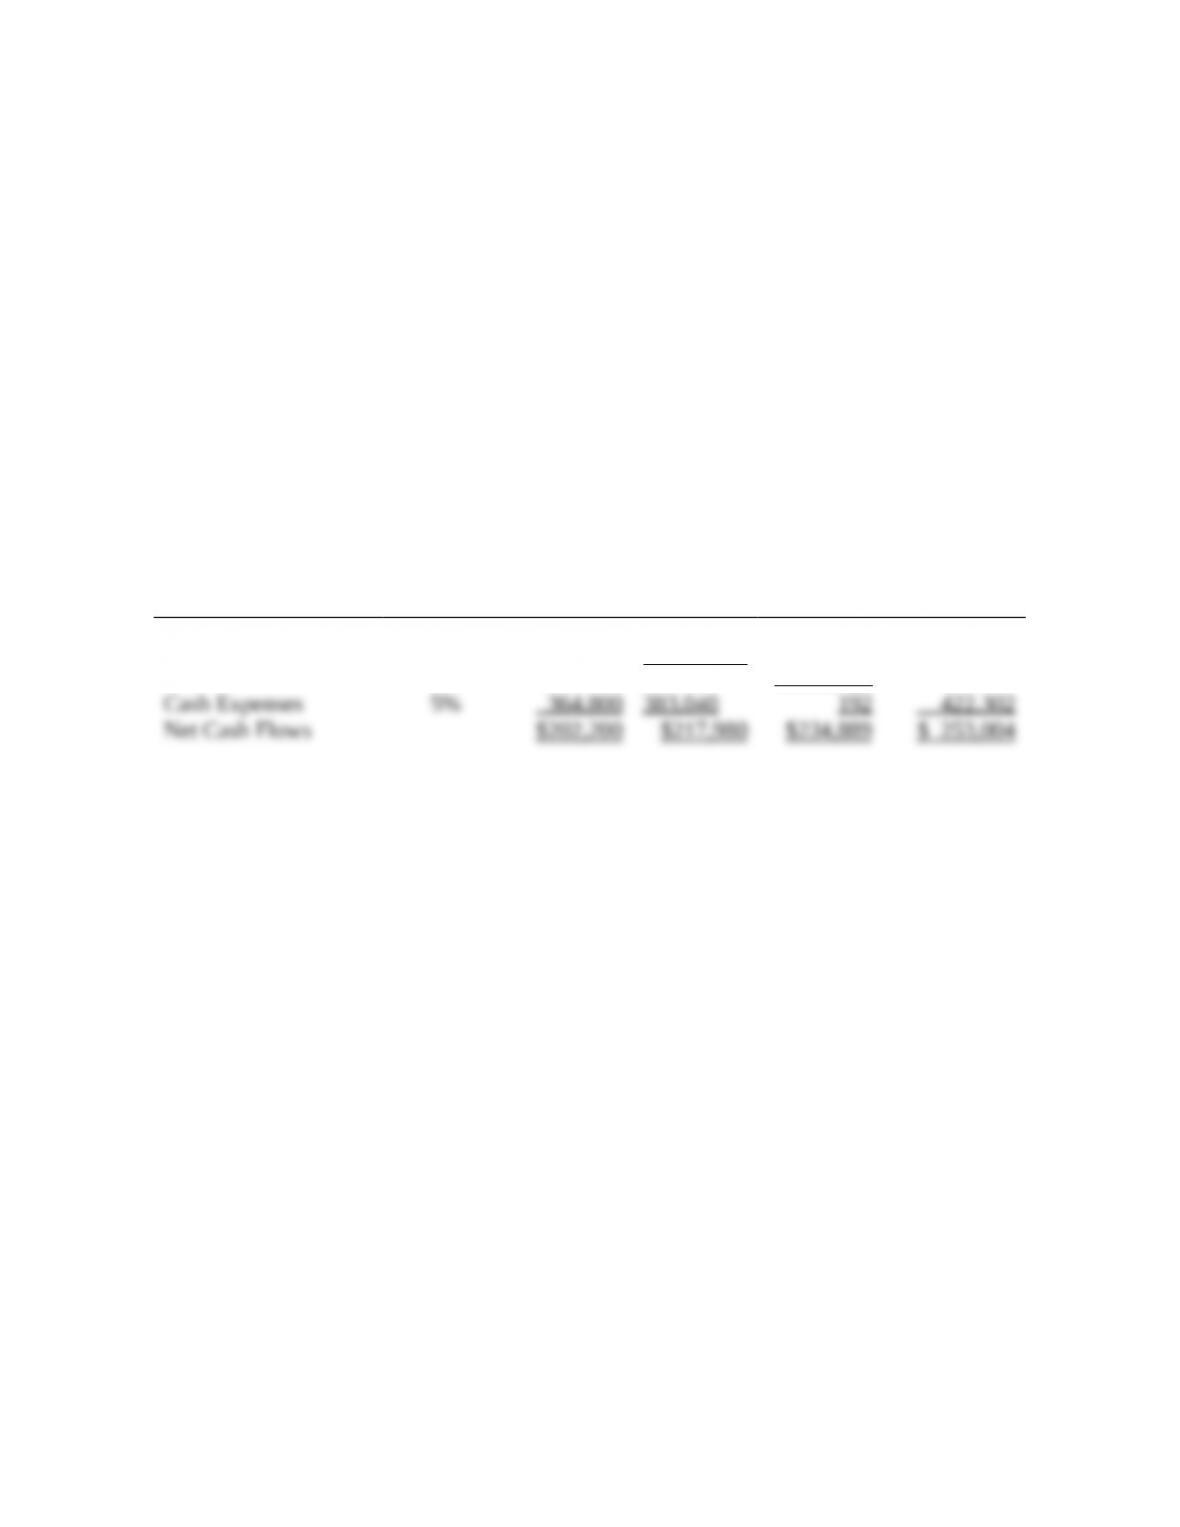
Cash Expenses
5%
364,800
383,040
402,192
422,302
Net Cash Flows
$202,200
$217,980
$234,889
$ 253,004
Cloudburst
Annual
Increases*
2014
2015
2016
2017
Cash Revenues
5.5%
$3,510,000
$3,703,050
$3,906,718
$4,121,587
Cash Expenses
4.5%
3,060,000
3,197,700
3,341,597
3,491,968
Net Cash Flows
$ 450,000
$ 505,350
$ 565,121
$ 629,619
*Given in the problem.
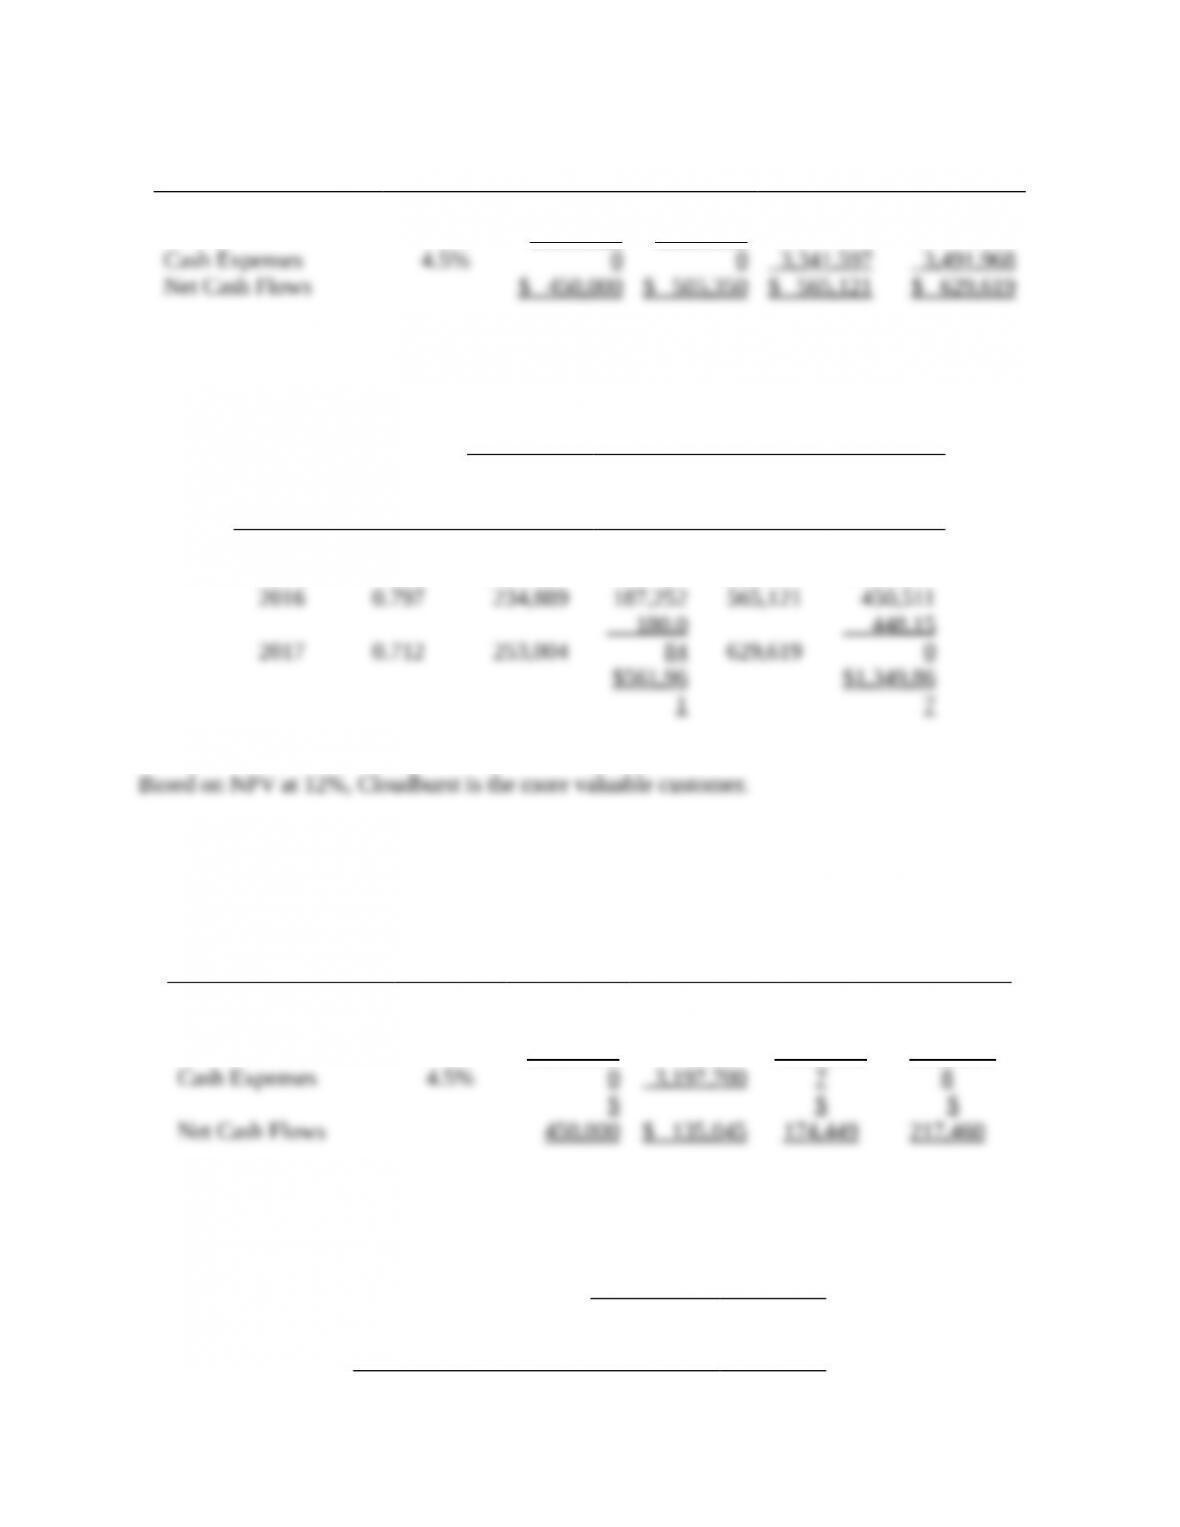
2.
Square
Cloudburst
Year
PV Factor
for 12%
Net Cash
Flows
Present
Value
Net Cash
Flows
Present
Value
2015
0.893
$217,980
$194,625
$505,350
$451,205
2016
0.797
234,889
187,252
565,121
450,511
2017
0.712
253,004
180,084
629,619
448,150
$561,961
$1,349,867
Based on NPV at 12%, Cloudburst is the more valuable customer.
3. Assuming a 10% discount on the revenues for Cloudburst calculated in requirement 1, we
have
Cloudburst
Annual
Increases
2014
2015
2016
2017
Cash Revenues*
5.5%
$3,510,000
$3,332,745
$3,516,046
$3,709,428
Cash Expenses
4.5%
3,060,000
3,197,700
3,341,597
3,491,968
Net Cash Flows
$ 450,000
$ 135,045
$ 174,449
$ 217,460
* Cloudburst’s revenue from requirement 1 reduced by 10% each year from 2015 onwards.
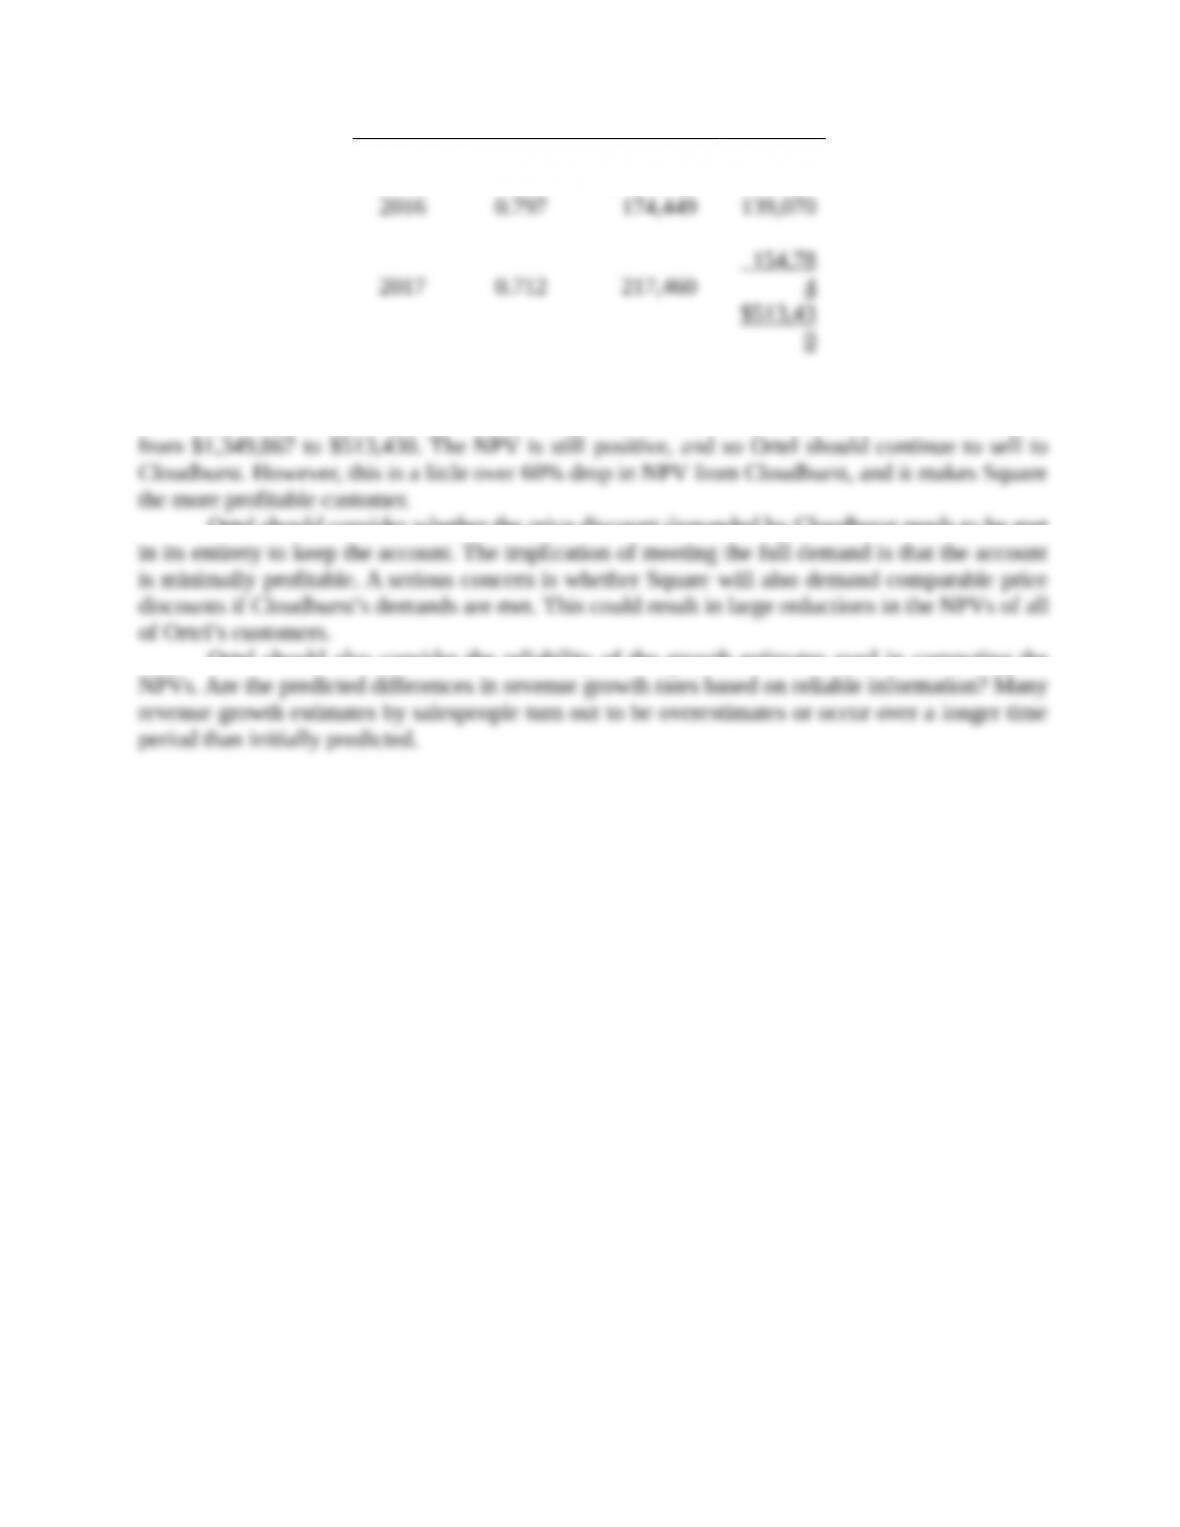
Net present value if revenues are reduced by 10% each year relative to original estimates:
Cloudburst
Year
PV Factor
for 12%
Net Cash
Flows
Present
Value
2015
0.893
$135,045
$120,576
2016
0.797
174,449
139,070
2017
0.712
217,460
154,784
$513,430
21-5
The 10% discount and reduced subsequent annual revenue reduces the NPV substantially
from $1,349,867 to $513,430. The NPV is still positive, and so Ortel should continue to sell to
Cloudburst. However, this is a little over 60% drop in NPV from Cloudburst, and it makes Square
the more profitable customer.
Ortel should consider whether the price discount demanded by Cloudburst needs to be met
in its entirety to keep the account. The implication of meeting the full demand is that the account is
minimally profitable. A serious concern is whether Square will also demand comparable price
discounts if Cloudburst’s demands are met. This could result in large reductions in the NPVs of all
of Ortel’s customers.
Ortel should also consider the reliability of the growth estimates used in computing the
NPVs. Are the predicted differences in revenue growth rates based on reliable information? Many
revenue growth estimates by salespeople turn out to be overestimates or occur over a longer time
period than initially predicted.
21-28 (60 min.) Selling a plant, income taxes.
(CMA, adapted) The Lucky Seven Company is an international clothing manufacturer. Its
Redmond plant will become idle on December 31, 2014. Peter Laney, the corporate controller, has
been asked to look at three options regarding the plant:
▪ Option 1: The plant, which has been fully depreciated for tax purposes, can be sold
immediately for $900,000.
▪ Option 2: The plant can be leased to the Preston Corporation, one of Lucky Seven’s
suppliers, for 4 years. Under the lease terms, Preston would pay Lucky Seven $220,000 rent
per year (payable at year-end) and would grant Lucky Seven a $40,000 annual discount off
the normal price of fabric purchased by Lucky Seven. (Assume that the discount is received
at year-end for each of the 4 years.) Preston would bear all of the plant’s ownership costs.
Lucky Seven expects to sell this plant for $150,000 at the end of the 4-year lease.
▪ Option 3: The plant could be used for 4 years to make souvenir jackets for the Olympics.
Fixed over- head costs (a cash outflow) before any equipment upgrades are estimated to be
$20,000 annually for the 4-year period. The jackets are expected to sell for $55 each. Variable
cost per unit is expected to be $43. The following production and sales of jackets are
expected: 2015, 18,000 units; 2016, 26,000 units; 2017, 30,000 units; 2018, 10,000 units. In
order to manufacture the jackets, some of the plant equipment would need to be upgraded at
an immediate cost of $160,000. The equipment would be depreciated using the straight-line
depreciation method and zero terminal disposal value over the 4 years it would be in use.
Because of the equipment upgrades, Lucky Seven could sell the plant for $270,000 at the
end of 4 years. No change in working capital would be required.
Lucky Seven treats all cash flows as if they occur at the end of the year, and it uses an after-tax
required rate of return of 10%. Lucky Seven is subject to a 35% tax rate on all income, including
capital gains.
21-6
Required:
1. Calculate net present value of each of the options and determine which option Lucky Seven
should select using the NPV criterion.
2. What nonfinancial factors should Lucky Seven consider before making its choice?
SOLUTION
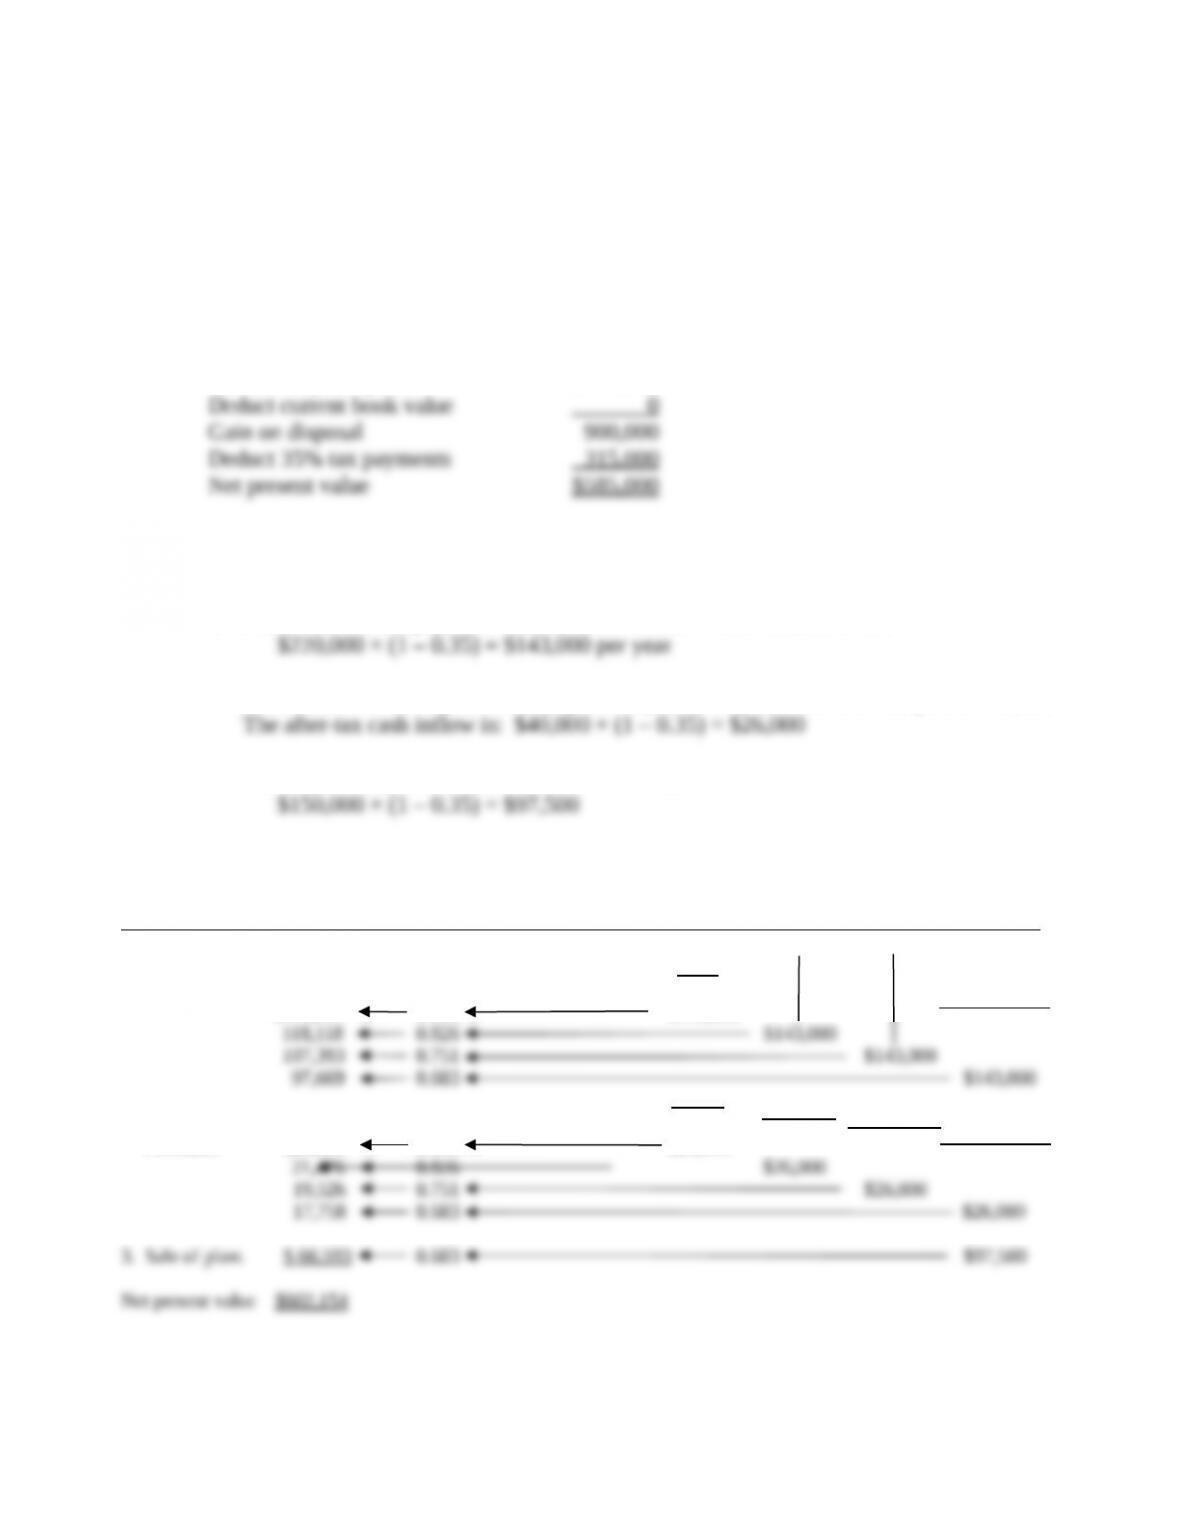
1. Option 1
Current disposal price $900,000
Deduct current book value 0
Gain on disposal 900,000
Deduct 35% tax payments 315,000
Net present value $585,000
Option 2
Lucky Seven receives three sources of cash inflows:
a. Rent. Four annual payments of $220,000. The after-tax cash inflow is:
$220,000 × (1 – 0.35) = $143,000 per year
b. Discount on material purchases, payable at year-end for each of the four years: $40,000
The after-tax cash inflow is: $40,000 × (1 – 0.35) = $26,000
c. Sale of plant at year-end 2018. The after-tax cash inflow is:
$150,000 × (1 – 0.35) = $97,500
Present Value
Total Discount
Present Factors at
Value 10% Sketch of Relevant After-Tax Cash Flows
0 1 2 3 4
1. Rent
$129,987 0.909 $143,000
118,118 0.826 $143,000
107,393 0.751 $143,000
97,669 0.683 $143,000
2. Discount on
Purchases $23,634 0.909 $26,000
21,476 0.826 $26,000
19,526 0.751 $26,000
17,758 0.683 $26,000
3. Sale of plant $ 66,593 0.683 $97,500
Net present value $602,154
21-7
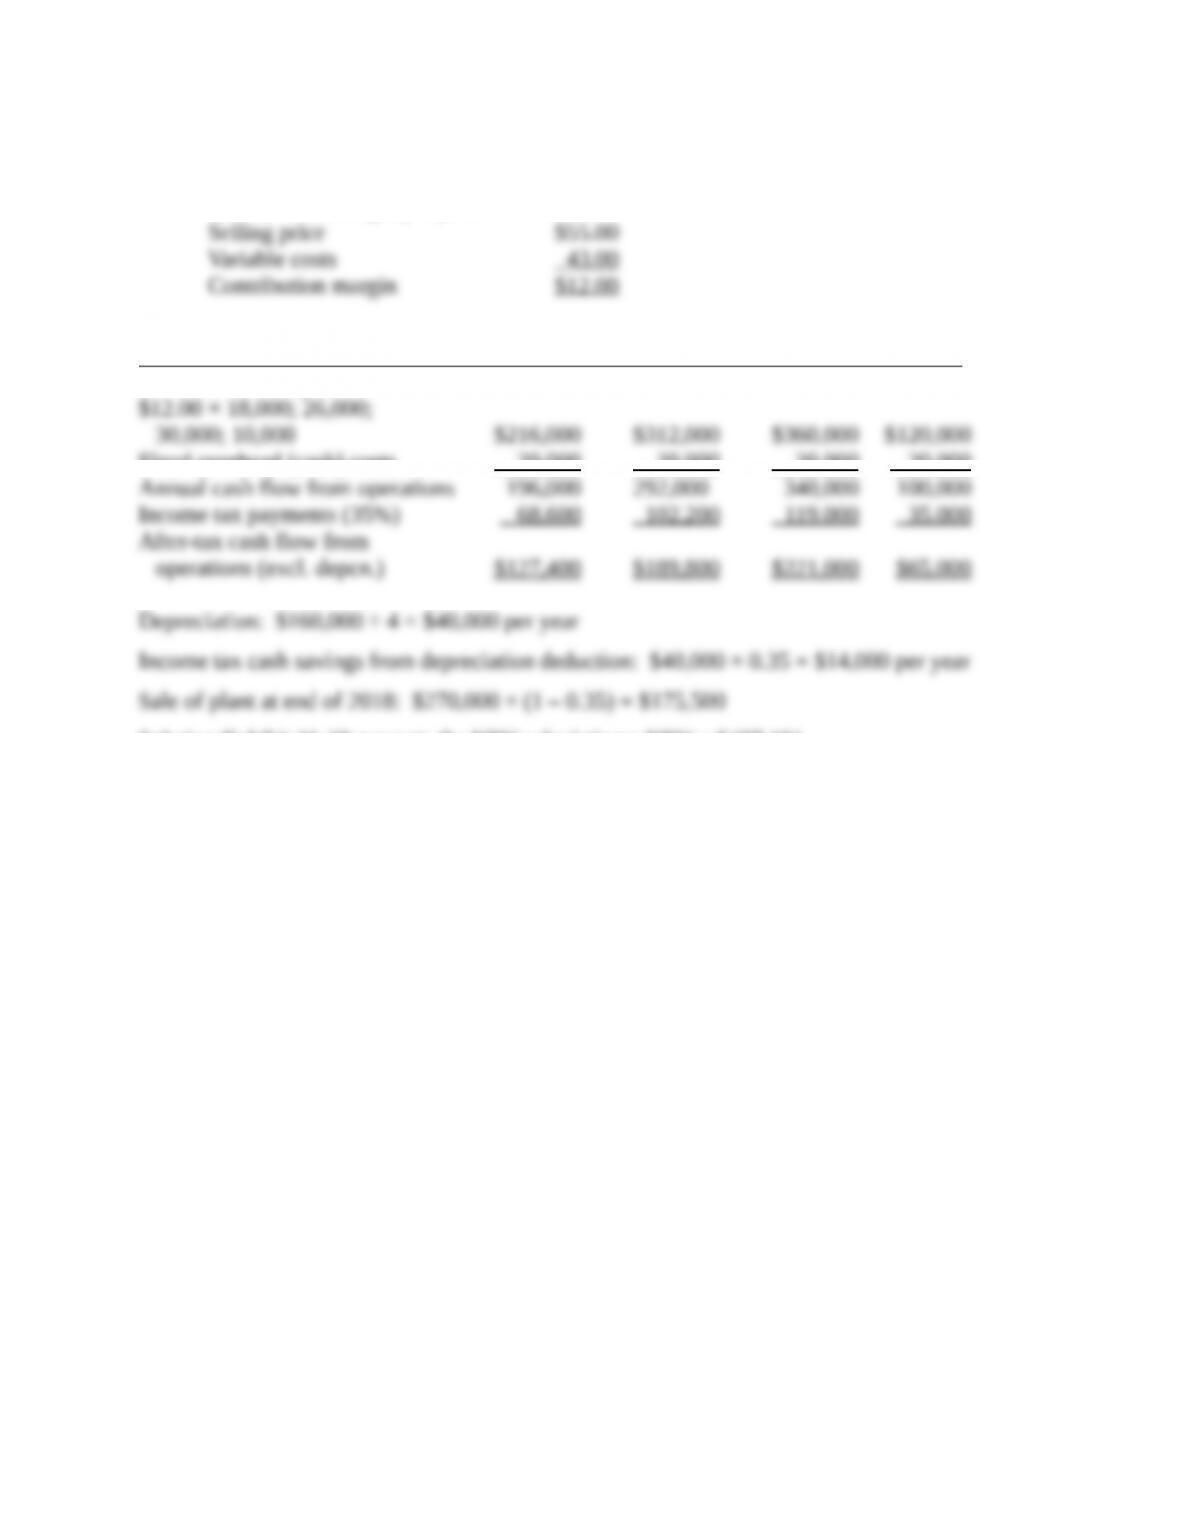
Option 3
Contribution margin per jacket:
Selling price $55.00
Variable costs 43.00
Contribution margin $12.00
2015 2016 2017 2018
Contribution margin
$12.00 × 18,000; 26,000;
30,000; 10,000 $216,000 $312,000 $360,000 $120,000
Fixed overhead (cash) costs 20,000 20,000 20,000 20,000
Annual cash flow from operations 196,000 292,000 340,000 100,000
Income tax payments (35%) 68,600 102,200 119,000 35,000
After-tax cash flow from
operations (excl. depcn.) $127,400 $189,800 $221,000 $65,000
Depreciation: $160,000 ÷ 4 = $40,000 per year
Income tax cash savings from depreciation deduction: $40,000 × 0.35 = $14,000 per year
Sale of plant at end of 2018: $270,000 × (1 – 0.35) = $175,500
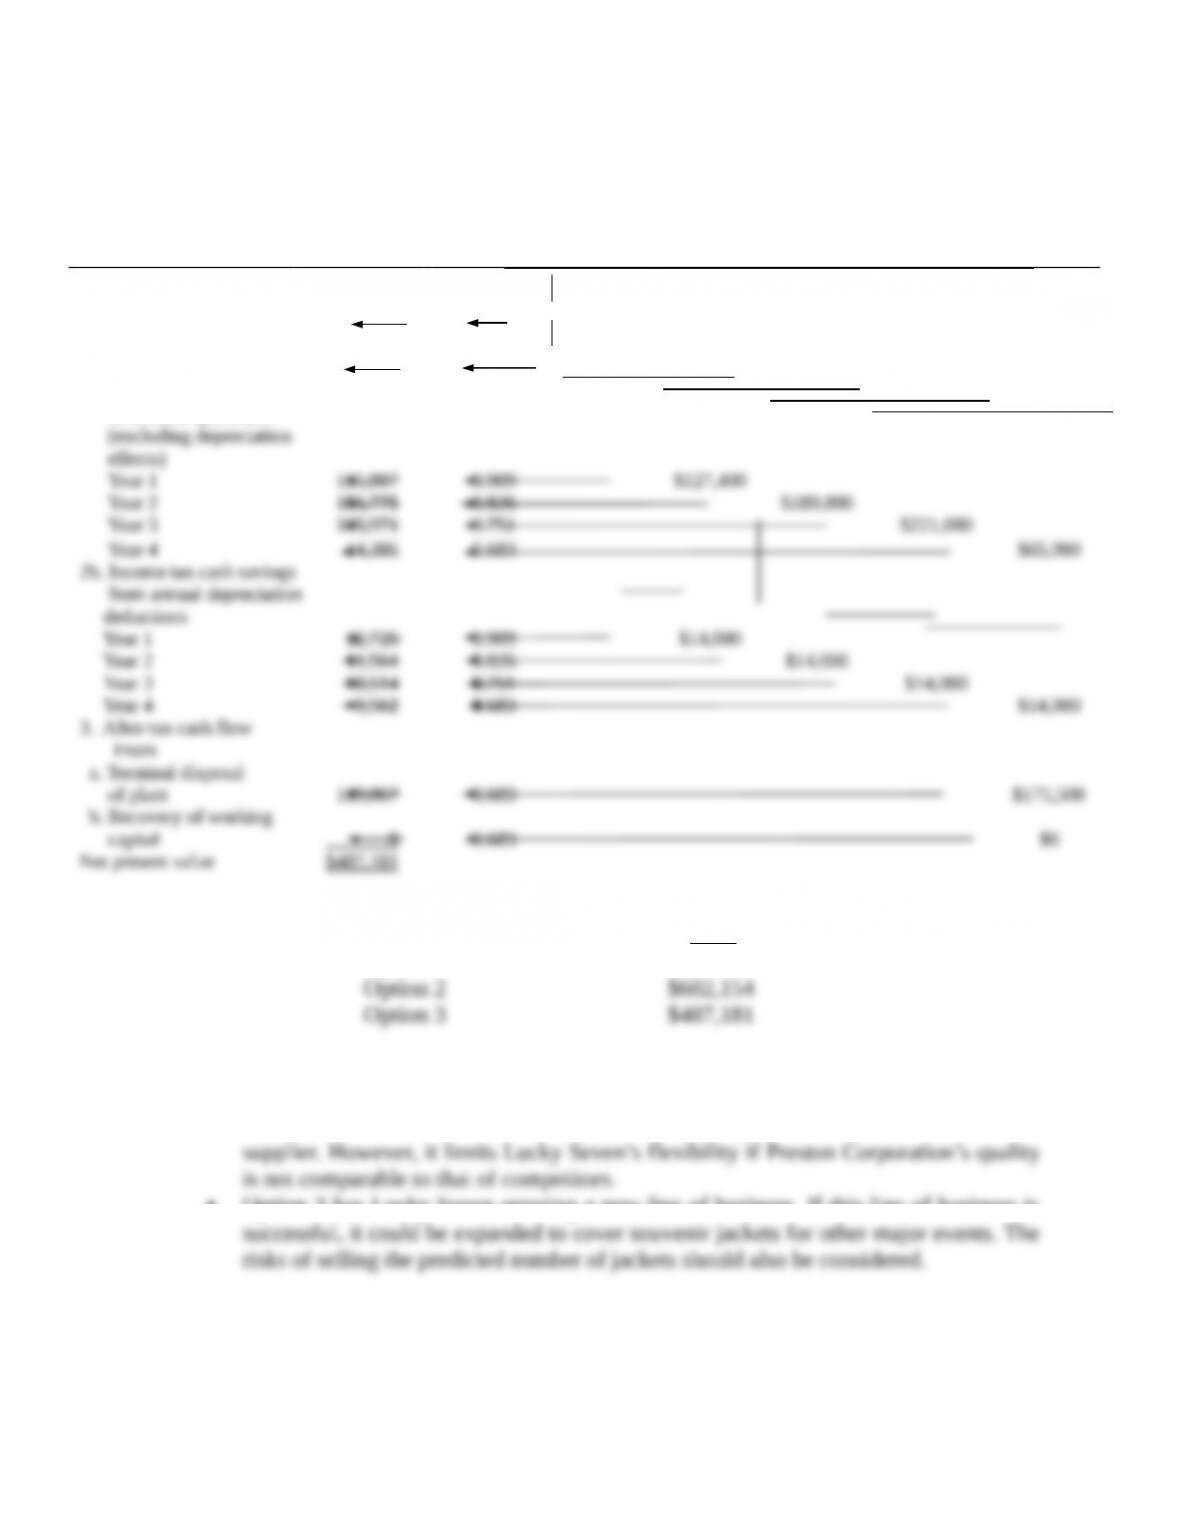
Solution Exhibit 21-28 presents the NPV calculations: NPV = $487,181
21-8
SOLUTION EXHIBIT 21-28
Total
Present
Value
Present Value
Discount
Factors at
10%
Sketch of Relevant After-Tax Cash Flows
2014
2015
2016
2017
2018
1a. Initial plant equipment
upgrade investment
$(160,000)
1.000
$(160,000)
1b. Initial working capital
investment
0
1.000
$0
2a. Annual after-tax cash
flow from operations
(excluding depreciation
effects)
Year 1
115,807
0.909
$127,400
Year 2
156,775
0.826
$189,800
Year 3
165,971
0.751
$221,000
Year 4
44,395
0.683
$65,000
2b. Income tax cash savings
from annual depreciation
deductions
Year 1
12,726
0.909
$14,000
Year 2
11,564
0.826
$14,000
Year 3
10,514
0.751
$14,000
Year 4
9,562
0.683
$14,000
3. After-tax cash flow
From
a. Terminal disposal
of plant
119,867
0.683
$175,500
b. Recovery of working
capital
0
0.683
$0
Net present value
$487,181
Option 2 has the highest NPV:
NPV
Option 1 $585,000
Option 2 $602,154
Option 3 $487,181
2. Nonfinancial factors that Lucky Seven should consider include the following:
• Option 1 gives Lucky Seven immediate liquidity that it can use for other projects.
• Option 2 has the advantage of Lucky Seven having a closer relationship with the
supplier. However, it limits Lucky Seven’s flexibility if Preston Corporation’s quality
is not comparable to that of competitors.
• Option 3 has Lucky Seven entering a new line of business. If this line of business is
successful, it could be expanded to cover souvenir jackets for other major events. The
risks of selling the predicted number of jackets should also be considered.
21-29 (60 min.) Equipment replacement, no income taxes.
21-9
Clean Chips is a manufacturer of prototype chips based in Dublin, Ireland. Next year, in 2015,
Clean Chips expects to deliver 535 prototype chips at an average price of $55,000. Clean Chips’
marketing vice president forecasts growth of 65 prototype chips per year through 2021. That is,
demand will be 535 in 2015, 600 in 2016, 665 in 2017, and so on.
The plant cannot produce more than 525 prototype chips annually. To meet future demand,
Clean Chips must either modernize the plant or replace it. The old equipment is fully depreciated
and can be sold for $4,300,000 if the plant is replaced. If the plant is modernized, the costs to
modernize it are to be capitalized and depreciated over the useful life of the updated plant. The old
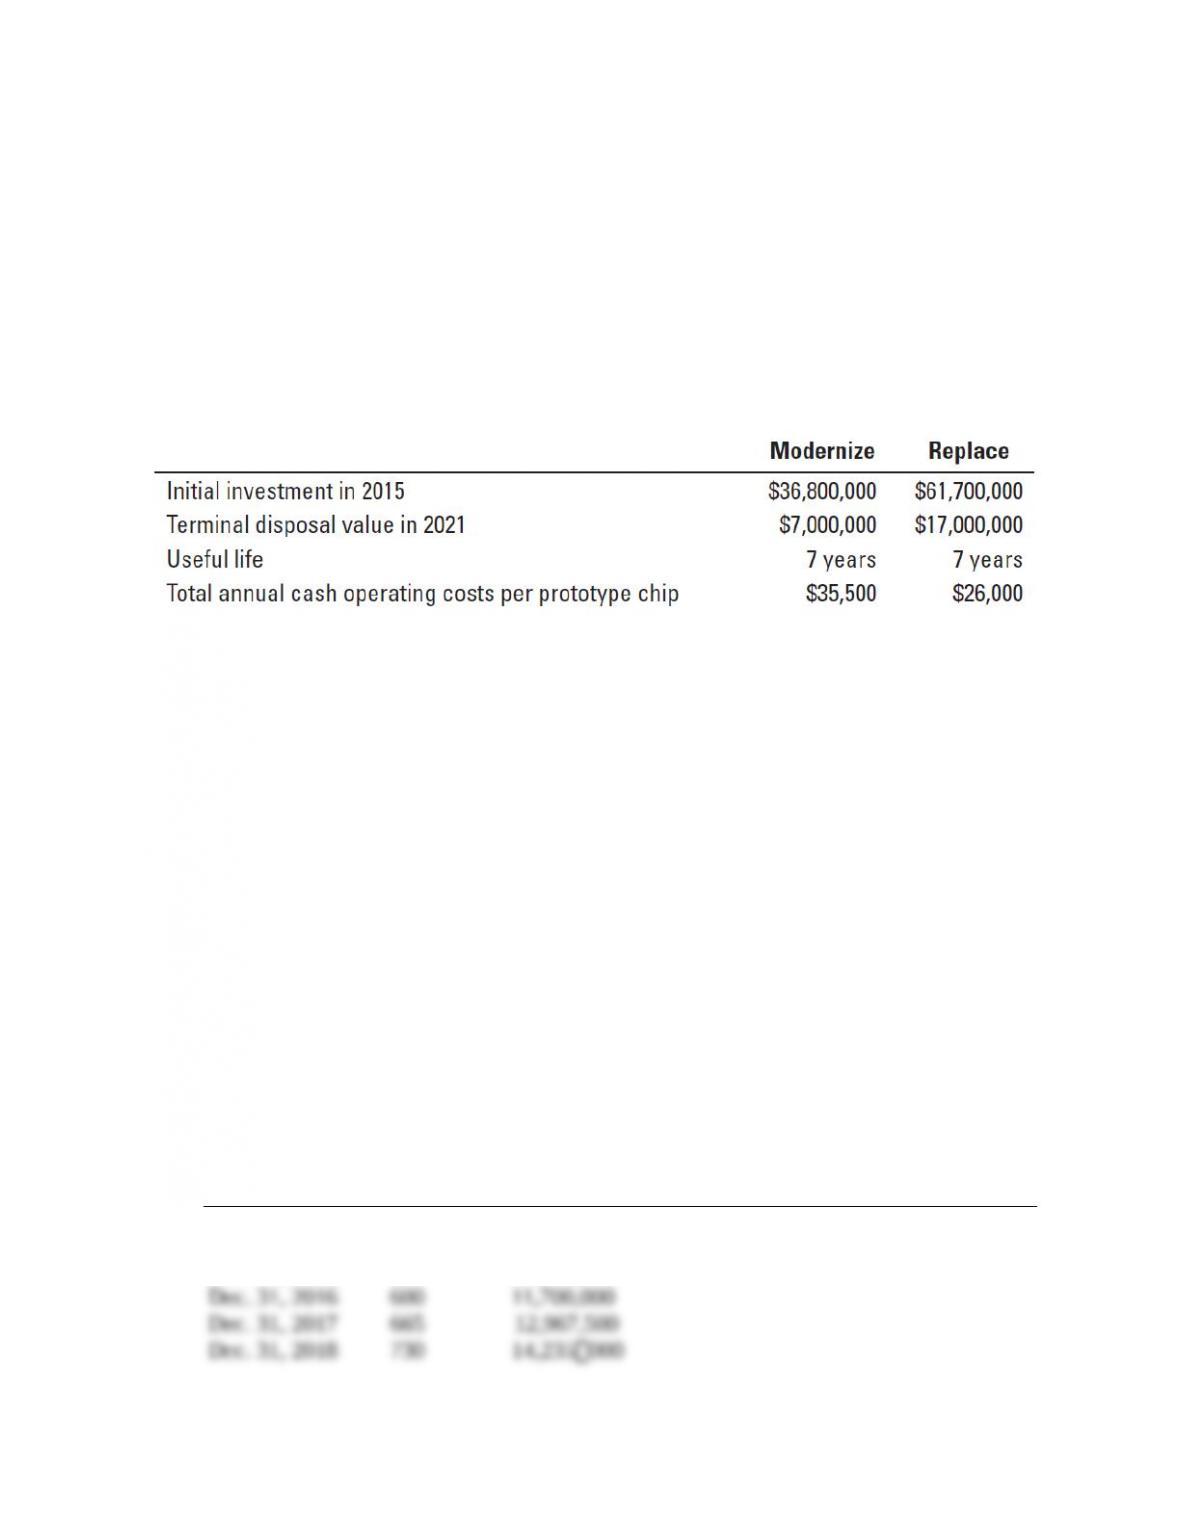
equipment is retained as part of the modernize alternative. The following data on the two options
are available:
Clean Chips uses straight-line depreciation, assuming zero terminal disposal value. For simplicity,
we assume no change in prices or costs in future years. The investment will be made at the
beginning of 2015, and all transactions thereafter occur on the last day of the year. Clean Chips’
required rate of return is 10%.
There is no difference between the modernize and replace alternatives in terms of required
working capital. Clean Chips has a special waiver on income taxes until 2021.
Required:
1. Sketch the cash inflows and outflows of the modernize and replace alternatives over the 2015–
2021 period.
2. Calculate payback period for the modernize and replace alternatives.
3. Calculate net present value of the modernize and replace alternatives.
4. What factors should Clean Chips consider in choosing between the alternatives?
SOLUTION
1. Cash flows for modernizing alternative:
Net Cash Initial Sale of Equip.
Year Units Sold Contributions Investments at Termination
(1) (2) (3) = (2) × $19,500a (4) (5)
Jan. 1, 2015 –– –– $(36,800,000) ––
Dec. 31, 2015 535 $10,432,500
Dec. 31, 2016 600 11,700,000
Dec. 31, 2017 665 12,967,500
Dec. 31, 2018 730 14,235000
21-10
Dec. 31, 2019 795 15,502500
Dec. 31, 2020 860 16,770000
Dec. 31, 2021 925 18,037,500 $7000000
a $55000 – $35,500 = $19,500 cash contribution per prototype.
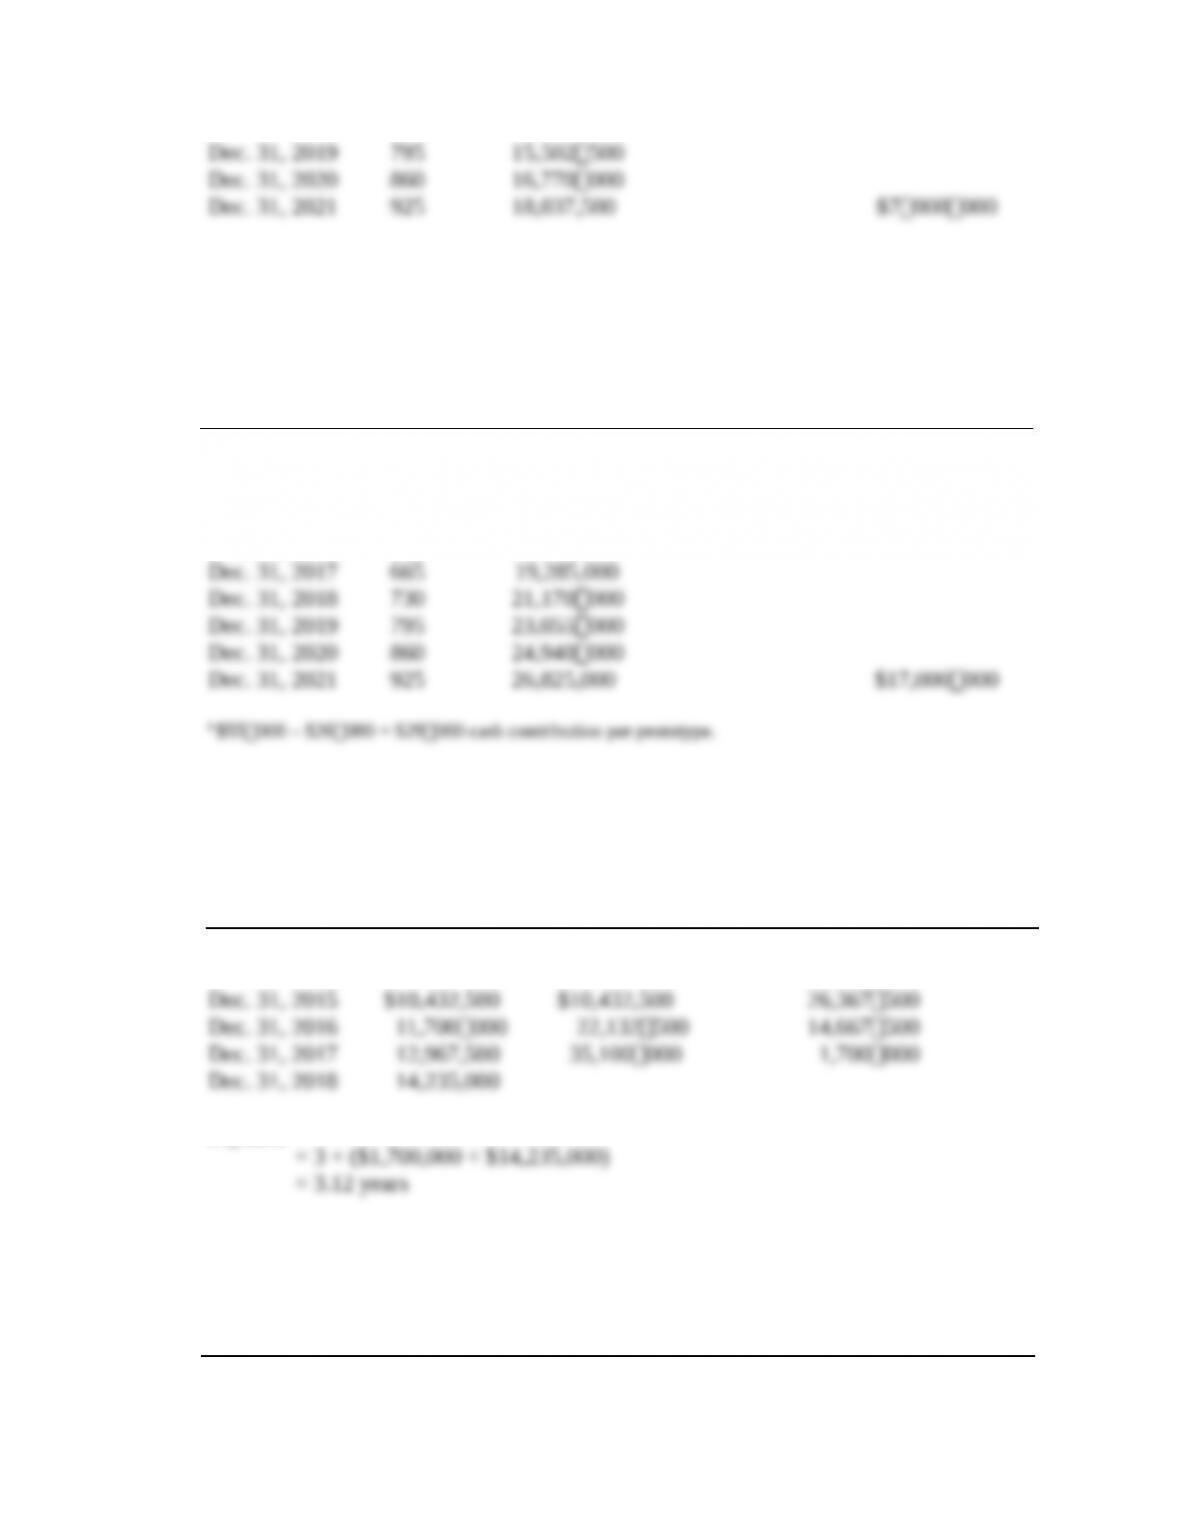
Cash flows for replacement alternative:
Net Cash Initial Sale of Equip.
Year Units Sold Contributions Investments
(1) (2) (3) = (2) × $29,000b (4) (5)
Jan. 1, 2015 –– –– $(61,700,000) $4,300000
Dec. 31, 2015 535 $15,515,000
Dec. 31, 2016 600 17,400,000
Dec. 31, 2017 665 19,285,000
Dec. 31, 2018 730 21,170000
Dec. 31, 2019 795 23,055000
Dec. 31, 2020 860 24,940000
Dec. 31, 2021 925 26,825,000 $17,000000
b $55000 – $26000 = $29000 cash contribution per prototype.
Payback period calculations for modernizing alternative:
Cumulative Net Initial Investment
Year Cash Inflow Cash Inflow Unrecovered at End of Year
(1) (2) (3) (4)
Jan. 1, 2015 –– –– $36,800,000
Dec. 31, 2015 $10,432,500 $10,432,500 26,367500
Dec. 31, 2016 11,700000 22,132500 14,667500
Dec. 31, 2017 12,967,500 35,100000 1,700000
Dec. 31, 2018 14,235,000
Payback = 3 + ($1,700,000 ÷ $14,235,000)
= 3.12 years
Payback period calculations for replace alternative:
Cumulative Net Initial Investment
Year Cash Inflow Cash Inflow Unrecovered at End of Year
(1) (2) (3) (4)
Jan. 1, 2015 –– –– $57,400,000
21-11
Dec. 31, 2015 $15,515000 $15,515000 41,885000
Dec. 31, 2016 17,400000 32,915000 24,485000
Dec. 31, 2017 19,285000 52,200000 5,200000
Dec. 31, 2018 21,170000
Payback = 3 + ($5,200,000 ÷ $21,170,000)
= 3.25 years


