15-1
15-28 (20 min.) Revenue allocation
Yang Inc. produces and sells DVDs to business people and students who are planning extended
stays in China. It has been very successful with two DVDs: Beginning Mandarin and
Conversational Mandarin. It is introducing a third DVD, Reading Chinese Characters. It has
decided to market its new DVD in two different packages grouping the Reading Chinese
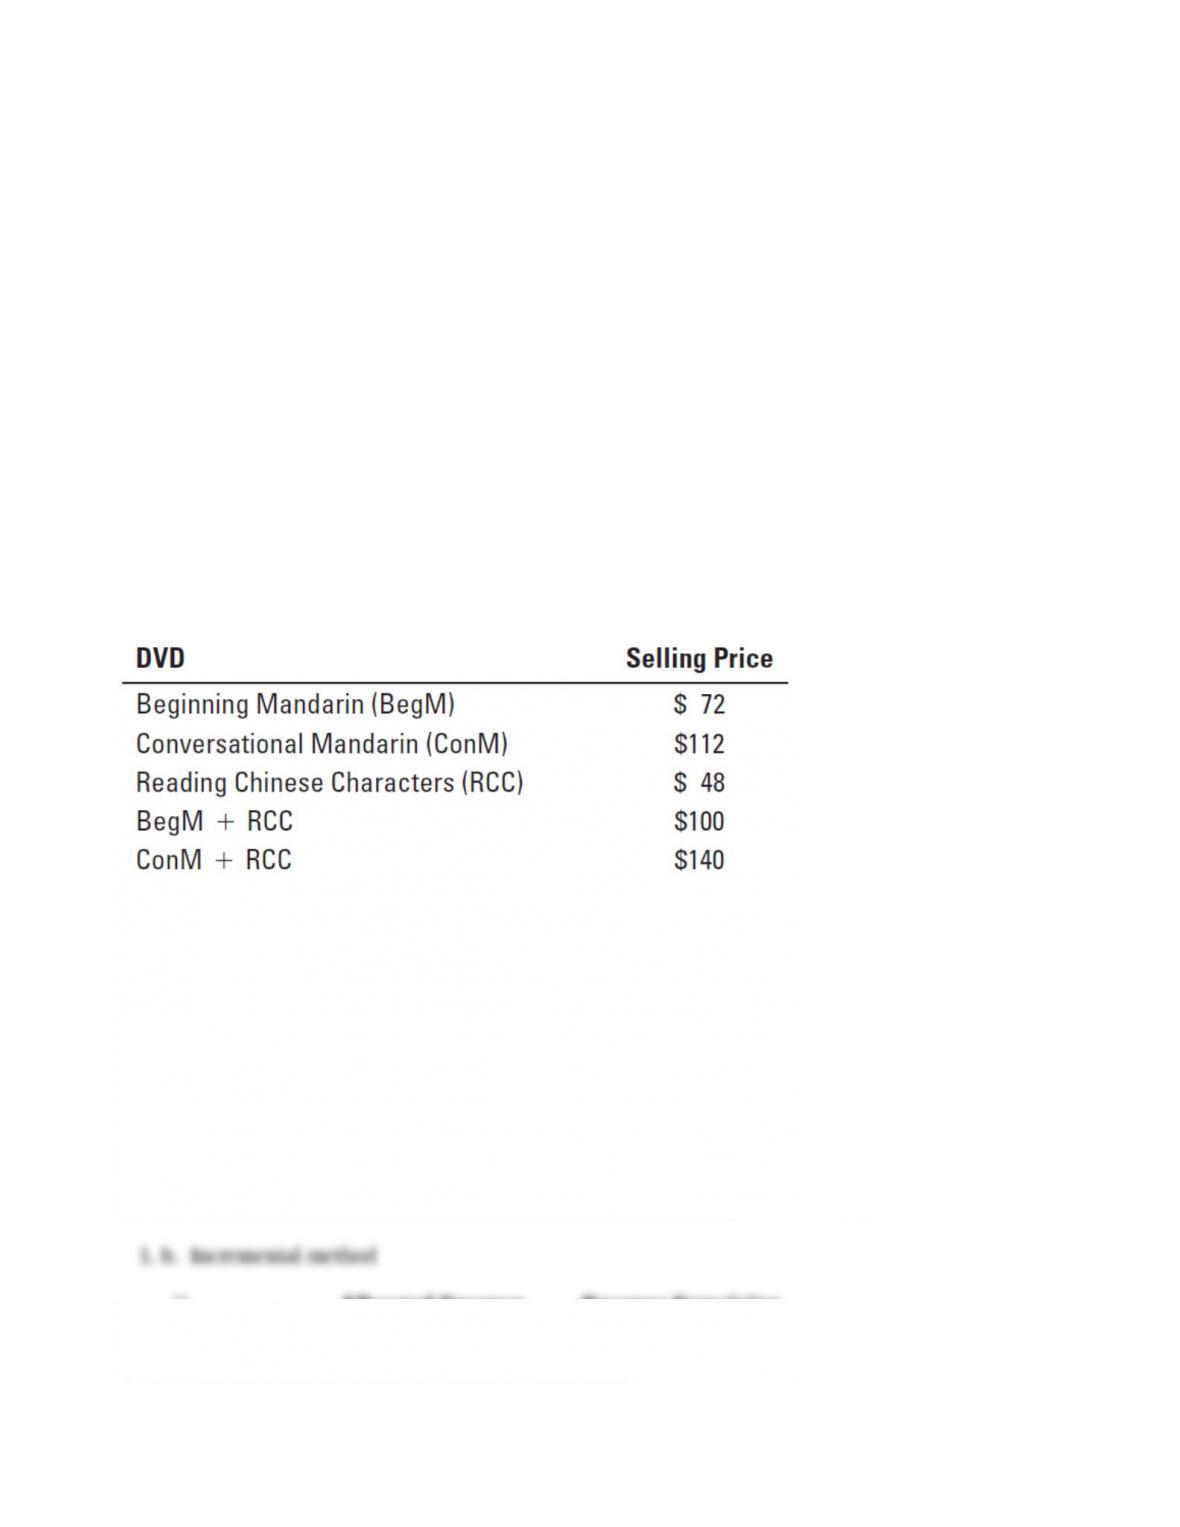
Characters DVD with each of the other two language DVDs. Information about the separate DVDs
and the packages follow.
Required:
1. Using the selling prices, allocate revenues from the BegM + RCC package to each DVD in
that package using (a) the stand-alone method; (b) the incremental method, in either order; and
(c) the Shapley value method.
2. Using the selling prices, allocate revenues from the ConM + RCC package to each DVD in
that package using (a) the stand-alone method; (b) the incremental method, in either order; and
(c) the Shapley value method.
3. Which method is most appropriate for allocating revenues among the DVDs? Why?
SOLUTION
1. a. Stand-alone method for the BegM + RCC package
DVD
(1)
Separate
Revenue
(2)
Percentage
(3) = (2) ÷ $120
Joint
Revenue
(4)
Allocation
(5) = (3) × (4)
BegM $ 72 $72 ÷ $120=0.60 $100 $ 60
RCC 48 $48 ÷ $120=0.40 100 40
$120 $100
1. b. Incremental method
i)
Allocated Revenue
Revenue Remaining
(BegM first)
To Allocate
BegM $72 $28 ($100 ─ $72)
15-2
RCC 28
ii)
Allocated Revenue
Revenue Remaining
(RCC first)
To Allocate
RCC $48 $52 ($100 ─ $48)
BegM 52
1. c. Shapley method (assuming each DVD is demanded in equal proportion)
i) BegM ($72 + $52) ÷ 2 = $62
ii) RCC ($48 + $28) ÷ 2 = $38
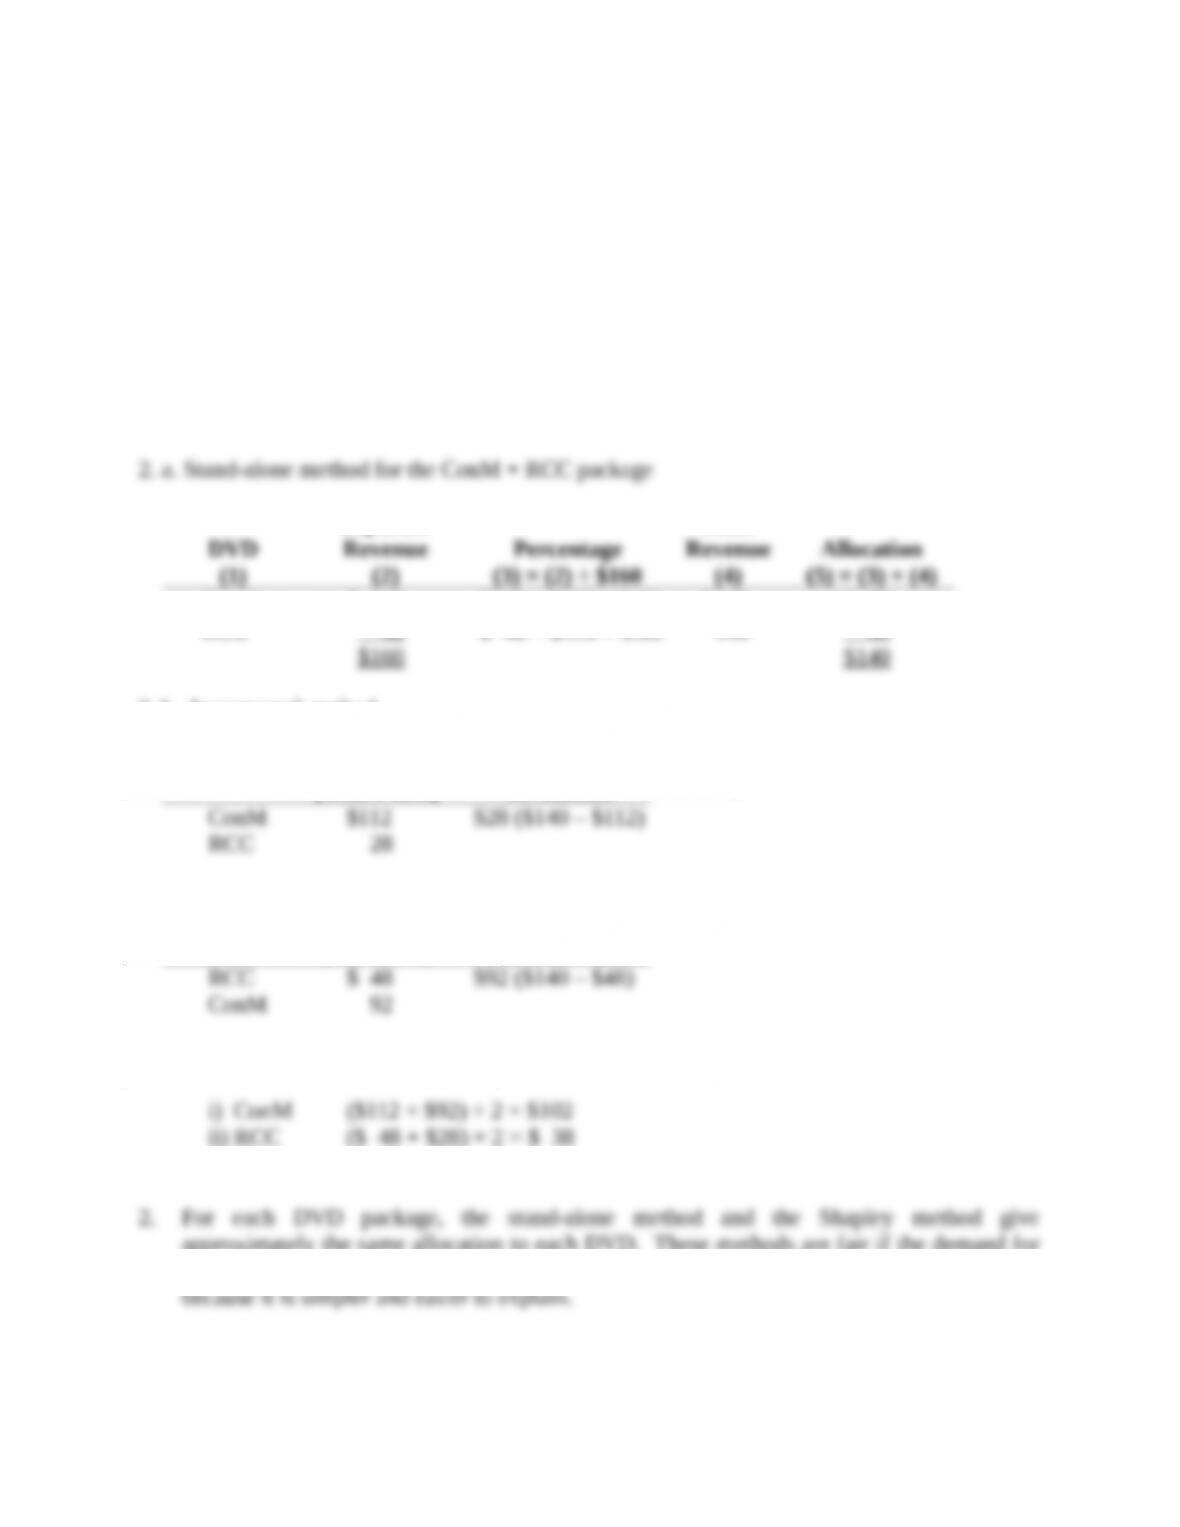
2. a. Stand-alone method for the ConM + RCC package
DVD
(1)
Separate
Revenue
(2)
Percentage
(3) = (2) ÷ $160
Joint
Revenue
(4)
Allocation
(5) = (3) × (4)
ConM $ 112 $112 ÷ $120 = 0.70 $140 $ 98
RCC 48 $ 48 ÷ $120 = 0.30 140 42
$160 $140
2. b. Incremental method
i)
Allocated
Revenue
(ConM first)
Revenue
Remaining
To Allocate
ConM $112 $28 ($140 – $112)
RCC 28
ii)
Allocated
Revenue
(RCC first)
Revenue
Remaining
To Allocate
RCC $ 48 $92 ($140 – $48)
ConM 92
2. c. Shapley method (assuming each DVD is demanded in equal proportion)
i) ConM ($112 + $92) ÷ 2 = $102
ii) RCC ($ 48 + $28) ÷ 2 = $ 38
2. For each DVD package, the stand-alone method and the Shapley method give approximately
the same allocation to each DVD. These methods are fair if the demand for the DVDs is
approximately equal. The stand-alone method might be slightly preferable here because it is
simpler and easier to explain.
15-3
The incremental method would be appropriate if one DVD has a higher level of demand than
the other DVD. In this situation, the dominant DVD would be sold anyway, so it should
receive its stand-alone revenue, and the other DVD should receive the remainder.
15-29 (20 min.) Fixed cost allocation.
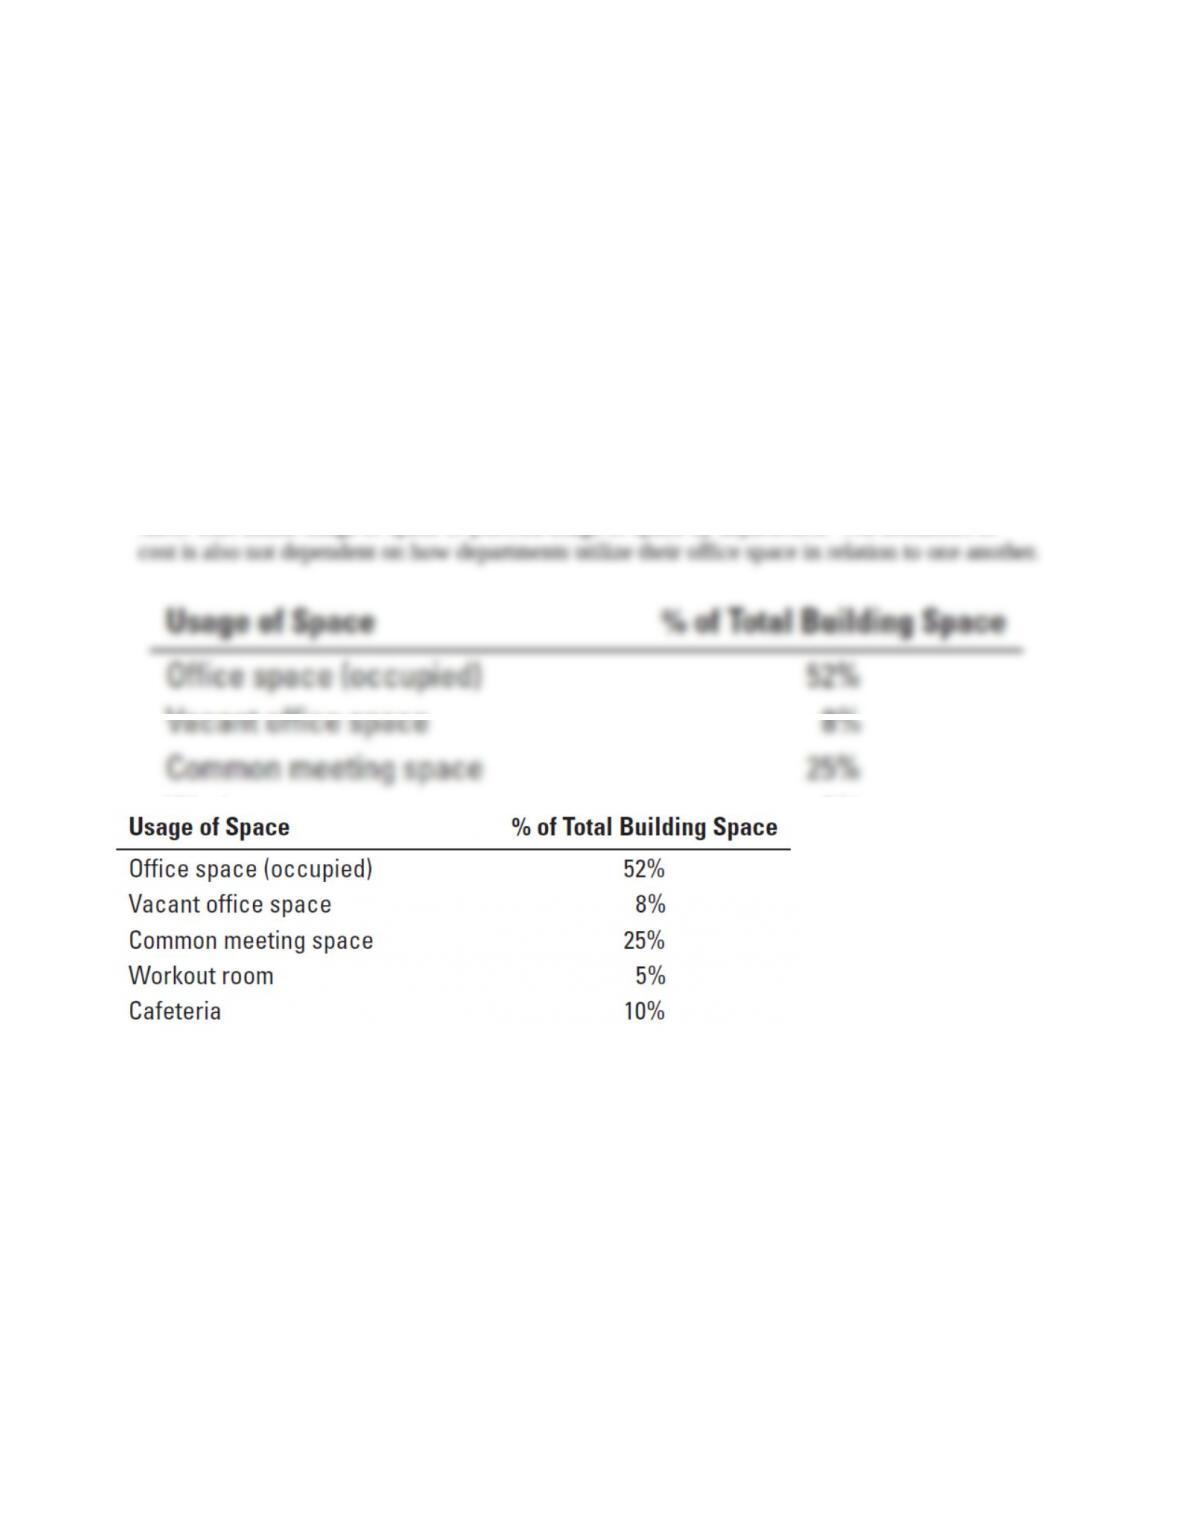
Baker University completed construction of its newest administrative building at the end of 2013.
The University’s first employees moved into the building on January 1, 2014. The building
consists of office space, common meeting rooms (including a conference center), a cafeteria, and
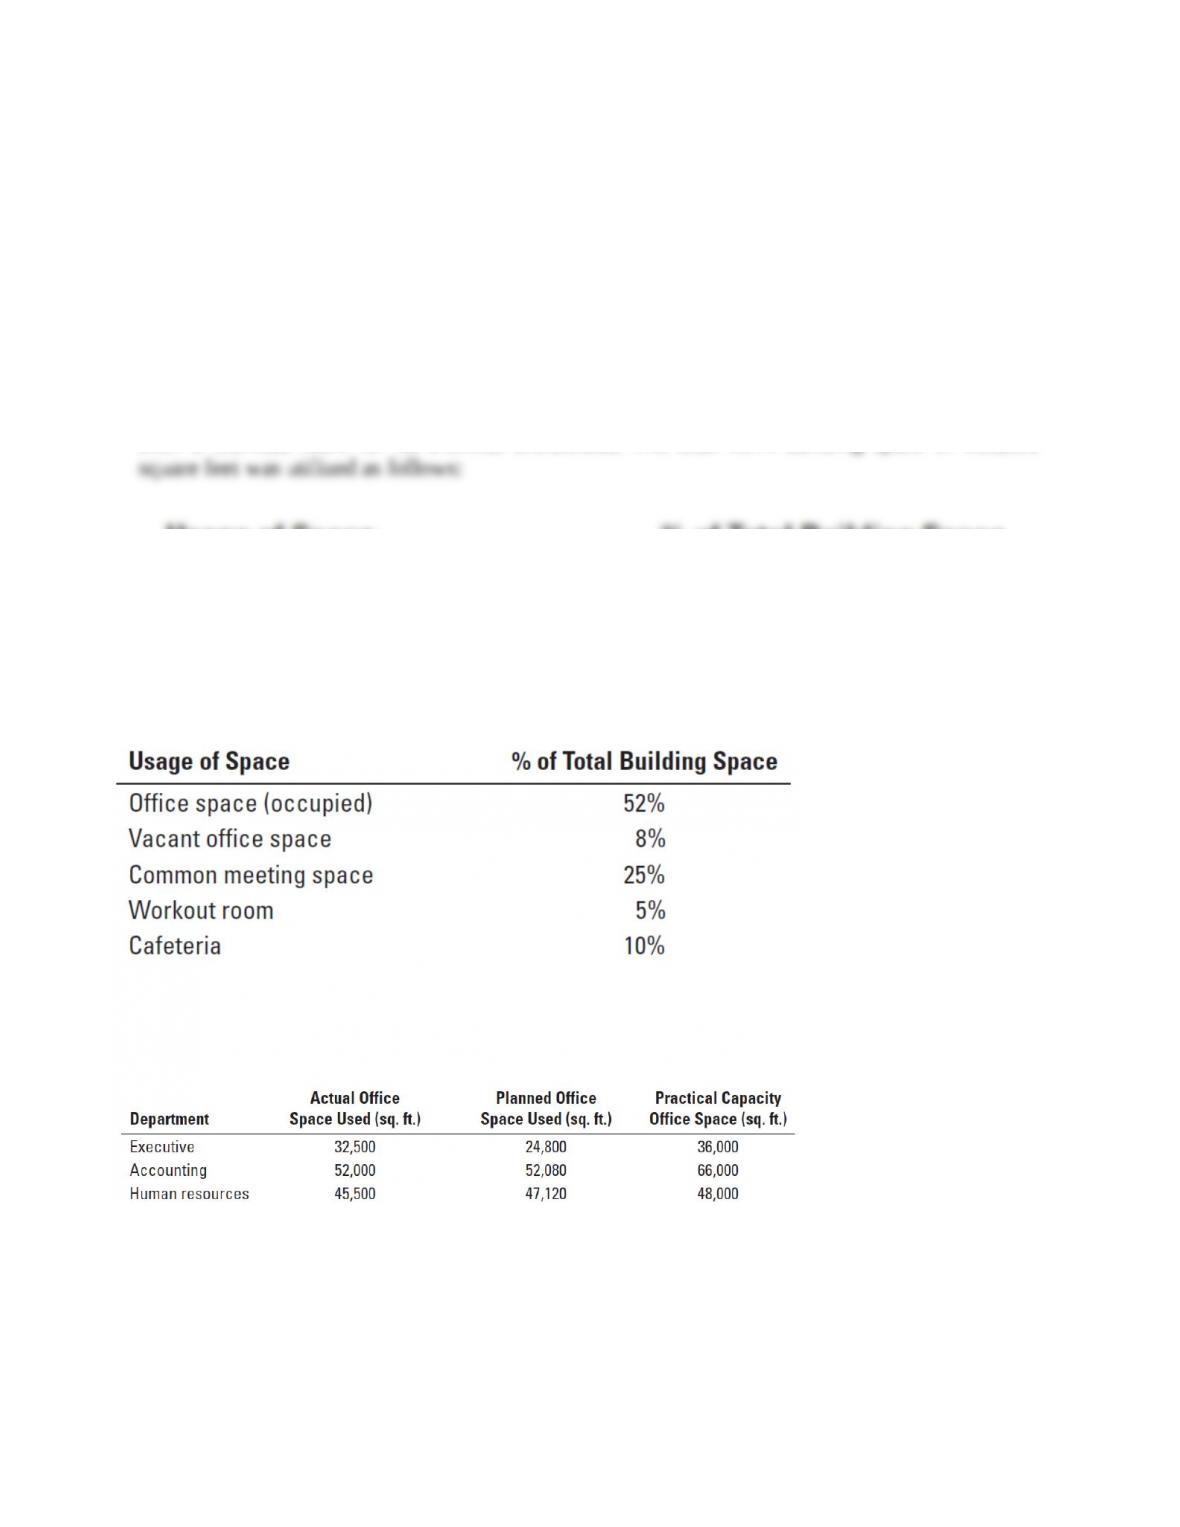
even a workout room for its exercise enthusiasts. The total 2014 building space of 250,000 square
feet was utilized as follows:
The new building cost the university $60 million and was depreciated using the straight-line
method over 20 years. At the end of 2014 three departments occupied the building: executive
offices of the president, accounting, and human resources. Each department’s usage of its assigned
space was as follows:
Required:
1. How much of the total building cost will be allocated in 2014 to each of the departments, if the
total cost is allocated to each department on the basis of the following?
a. Actual usage of the three departments
b. Planned usage of the three departments
c. Practical capacity of the three departments
2. Assume that Baker University allocates the total annual building cost in the following manner:
a. All vacant office space is absorbed by the university and is not allocated to the departments.
b. All occupied office space costs are allocated on the basis of actual square footage used.
c. All common area costs are allocated on the basis of a department’s practical capacity.
Calculate the cost allocated to each department in 2014 under this plan. Do you think the
allocation method used here is appropriate? Explain.
SOLUTION
1. i) Allocation using actual usage.
Department
(1)
Actual
Usage
(2)
Percentage of
Total Usage
(3) = (2) ÷ 130,000
Allocation
(4) = (3) × $3,000,000a
Executive
32,500
0.25
$ 750,000
Accounting
52,000
0.40
1,200,000
Human Resources
45,500
0.35
1,050,000
Total
130,000
$3,000,000
a$60,000,000 building cost/20 years straight-line depreciation = $3,000,000 annual depreciation
expense related to building.
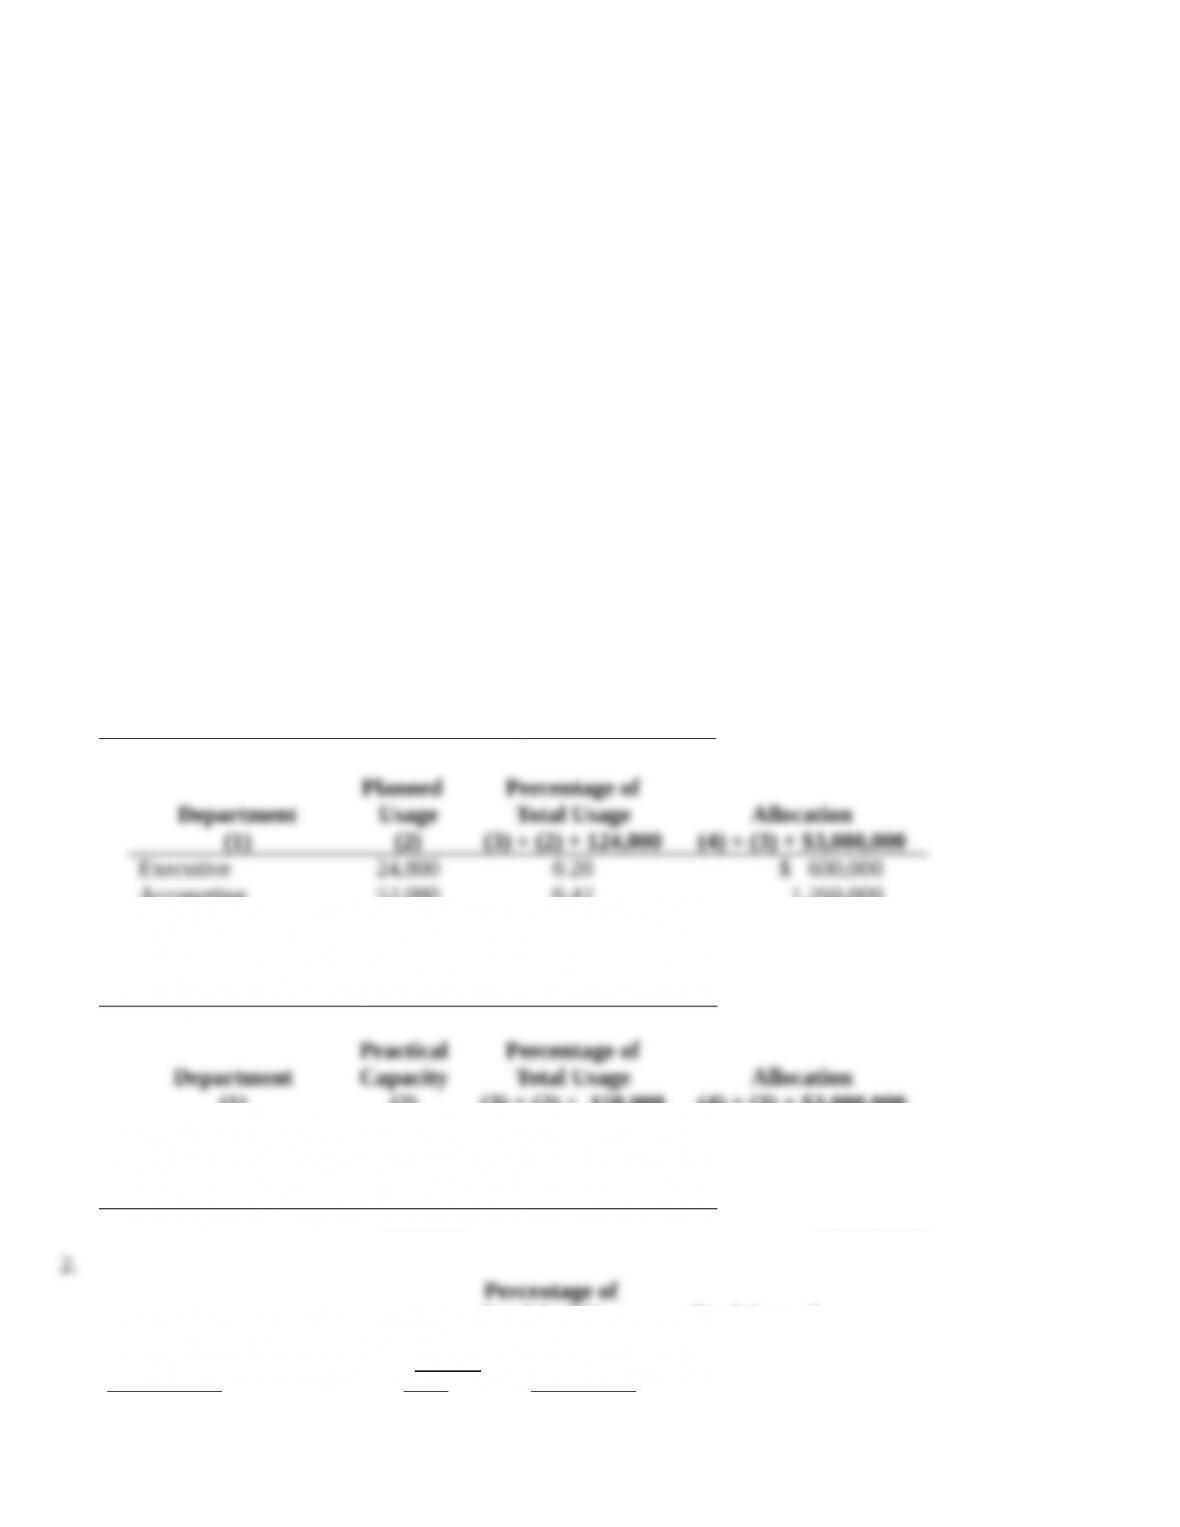
ii) Allocation using planned usage.
Department
(1)
Planned
Usage
(2)
Percentage of
Total Usage
(3) = (2) ÷ 124,000
Allocation
(4) = (3) × $3,000,000
Executive
24,800
0.20
$ 600,000
Accounting
52,080
0.42
1,260,000
Human Resources
47,120
0.38
1,140,000
Total
124,000
$3,000,000
iii) Allocation using practical capacity.
Department
(1)
Practical
Capacity
(2)
Percentage of
Total Usage
(3) = (2) ÷ 150,000
Allocation
(4) = (3) × $3,000,000
Executive
36,000
0.24
$ 720,000
Accounting
66,000
0.44
1,320,000
Human Resources
48,000
0.32
960,000
Total
150,000
$3,000,000
2.
Usage of Space
Percentage of
Total Building
Space
Total Annual
Building Cost
Office Space (occupied)
52%
$1,560,000
Vacant Office Space
8%
240,000
Common Meeting Space
25%
750,000
Workout Room
5%
150,000
15-5
Cafeteria
10%
300,000
Total 100% $3,000,000
a) $240,000 of Vacant Office Space cost will not be allocated to the departments but will be
absorbed by the university’s central administration.
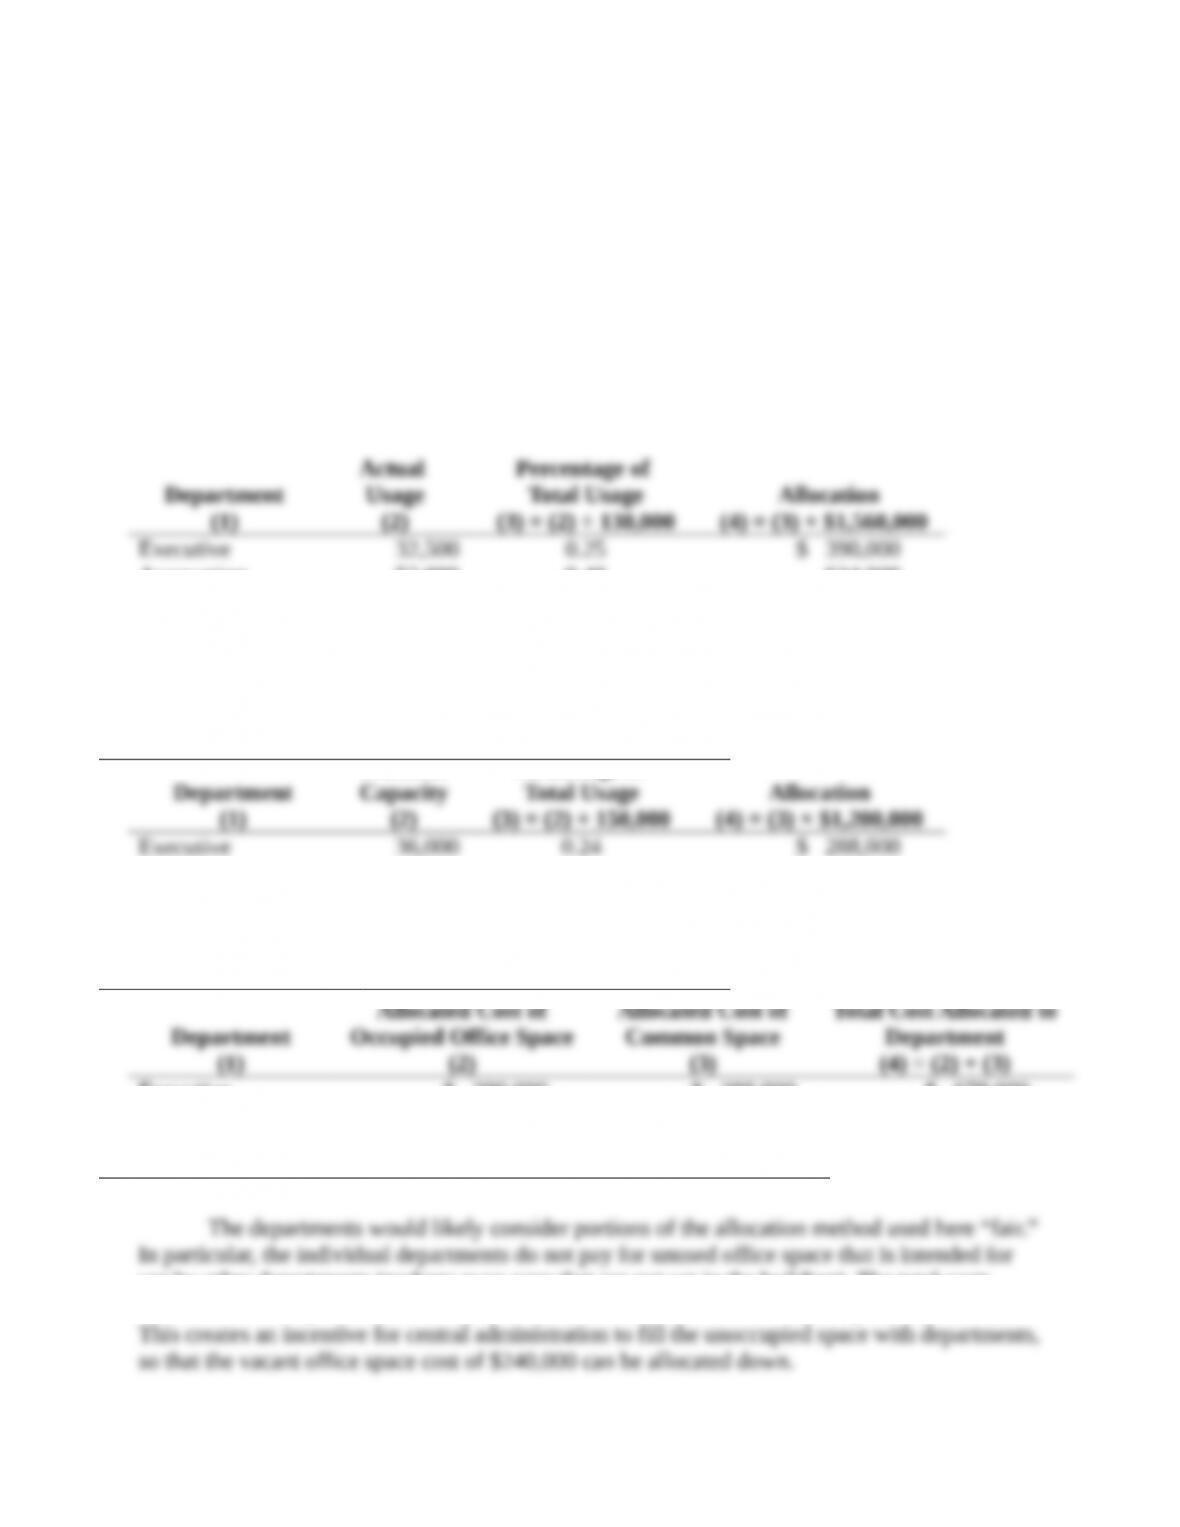
b) Allocation of Office Space (occupied) costs ($1,560,000) using actual usage.
Department
(1)
Actual
Usage
(2)
Percentage of
Total Usage
(3) = (2) ÷ 130,000
Allocation
(4) = (3) × $1,560,000
Executive
32,500
0.25
$ 390,000
Accounting
52,000
0.40
624,000
Human Resources
45,500
0.35
546,000
Total
130,000
$1,560,000
c) Allocation of all common space cost ($750,000 + $150,000 + $300,000 = $1,200,000)
using practical capacity.
Department
(1)
Practical
Capacity
(2)
Percentage of
Total Usage
(3) = (2) ÷ 150,000
Allocation
(4) = (3) × $1,200,000
Executive
36,000
0.24
$ 288,000
Accounting
66,000
0.44
528,000
Human Resources
48,000
0.32
384,000
Total
150,000
$1,200,000
Department
(1)
Allocated Cost of
Occupied Office Space
(2)
Allocated Cost of
Common Space
(3)
Total Cost Allocated
to Department
(4) = (2) + (3)
Executive
$ 390,000
$ 288,000
$ 678,000
Accounting
624,000
528,000
1,152,000
Human Resources
546,000
384,000
930,000
Total
$1,560,000
$1,200,000
$2,760,000
The departments would likely consider portions of the allocation method used here “fair.”
In particular, the individual departments do not pay for unused office space that is intended for
use by other departments (perhaps even ones that are not yet in the building). The total costs
allocated to the departments is $2,760,000 ($3,000,000 – the cost of vacant space, $240,000).
This creates an incentive for central administration to fill the unoccupied space with departments,
so that the vacant office space cost of $240,000 can be allocated down.
As for the allocation of occupied office space costs, it may have been more appropriate to
allocate this based on relative practical capacity rather than actual usage by department. The
current system does not appropriately consider that the building was constructed based on the
15-6
practical capacity intended to be dedicated to each department. As a result, departments who are
taking up less space than originally assigned to them are not penalized for this. Moreover, the
assignment of the cost will change year to year under the present system, depending on that
period’s relative use of space by all departments, while a practical capacity-based system would
yield stable cost allocations. If, as a result of changed circumstances, a department will not be
utilizing the practical capacity initially assigned to it, Baker University’s president might choose
to house another department in the building. The university would then assign the cost of the
building based on the practical capacities assigned to all the departments in the building,
including the practical capacity assigned to the new department.
Finally, allocating the common space cost based on practical capacity is the most
equitable method because the allocation of cost is based on “assigned space” by department
rather than actual usage of space or planned usage of space by department. The allocation of
cost is also not dependent on how departments utilize their office space in relation to one
another.
15-7
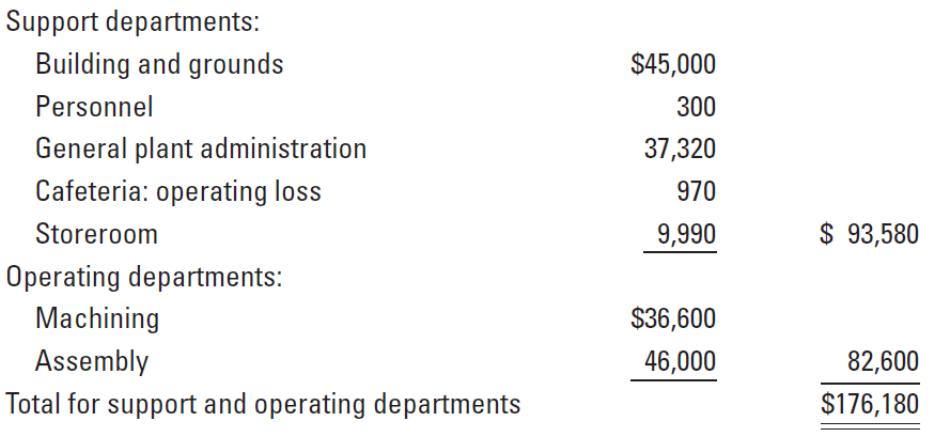
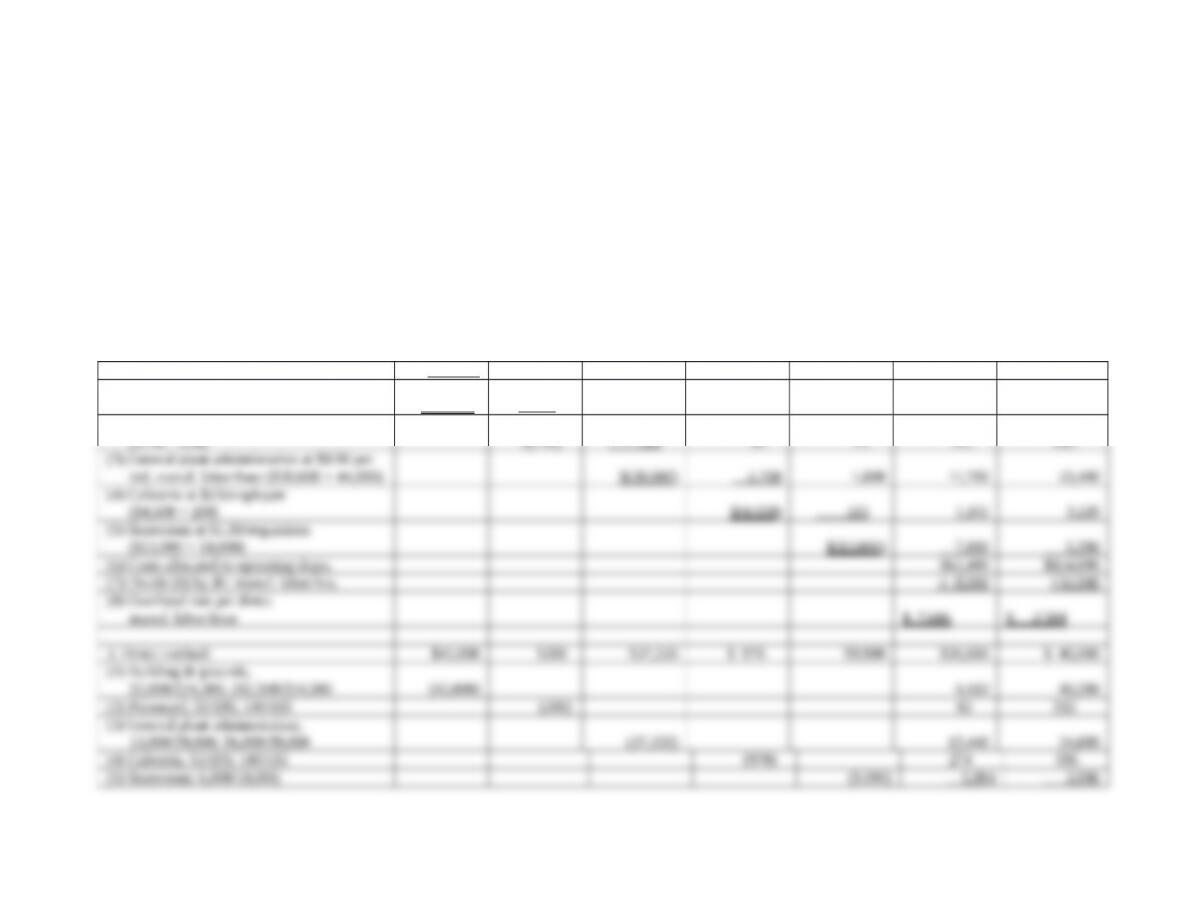
15-30 (45 min.) Allocating costs of support departments; step-down and direct methods.
The Central Valley Company has prepared department overhead budgets for budgeted-volume levels before allocations as follows:
Management has decided that the most appropriate inventory costs are achieved by using individual-department overhead rates. These
rates are developed after support-department costs are allocated to operating departments.
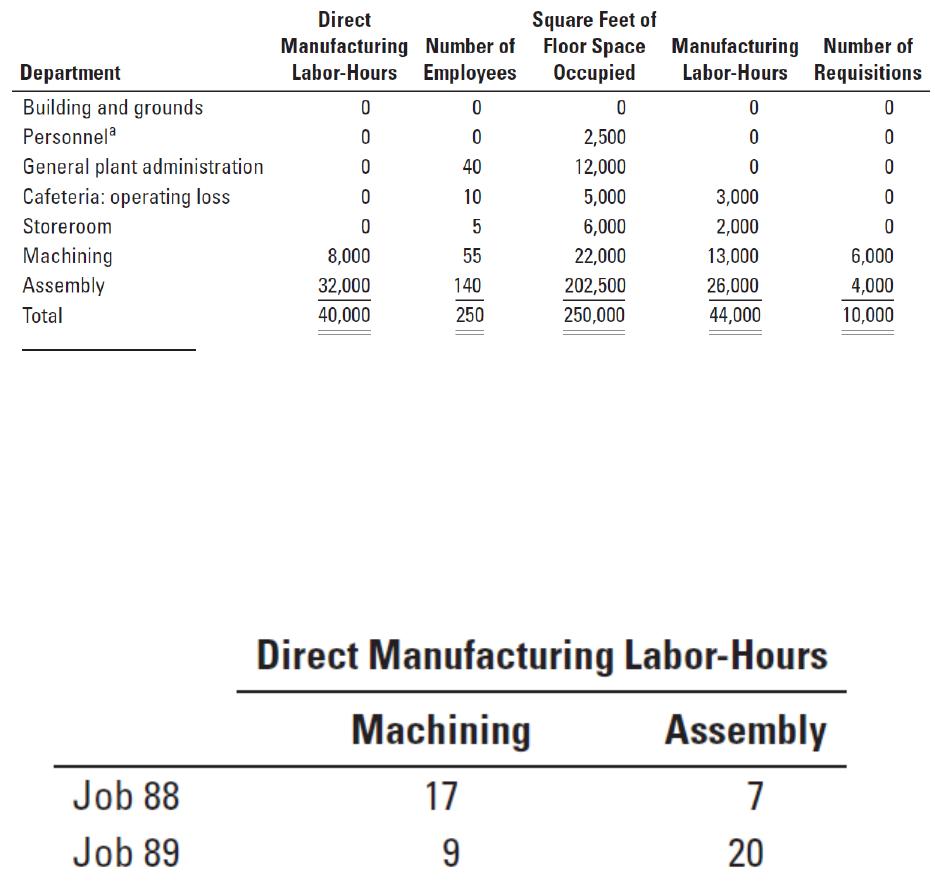
Bases for allocation are to be selected from the following:
15-8
aBasis used is number of employees.
Required:
1. Using the step-down method, allocate support-department costs. Develop overhead rates per direct manufacturing labor-hour for
machining and assembly. Allocate the costs of the support departments in the order given in this problem. Use the allocation base
for each support department you think is most appropriate.
2. Using the direct method, rework requirement 1.
3. Based on the following information about two jobs, determine the total overhead costs for each job by using rates developed in (a)
requirement 1 and (b) requirement 2.
4. The company evaluates the performance of the operating department managers on the basis of how well they managed their total
costs, including allocated costs. As the manager of the Machining Department, which allocation method would you prefer from the
results obtained in requirements 1 and 2? Explain.
SOLUTION
In some print editions of the book, the column heading for the fifth column appears as “Manufacturing Labor–Hours.” The
column heading should be “Indirect Manufacturing Labor–Hours” instead of “Manufacturing Labor–Hours.” Indirect
Manufacturing Labor-Hours are used to allocate general plant administration costs to departments.
Building &
Grounds
Personnel
General
Plant Admin.
Cafeteria
Operating
Loss
Storeroom
Machining
Assembly
1. Step-down Method:
$ 45,000
$ 300
$ 37,320
$ 970
$ 9,990
$36,600
$ 46,000
(1) Building & grounds at $0.18/sq.ft.
($45,000 ÷ 250,000)
$(45,000)
450
2,160
900
1,080
3,960
36,450
(2) Personnel at $3/employee
($750 ÷ 250)
$(750)
120
30
15
165
420
(3) General plant administration at $0.90 per
ind. manuf. labor-hour ($39,600 ÷ 44,000)
$(39,600)
2,700
1,800
11,700
23,400
(4) Cafeteria at $23/employee
($4,600 ÷ 200)
$(4,600)
115
1,265
3,220
(5) Storeroom at $1.30/requisition
($13,000 ÷ 10,000)
$(13,000)
7,800
5,200
(6) Costs allocated to operating depts.
$61,490
$114,690
(7) Divide (6) by dir. manuf. labor-hrs.
÷ 8,000
÷32,000
(8) Overhead rate per direct
manuf. labor-hour
$ 7.686
$ 3.584
2. Direct method:
$45,000
$300
$37,320
$ 970
$9,990
$36,600
$ 46,000
(1) Building & grounds,
22,000/224,500; 202,500/224,500
(45,000)
4,410
40,590
(2) Personnel, 55/195; 140/195
(300)
85
215
(3) General plant administration,
13,000/39,000; 26,000/39,000
(37,320)
12,440
24,880
(4) Cafeteria, 55/195; 140/195
(970)
274
696
(5) Storeroom: 6,000/10,000;
4,000/10,000
(9,990)
5,994
3,996
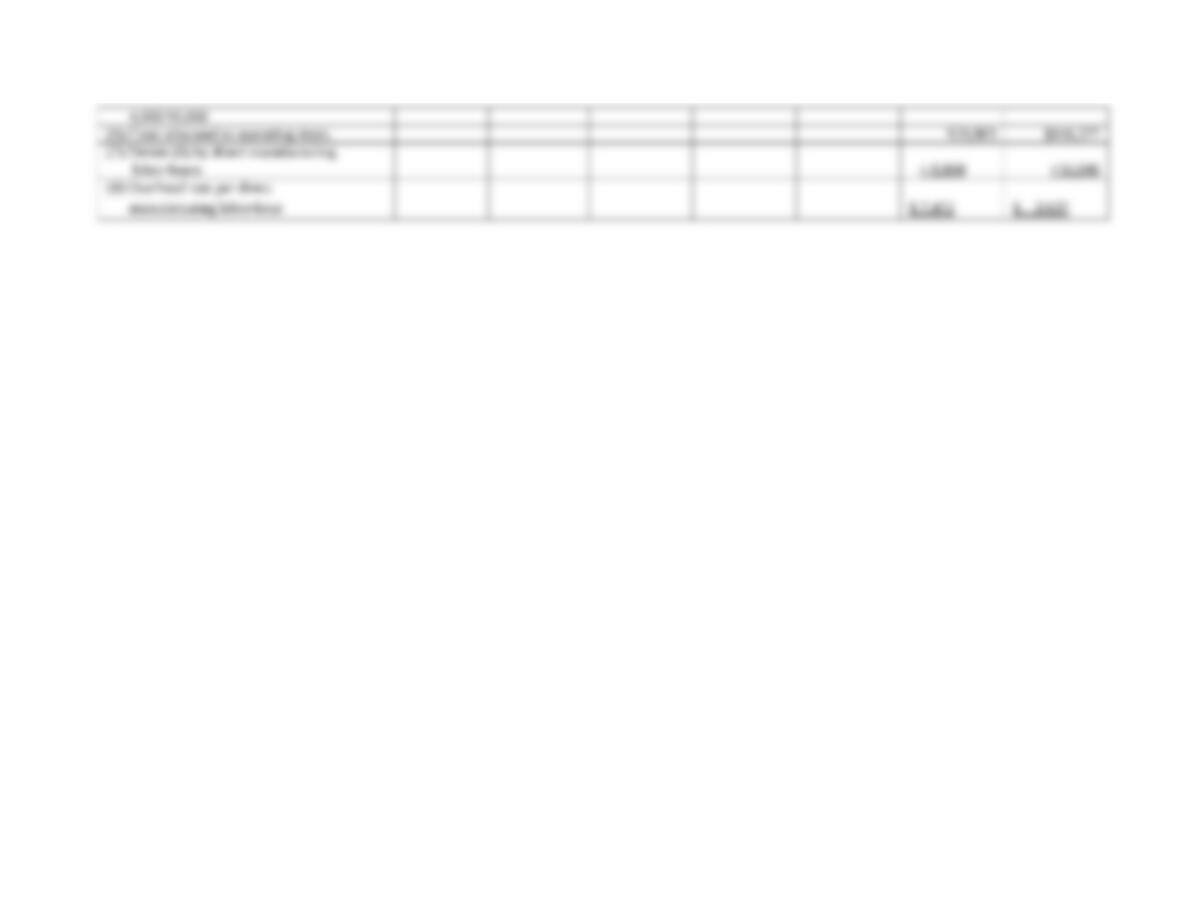
(6) Costs allocated to operating depts.
$59,803
$116,377
(7) Divide (6) by direct manufacturing
labor-hours
÷ 8,000
÷32,000
(8) Overhead rate per direct
manufacturing labor-hour
$ 7.475
$ 3.637
15-11