15-1
SOLUTION
In some print editions of the book, requirement 1 states the airfare to be $1,600. The airfare
in requirement 1 should be $1,200 instead of $1,600.
1. Alternative approaches for the allocation of the $1,200 airfare include the following:
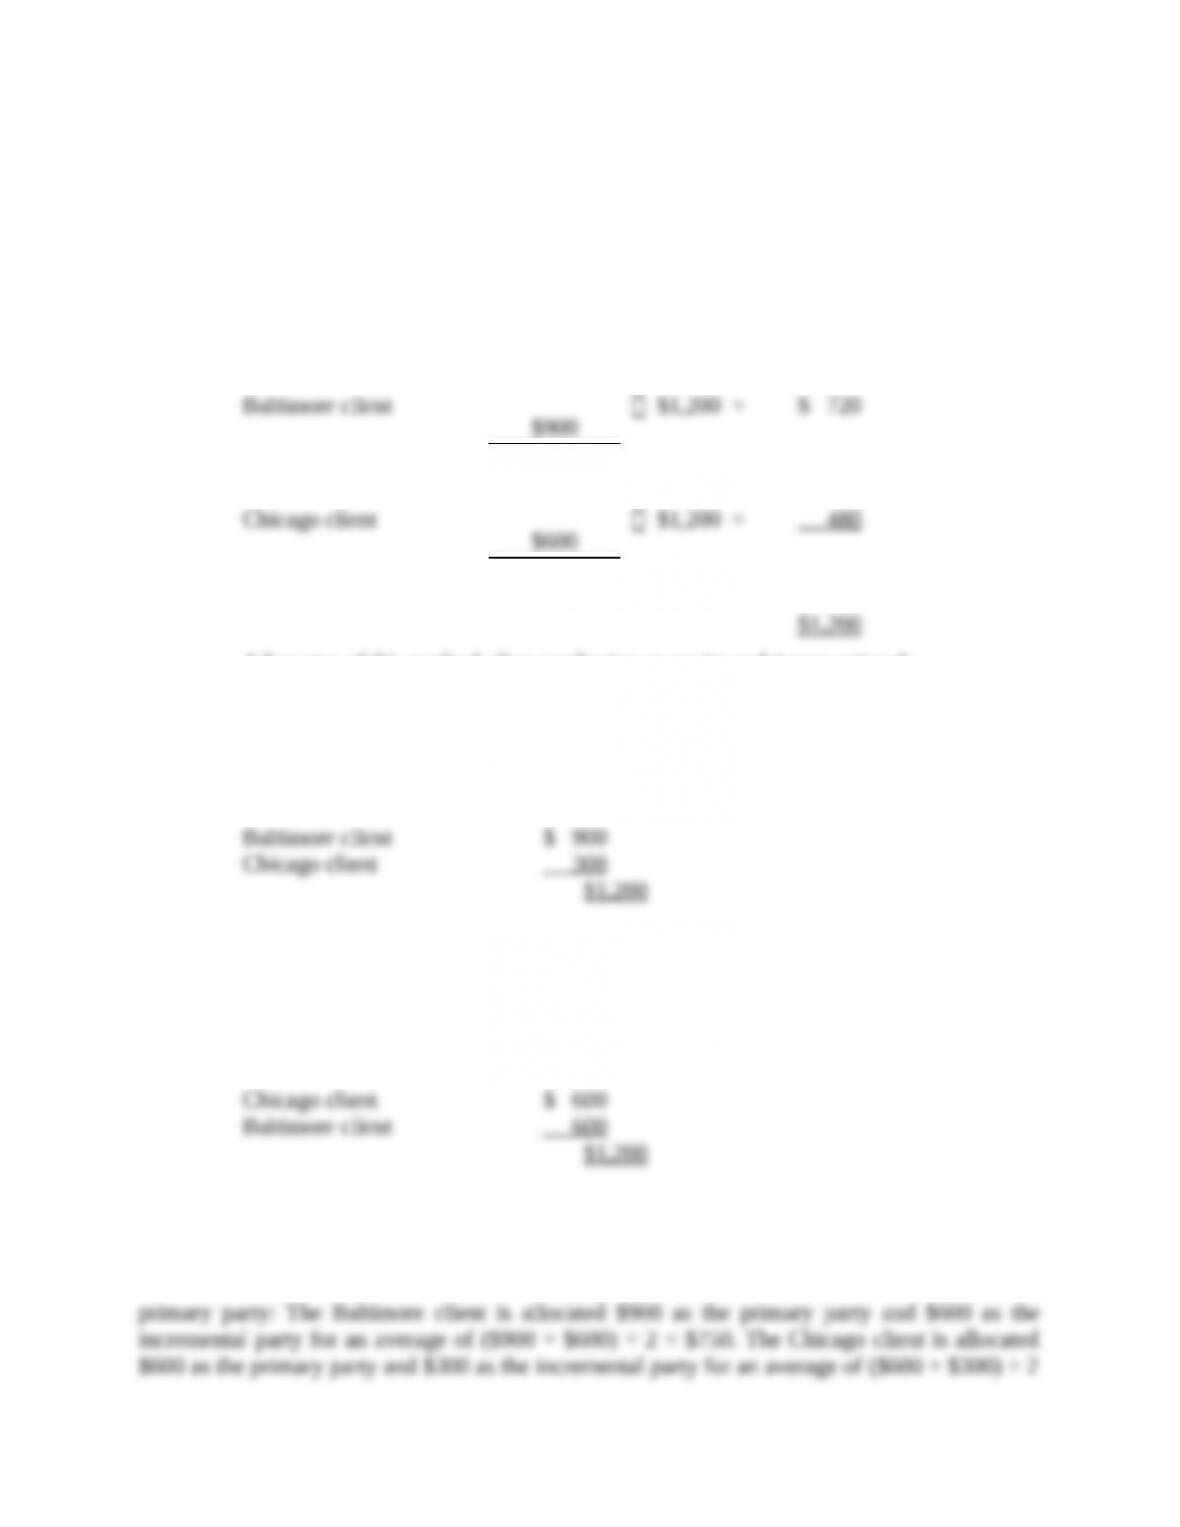
a. The stand-alone cost allocation method. This method would allocate the air fare on the
basis of each client’s percentage of the total of the individual stand-alone costs.
Baltimore client
( )
$900
$900 $600+
$1,200 = $ 720
Chicago client
( )
$600
$900 $600+
$1,200 = 480
$1,200
Advocates of this method often emphasize an equity or fairness rationale.
b. The incremental cost allocation method. This requires the choice of a primary party
and an incremental party.
If the Baltimore client is the primary party, the allocation would be:
Baltimore client $ 900
Chicago client 300
$1,200
One rationale is that Richardson was planning to make the Baltimore trip, and the Chicago stop
was added subsequently. Some students have suggested allocating as much as possible to the
Baltimore client because Richardson had decided not to work for them.
If the Chicago client is the primary party, the allocation would be:
Chicago client $ 600
Baltimore client 600
$1,200
One rationale is that the Chicago client is the one who is going to use Richardson’s services and,
presumably, receives more benefits from the travel expenditures.
c. Richardson could calculate the Shapley value that considers each client in turn as the
primary party: The Baltimore client is allocated $900 as the primary party and $600 as the
incremental party for an average of ($900 + $600) ÷ 2 = $750. The Chicago client is allocated
$600 as the primary party and $300 as the incremental party for an average of ($600 + $300) ÷ 2
= $450. The Shapley value approach would allocate $750 to the Baltimore client and $450 to the
Chicago client.
15-2
2. Richardson should use the Shapley value method. It is fairer than the incremental method
because it avoids considering one party as the primary party and allocating more of the common
costs to that party. It also avoids disputes about who is the primary party. It allocates costs in a
manner that is close to the costs allocated under the stand-alone method but takes a more
comprehensive view of the common cost allocation problem by considering primary and
incremental users, which the stand-alone method ignores.
The Shapley value (or the stand-alone cost allocation method) would be the preferred
methods if Richardson was to send the travel expenses to the Baltimore and Chicago clients before
deciding which engagement to accept. Other factors such as whether to charge the Chicago client
more because Richardson is accepting the Chicago engagement or the Baltimore client more
because Richardson is not going to work for them can be considered if Richardson sends in her
travel expenses after making her decision. However, each company would not want to be
considered as the primary party and so is likely to object to these arguments.
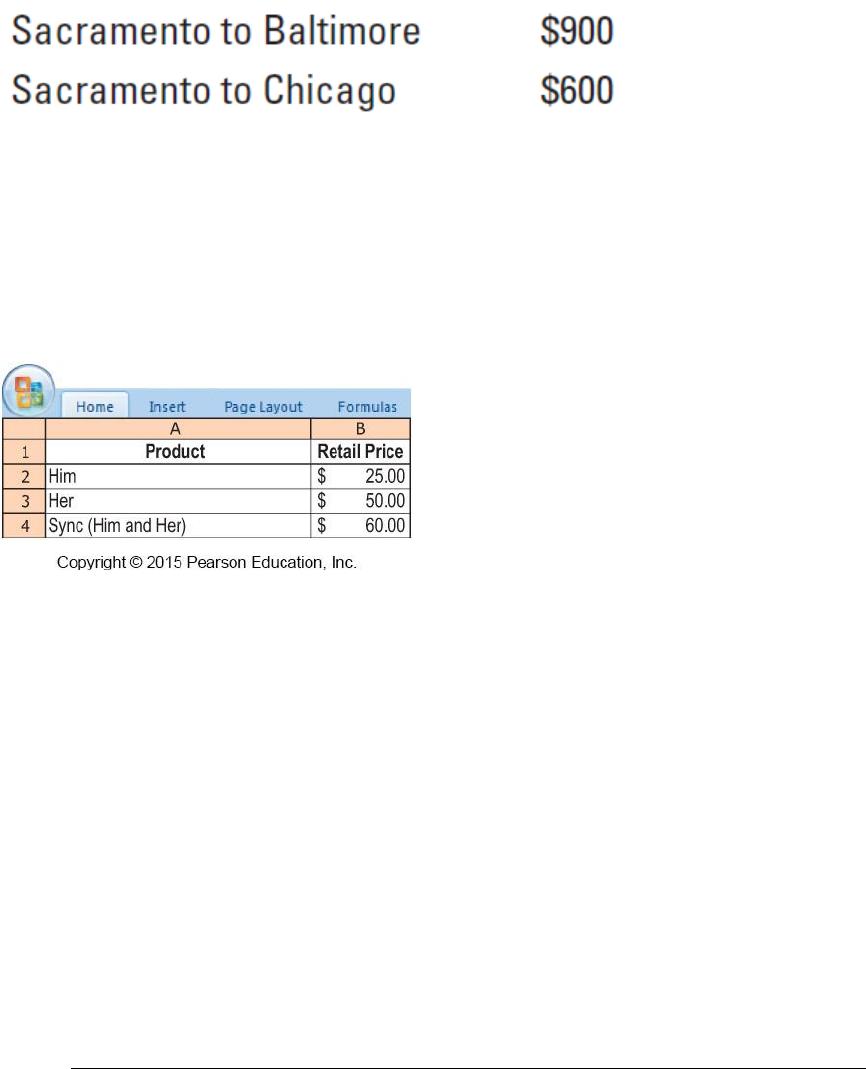
3. A simple approach is to split the $60 equally between the two clients. The limousine costs
at the Sacramento end are not a function of distance traveled on the plane.
An alternative approach is to add the $60 to the $1,200 and repeat requirement 1:
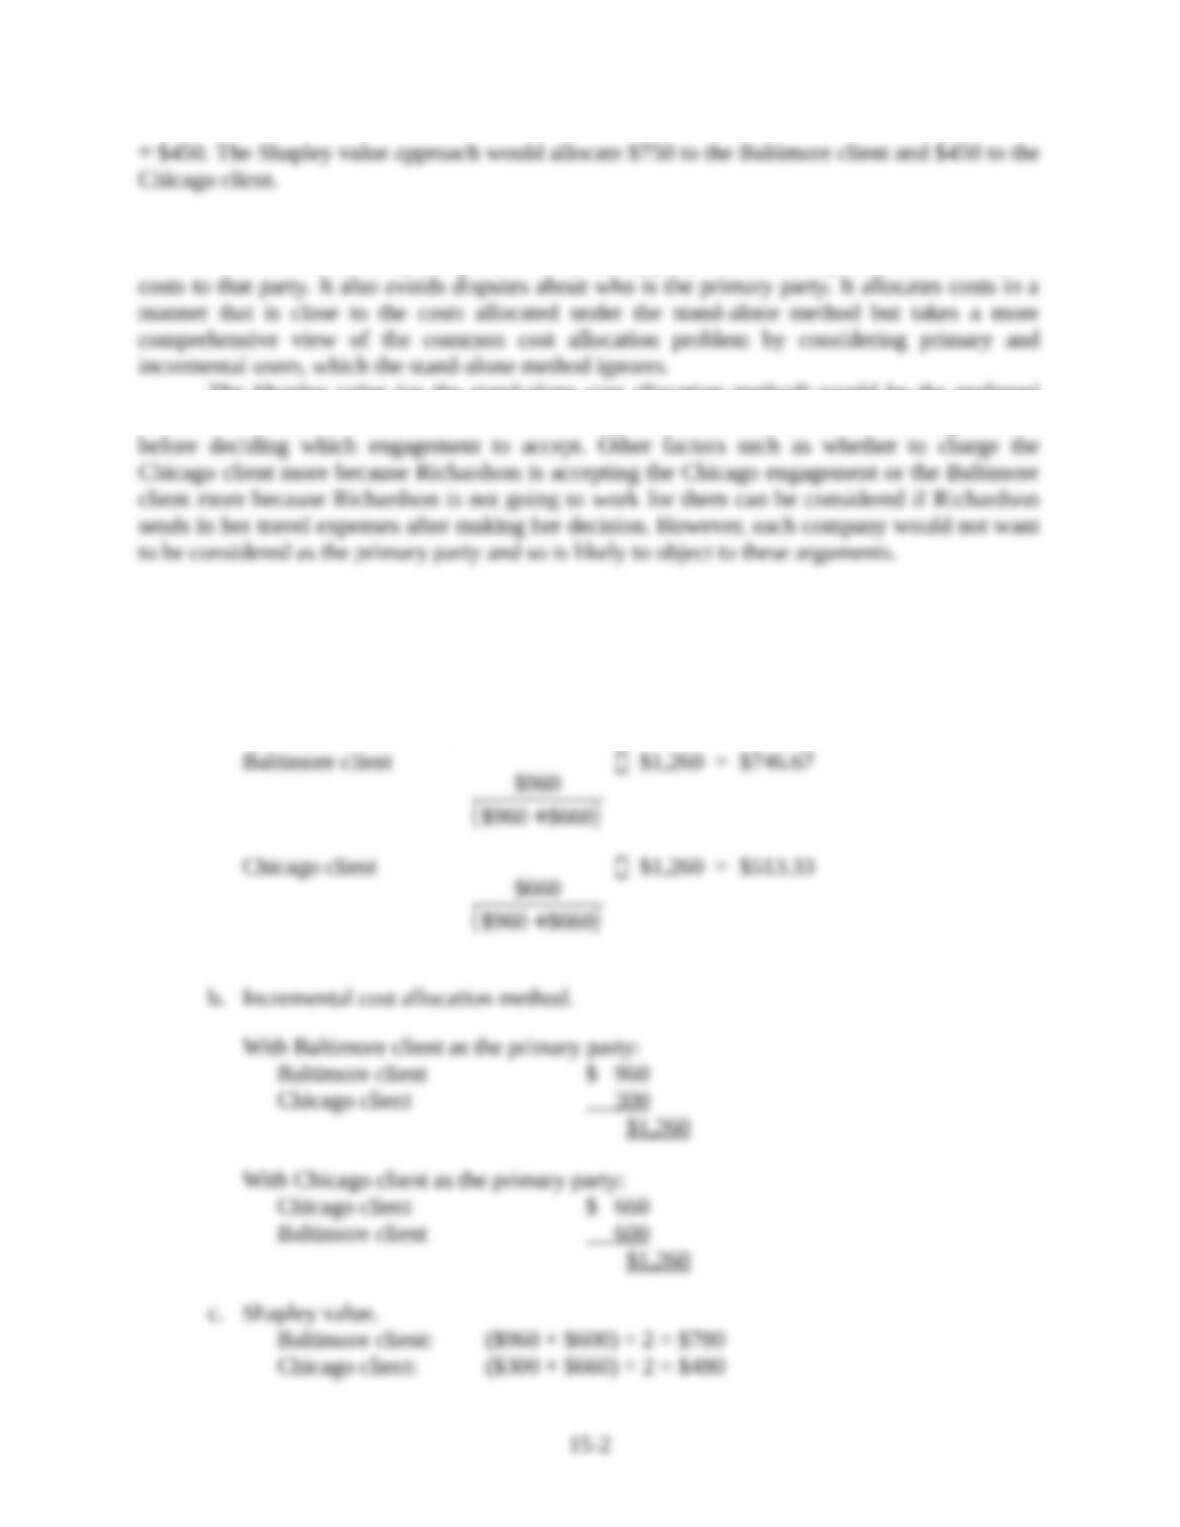
a. Stand-alone cost allocation method.
Baltimore client
( )
$960
$960 $660+
$1,260 = $746.67
Chicago client
( )
$660
$960 $660+
$1,260 = $513.33
b. Incremental cost allocation method.
With Baltimore client as the primary party:
Baltimore client $ 960
Chicago client 300
$1,260
With Chicago client as the primary party:
Chicago client $ 660
Baltimore client 600
$1,260
c. Shapley value.
Baltimore client: ($960 + $600) ÷ 2 = $780
Chicago client: ($300 + $660) ÷ 2 = $480
As discussed in requirement 2, the Shapley value or the stand-alone cost allocation
method would be the preferred approaches.
Note: If any students in the class have faced this situation when visiting prospective employers,
ask them how they handled it.
15-25 (20 min.) Revenue allocation, bundled products.
Essence Company blends and sells designer fragrances. It has a Men’s Fragrances Division and a
Women’s Fragrances Division, each with different sales strategies, distribution channels, and
product offerings. Essence is now considering the sale of a bundled product called Sync consisting
of one bottle of Him, a men’s cologne, and one bottle of Her, a women’s perfume. For the most
recent year, Essence reported the following:
A
Required:
1. Allocate revenue from the sale of each unit of Sync to Him and Her using the following:
a. The stand-alone revenue-allocation method based on selling price of each product
b. The incremental revenue-allocation method, with Him ranked as the primary product
c. The incremental revenue-allocation method, with Her ranked as the primary product
d. The Shapley value method, assuming equal unit sales of Him and Her
2. Of the four methods in requirement 1, which one would you recommend for allocating Sync’s
revenues to Him and Her? Explain.
SOLUTION
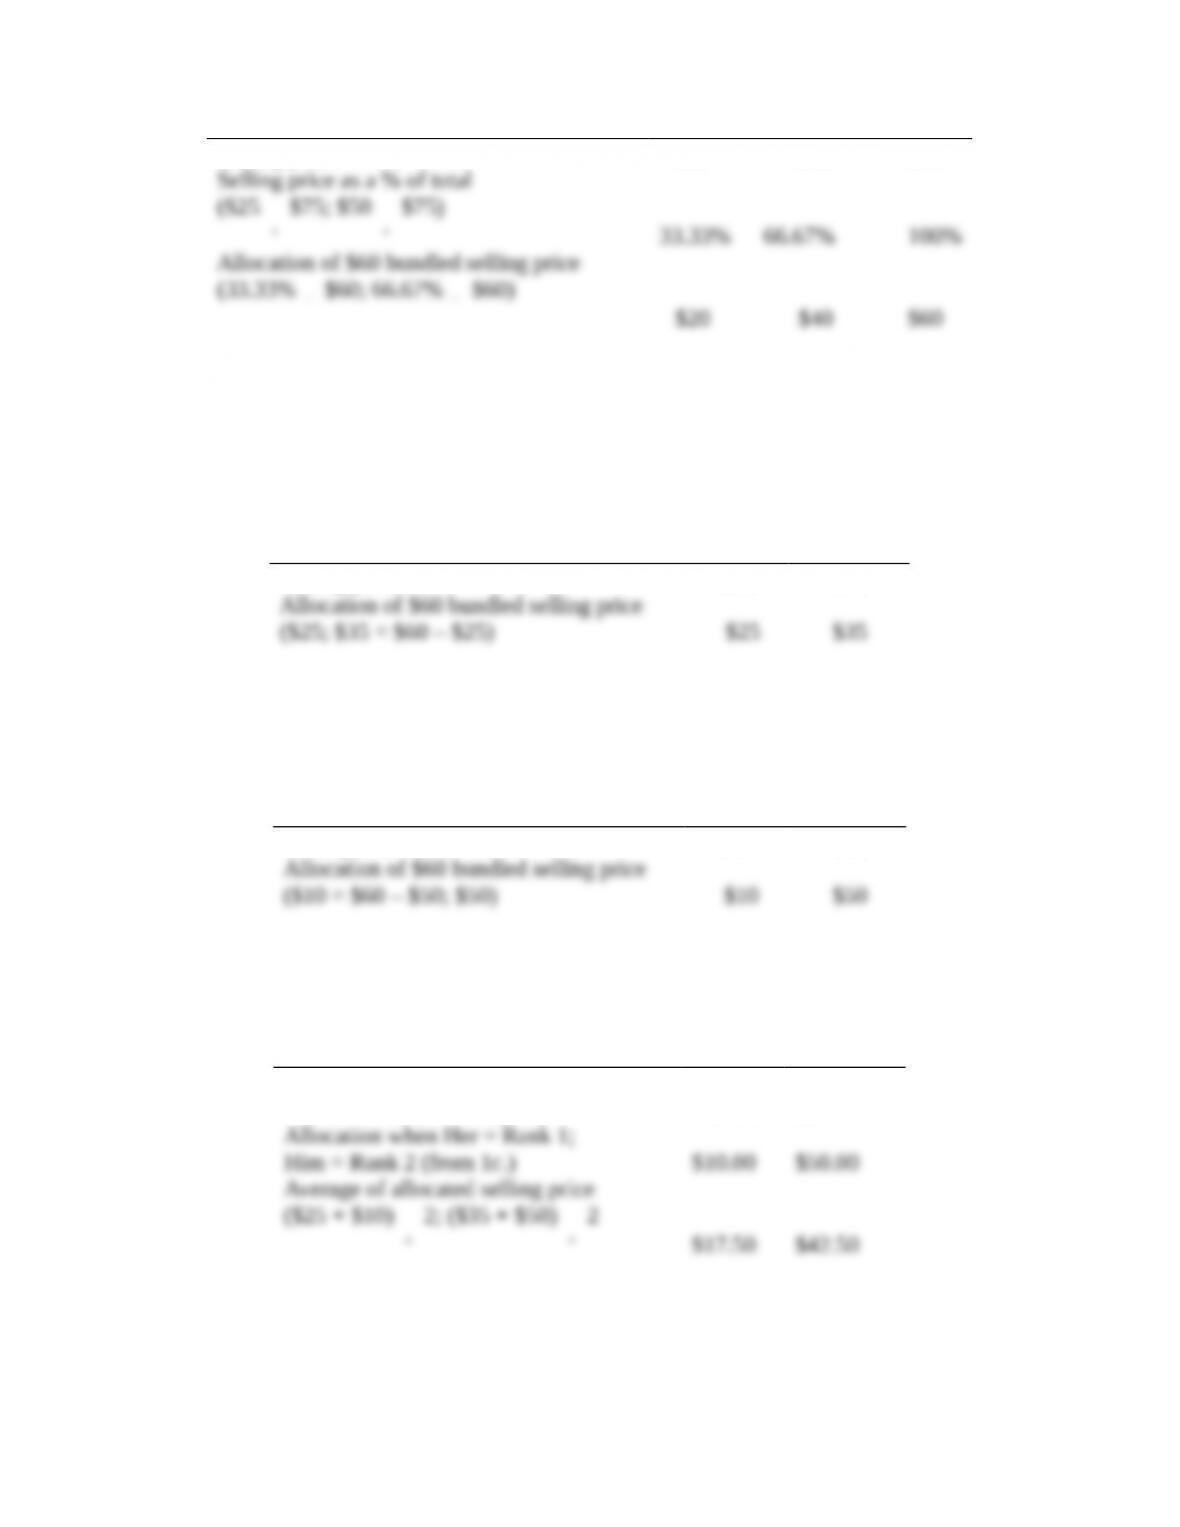
1a. Under the stand-alone revenue-allocation method based on selling price, Him will be
allocated 33.33% of all revenues, or $20 of the bundled selling price, and Her will be allocated
66.67% of all revenues, or $40 of the bundled selling price, as shown below.
Stand-alone method, based on selling
prices
Him
Her
Total
Selling price
$25
$50
$75
Selling price as a % of total
($25
$75; $50
$75)
33.33%
66.67%
100%
15-4
Allocation of $60 bundled selling price
(33.33%
$60; 66.67%
$60)
$20
$40
$60
1b. Under the incremental revenue-allocation method, with Him ranked as the primary product,
Him will be allocated $25 (its own stand-alone selling price), and Her will be allocated $35 of the
$60 selling price, as shown below.
Incremental Method
(Him rank 1)
Him
Her
Selling price
$25
$50
Allocation of $60 bundled selling price
($25; $35 = $60 – $25)
$25
$35
1c. Under the incremental revenue-allocation method, with Her ranked as the primary product,
Her will be allocated $50 (its own stand-alone selling price) and Him will be allocated $10 of the
$60 selling price, as shown below.
Incremental Method
(Her rank 1)
Him
Her
Selling price
$25
$50
Allocation of $60 bundled selling price
($10 = $60 – $50; $50)
$10
$50
1d. Under the Shapley value method, each product will be allocated the average of its
allocations in 1b and 1c, i.e., the average of its allocations when it is the primary product and when
it is the secondary product, as shown below.
Shapley Value Method
Him
Her
Allocation when Him = Rank 1;
Her = Rank 2 (from 1b.)
$25.00
$35.00
Allocation when Her = Rank 1;
Him = Rank 2 (from 1c.)
$10.00
$50.00
Average of allocated selling price
($25 + $10)
2; ($35 + $50)
2
$17.50
$42.50
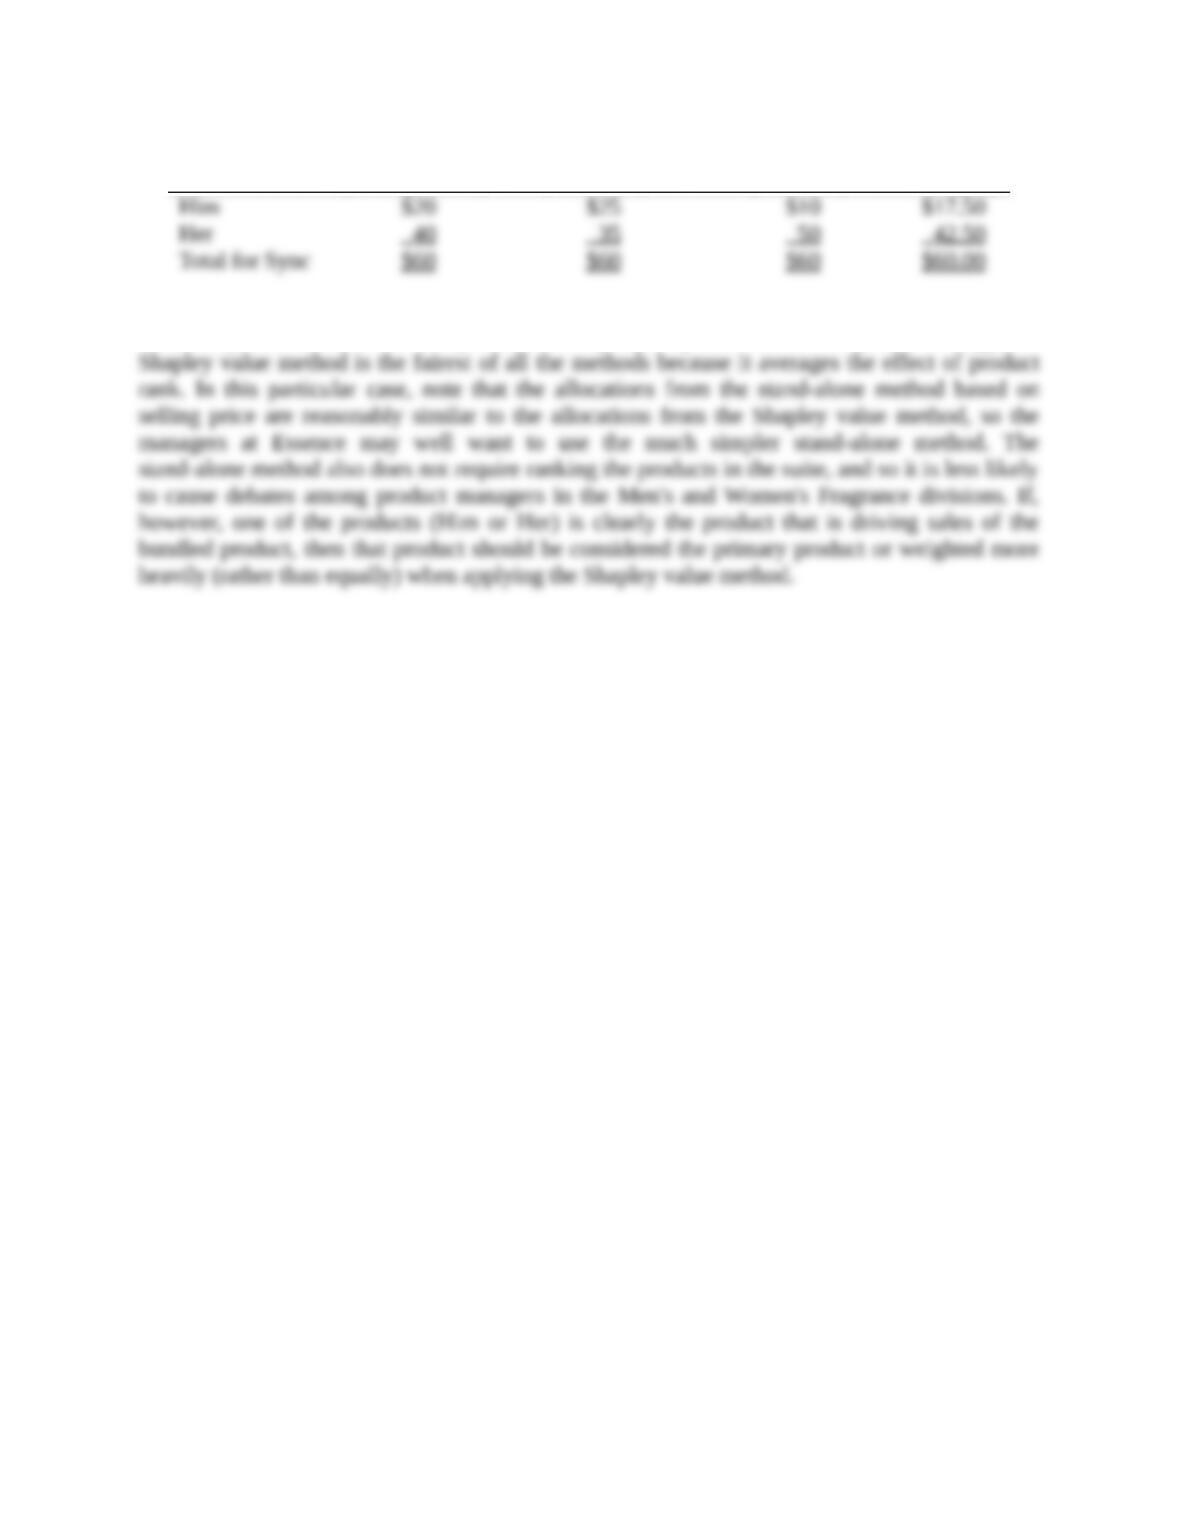
2. A summary of the allocations based on the four methods in requirement 1 is shown below.
Stand-alone
(Selling Prices)
Incremental
(Him first)
Incremental
(Her first)
Shapley
Him
$20
$25
$10
$17.50
Her
40
35
50
42.50
Total for Sync
$60
$60
$60
$60.00
If there is no clear indication of which product is the more “important” product, or if it can be
reasonably assumed that the two products are equally important to the company’s strategy, the
15-5
Shapley value method is the fairest of all the methods because it averages the effect of product
rank. In this particular case, note that the allocations from the stand–alone method based on selling
price are reasonably similar to the allocations from the Shapley value method, so the managers at
Essence may well want to use the much simpler stand-alone method. The stand-alone method also
does not require ranking the products in the suite, and so it is less likely to cause debates among
product managers in the Men’s and Women’s Fragrance divisions. If, however, one of the products
(Him or Her) is clearly the product that is driving sales of the bundled product, then that product
should be considered the primary product or weighted more heavily (rather than equally) when
applying the Shapley value method.
15-26 (20-25 min. ) Allocation of common costs.
Doug Dandy Auto Sales uses all types of media to advertise its products (television, radio,
newspaper, and so on). At the end of 2013, the company president, Doug Davenport, decided that
all advertising costs would be incurred by corporate headquarters and allocated to each of the
company’s four sales locations based on number of vehicles sold. Doug was confident that his
corporate purchasing manager could negotiate better advertising contracts on a corporate-wide
basis than each of the sales managers could on their own. Davenport budgeted total advertising
cost for 2014 to be $1.7 million. He introduced the new plan to his sales managers just before the
New Year.
The manager of the east sales location, Mike Samson, was not happy. He complained that the
new allocation method was unfair and would increase his advertising costs significantly over the
prior year. The east location sold high volumes of low-priced used cars and most of the corporate
advertising budget was related to new car sales.
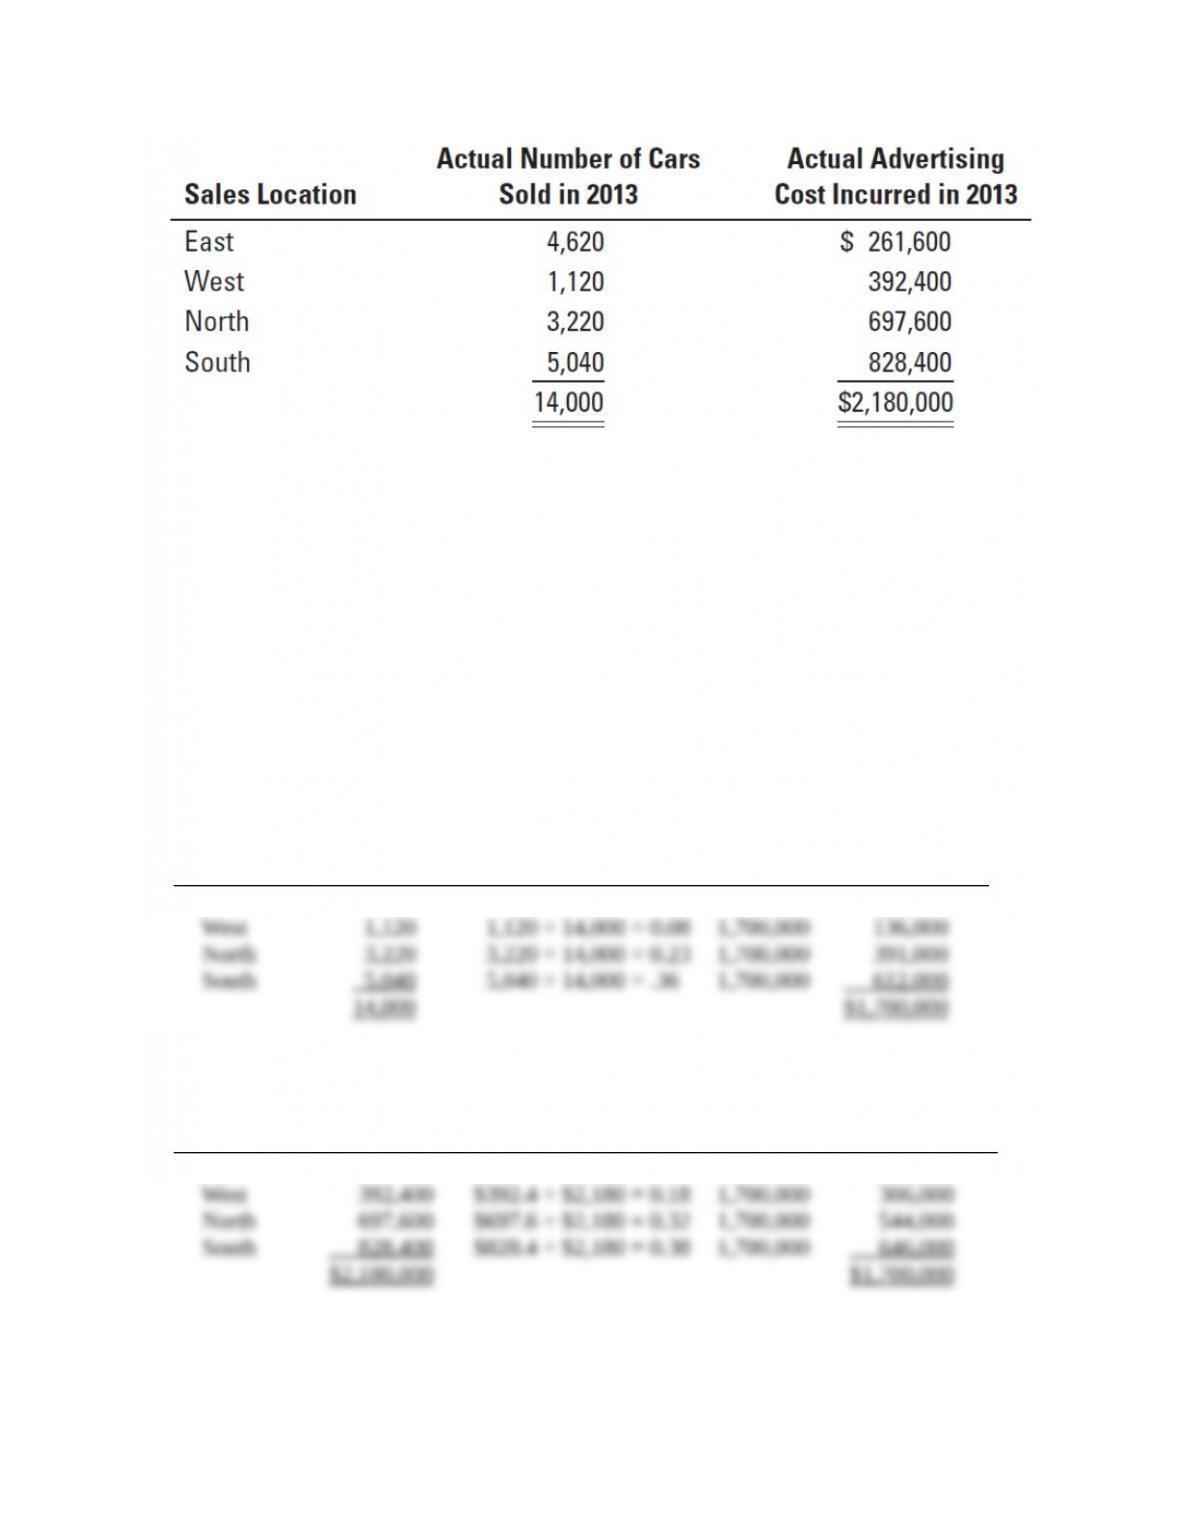
Following Mike’s complaint, Doug decided to take another hard look at what each of the
divisions was paying for advertising before the new allocation plan. The results were as follows:
Required:
1. Using 2013 data as the cost bases, show the amount of the 2014 advertising cost ($1,700,000)
that would be allocated to each of the divisions under the following criteria:
a. Davenport’s allocation method based on number of cars sold
b. The stand-alone method
15-6
c. The incremental-allocation method, with divisions ranked on the basis of dollars spent on
advertising in 2013
2. Which method do you think is most equitable to the divisional sales managers? What other
options might President Doug Davenport have for allocating the advertising costs?
SOLUTION
1. a. Davenport’s method based on number of cars sold:
Sales
Location
(1)
Number of
cars sold
(2)
Percentage
(3) = (2) ÷ 14,000
Joint Cost
(4)
Allocation
(5) = (3) × (4)
East 4,620 4,620 ÷ 14,000 = 0.33 $1,700,000 $ 561,000
West 1,120 1,120 ÷ 14,000 = 0.08 1,700,000 136,000
North 3,220 3,220 ÷ 14,000 = 0.23 1,700,000 391,000
South 5,040 5,040 ÷ 14,000 = .36 1,700,000 612,000
14,000 $1,700,000
1. b. Stand-alone method:
Sales
Location
(1)
Stand-alone
cost
(2)
Percentage
(costs in thousands)
(3) = (2) ÷ $2,180
Joint Cost
(4)
Allocation
(5) = (3) × (4)
East $ 261,600 $261.6 ÷ $2,180 = 0.12 $1,700,000 $ 204,000
West 392,400 $392.4 ÷ $2,180 = 0.18 1,700,000 306,000
North 697,600 $697.6 ÷ $2,180 = 0.32 1,700,000 544,000
South 828,400 $828.4 ÷ $2,180 = 0.38 1,700,000 646,000
$2,180,000 $1,700,000
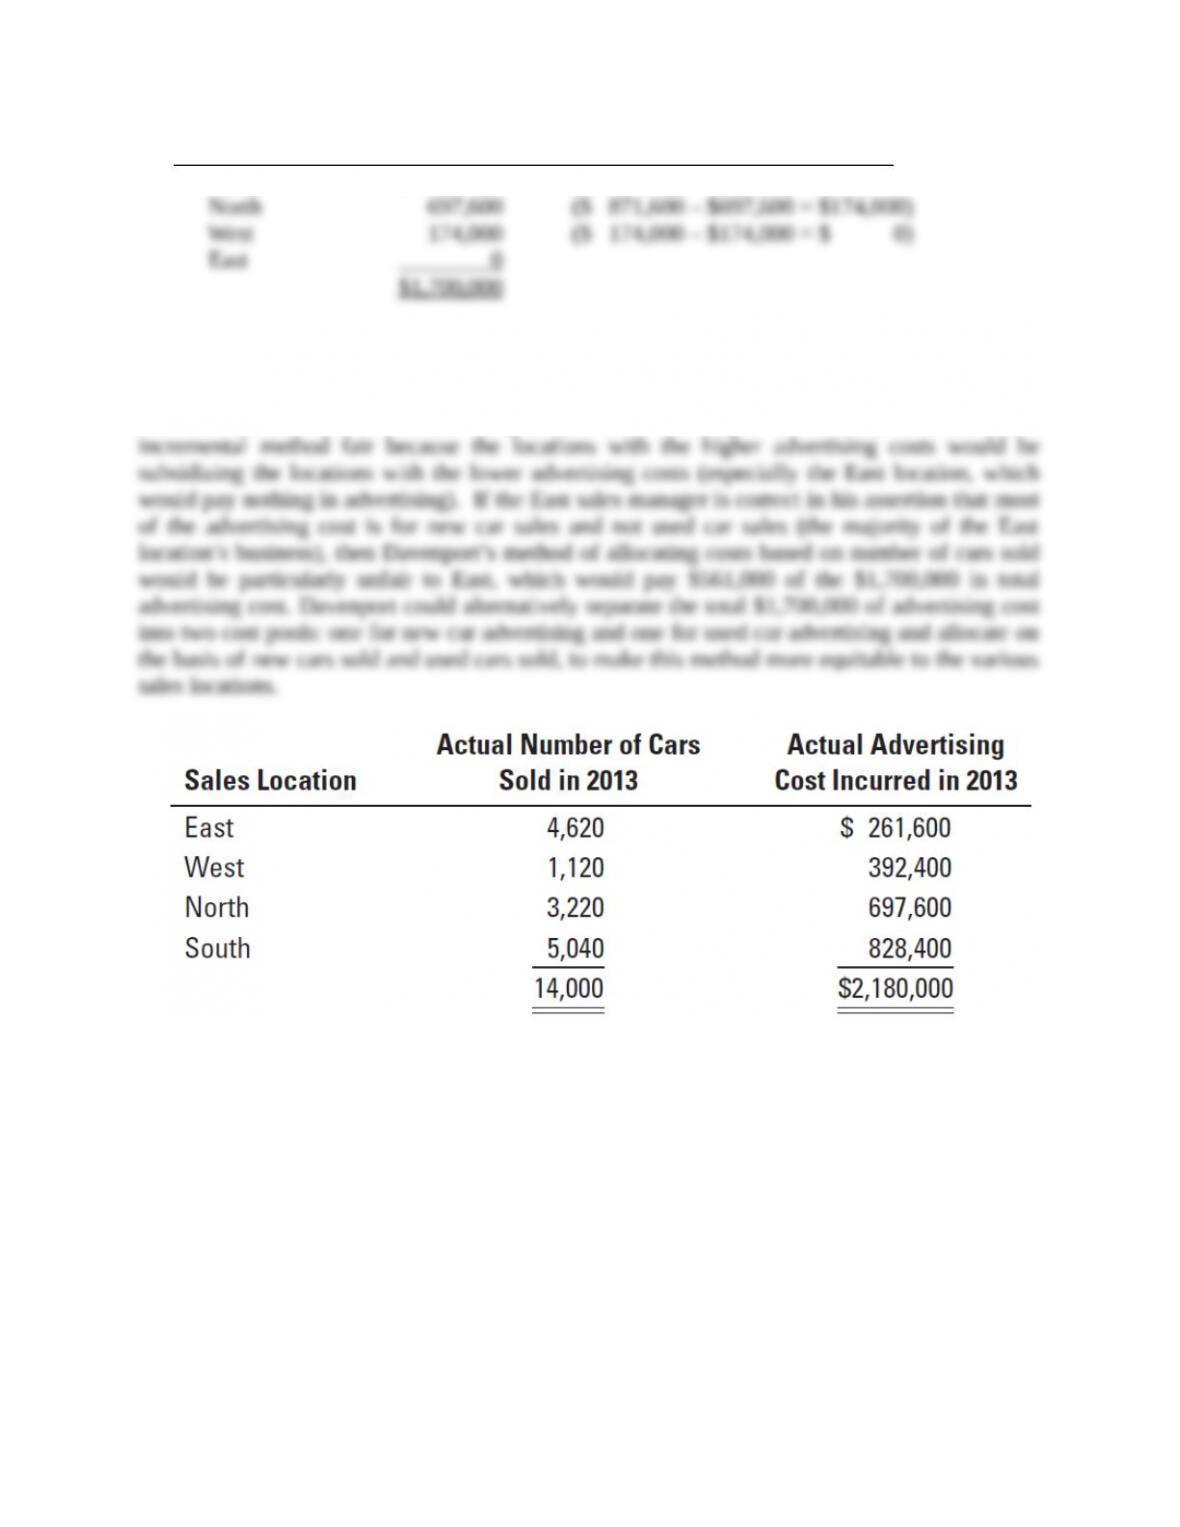
1. c. Incremental method (locations ranked in order of largest advertising dollars to smallest
advertising dollars):
Sales Location
Allocated Cost
Cost Remaining to Allocate
South $ 828,400 ($1,700,000 – $828,400 = $871,600)
North 697,600 ($ 871,600 – $697,600 = $174,000)
West 174,000 ($ 174,000 – $174,000 = $ 0)
East 0
$1,700,000
2. In this situation, the stand-alone method is probably the best method because the weights it uses
for allocation are based on the individual advertising cost for each location as a separate entity.
Therefore, each entity gets the same relative proportion of advertising costs, and each location will
have lower total advertising costs. The sales managers would likely not consider the incremental
method fair because the locations with the higher advertising costs would be subsidizing the
locations with the lower advertising costs (especially the East location, which would pay nothing
in advertising). If the East sales manager is correct in his assertion that most of the advertising
cost is for new car sales and not used car sales (the majority of the East location’s business), then
Davenport’s method of allocating costs based on number of cars sold would be particularly unfair
to East, which would pay $561,000 of the $1,700,000 in total advertising cost. Davenport could
15-7
alternatively separate the total $1,700,000 of advertising cost into two cost pools: one for new car
advertising and one for used car advertising and allocate on the basis of new cars sold and used
cars sold, to make this method more equitable to the various sales locations.
15-27 (20 min.) Single-rate, dual-rate, and practical capacity allocation.
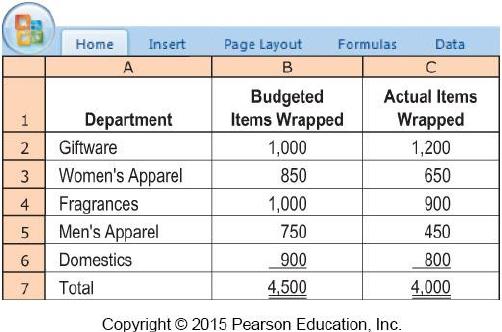
Preston Department Store has a new promotional program that offers a free gift-wrapping service
for its customers. Preston’s customer–service department has practical capacity to wrap 5,000 gifts
at a budgeted fixed cost of $4,950 each month. The budgeted variable cost to gift–wrap an item is
$0.35. During the most recent month, the department budgeted to wrap 4,500 gifts. Although the
service is free to customers, a gift-wrapping service cost allocation is made to the department
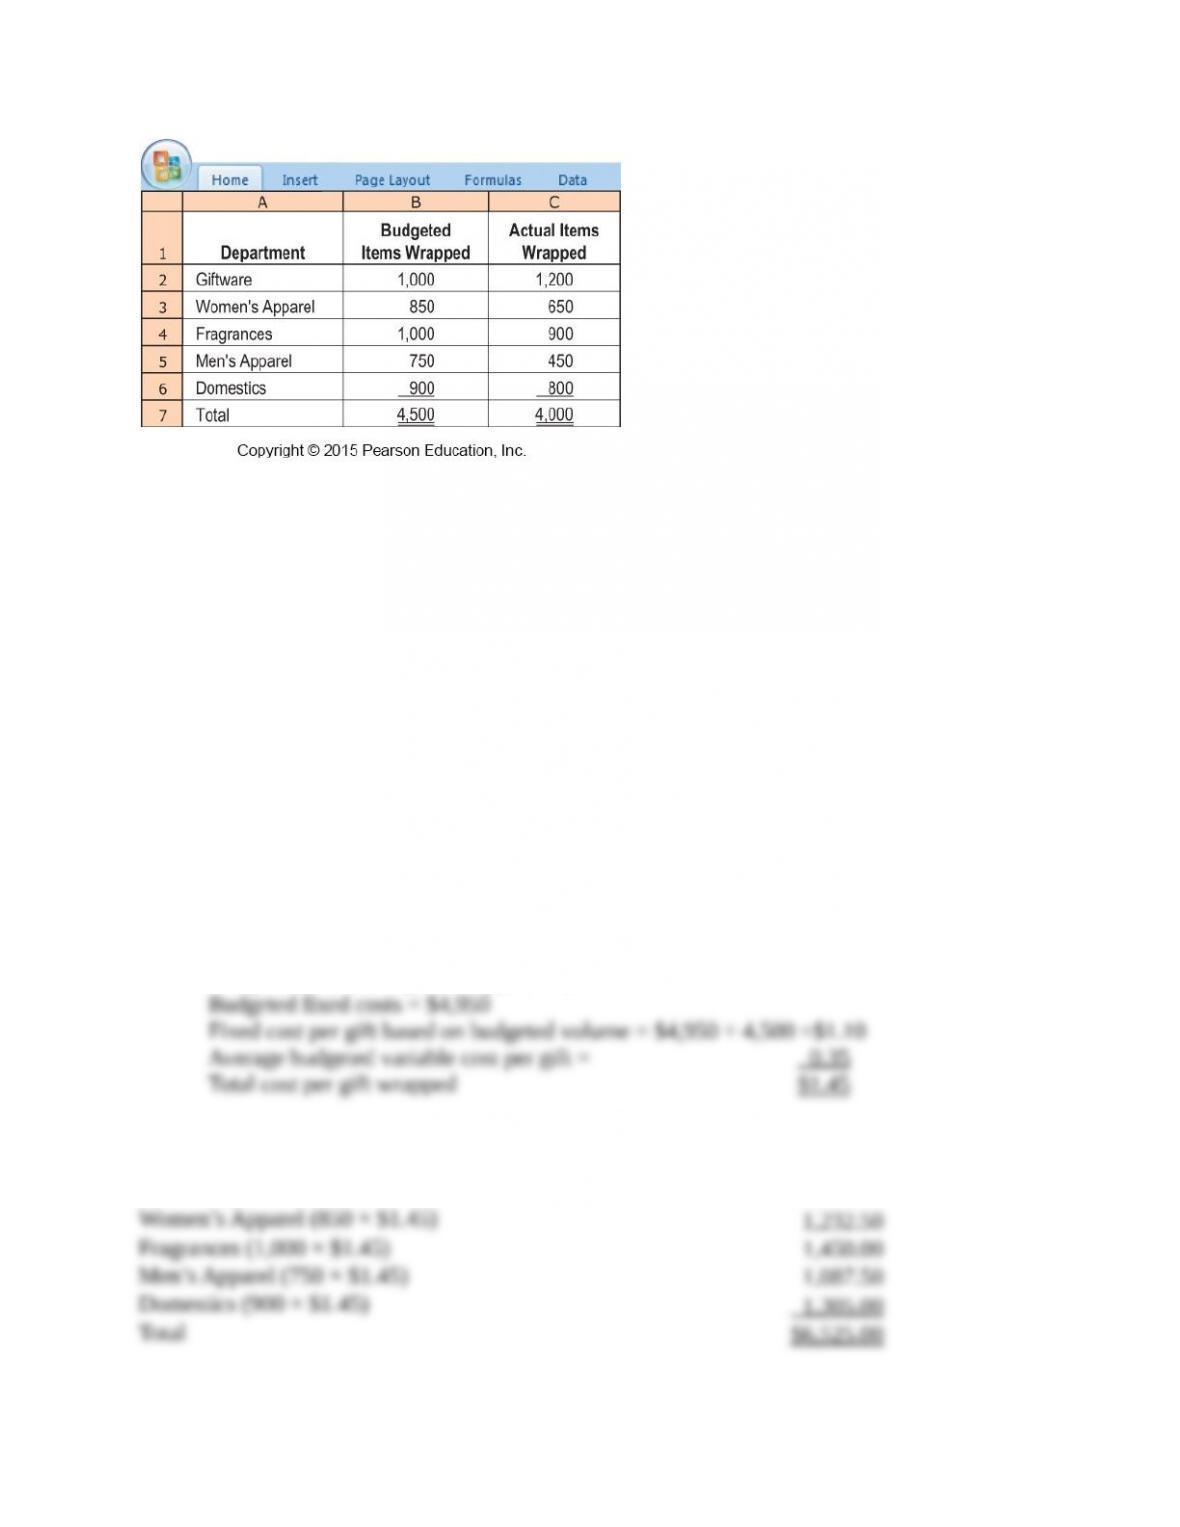
where the item was purchased. The customer-service department reported the following for the
most recent month:
Required:
1. Using the single-rate method, allocate gift-wrapping costs to different departments in these
three ways:
a. Calculate the budgeted rate based on the budgeted number of gifts to be wrapped and
allocate costs based on the budgeted use (of gift-wrapping services).
15-8
b. Calculate the budgeted rate based on the budgeted number of gifts to be wrapped and
allocate costs based on actual usage.
c. Calculate the budgeted rate based on the practical gift-wrapping capacity available and
allocate costs based on actual usage.
2. Using the dual-rate method, compute the amount allocated to each department when (a) the
fixed-cost rate is calculated using budgeted costs and the practical gift-wrapping capacity, (b)
fixed costs are allocated based on budgeted usage of gift–wrapping services, and (c) variable
costs are allocated using the budgeted variable-cost rate and actual usage.
3. Comment on your results in requirements 1 and 2. Discuss the advantages of the dual-rate
method.
SOLUTION
Budgeted number of gifts wrapped = 4,500
Budgeted fixed costs = $4,950
Fixed cost per gift based on budgeted volume = $4,950 ÷ 4,500 = $1.10
Average budgeted variable cost per gift = 0.35
Total cost per gift wrapped $1.45
1.a. Allocation based on budgeted usage of gift–wrapping services:
Giftware (1,000 × $1.45)
$1,450.00
Women’s Apparel (850 × $1.45)
1,232.50
Fragrances (1,000 × $1.45)
1,450.00
Men’s Apparel (750 × $1.45)
1,087.50
Domestics (900 × $1.45)
1,305.00
Total
$6,525.00
1.b. Allocation based on actual usage of gift-wrapping services:
Giftware (1,200 × $1.45)
$1,740.00
Women’s Apparel (650 × $1.45)
942.50
Fragrances (900 × $1.45)
1,305.00
Men’s Apparel (450 × $1.45)
652.50
Domestics (800 × $1.45)
1,160.00
Total
$5,800.00
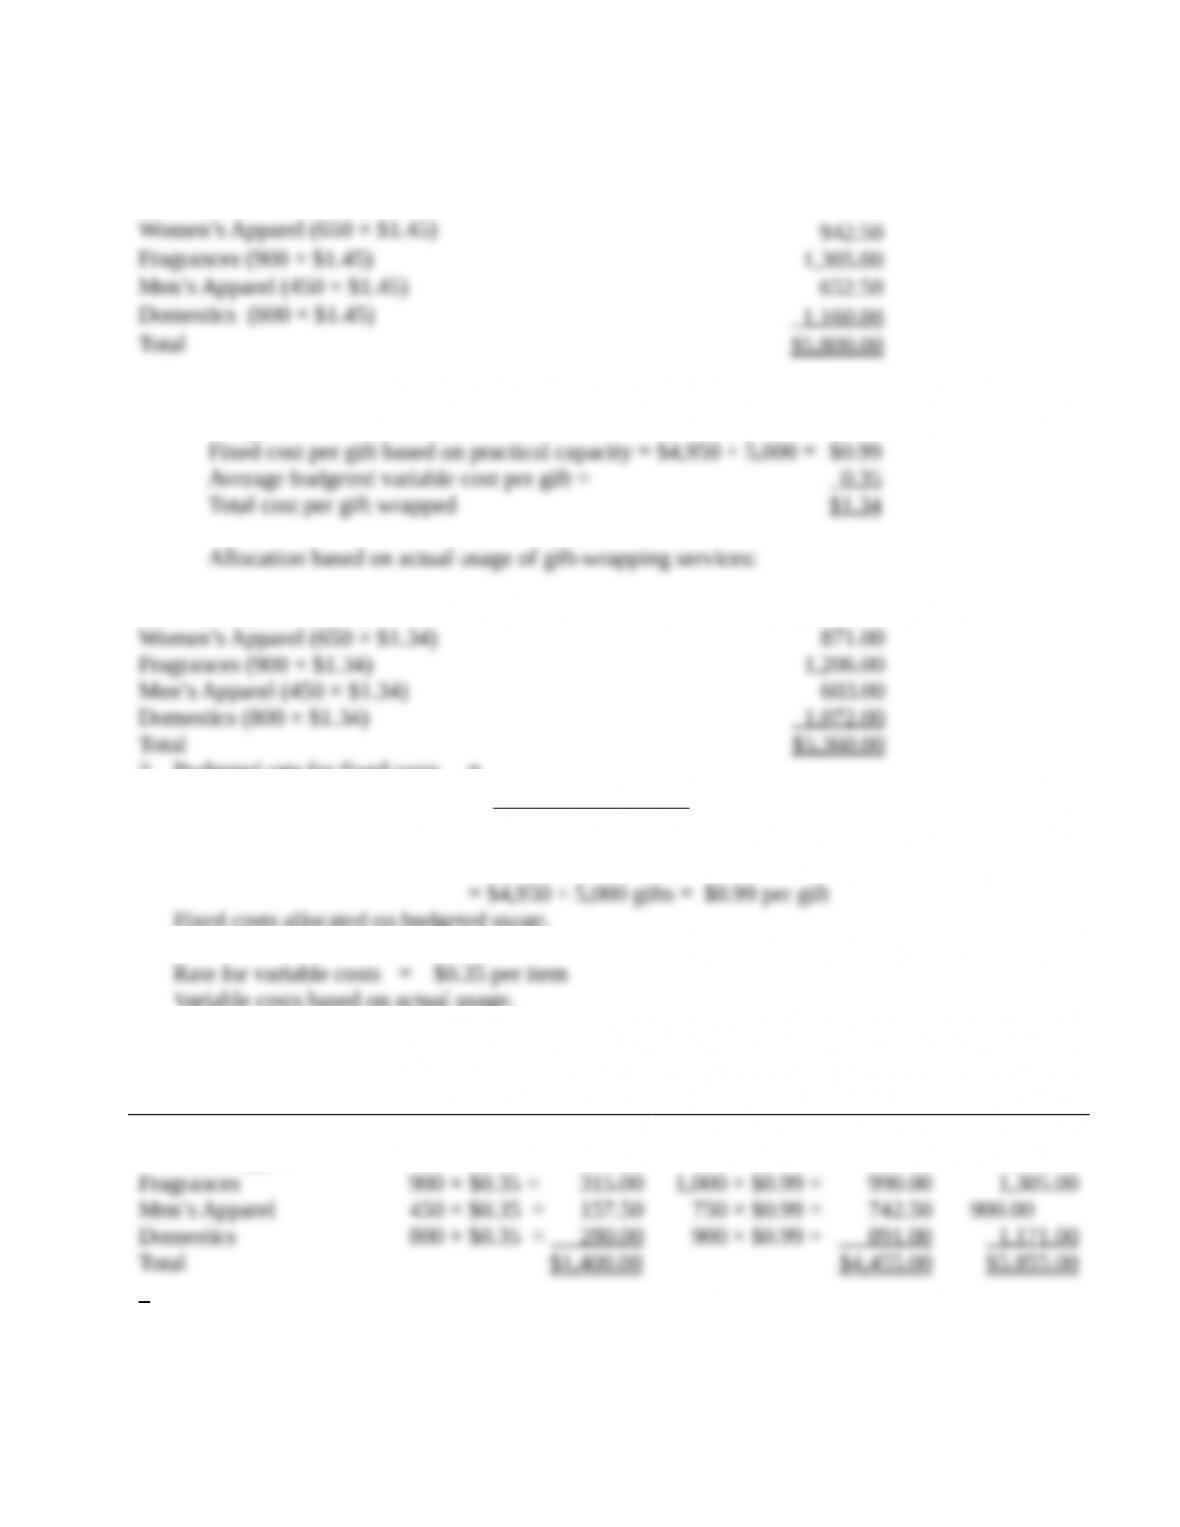
1.c. Practical gift–wrapping capacity = 5,000
Budgeted fixed costs = $4,950
Fixed cost per gift based on practical capacity = $4,950 ÷ 5,000 = $0.99
Average budgeted variable cost per gift = 0.35
Total cost per gift wrapped $1.34
Allocation based on actual usage of gift–wrapping services:
15-9
Giftware (1,200 × $1.34) $1,608.00
Women’s Apparel (650 × $1.34) 871.00
Fragrances (900 × $1.34) 1,206.00
Men’s Apparel (450 × $1.34) 603.00
Domestics (800 × $1.34) 1,072.00
Total $5,360.00
2. Budgeted rate for fixed costs =
Budgeted fixed costs
Practical capacity
= $4,950 ÷ 5,000 gifts = $0.99 per gift
Fixed costs allocated on budgeted usage.
Rate for variable costs = $0.35 per item
Variable costs based on actual usage.
Allocation:
Department
Variable Costs
Fixed Costs
Total
Giftware
1,200 × $0.35 = $ 420.00
1,000 × $0.99 = $ 990.00
$1,410.00
Women’s Apparel
650 × $0.35 = 227.50
850 × $0.99 = 841.50
1,069.00
Fragrances
900 × $0.35 = 315.00
1,000 × $0.99 = 990.00
1,305.00
Men’s Apparel
450 × $0.35 = 157.50
750 × $0.99 = 742.50
900.00
Domestics
800 × $0.35 = 280.00
900 × $0.99 = 891.00
1,171.00
Total
$1,400.00
$4,455.00
$5,855.00
3. The dual-rate method has two major advantages over the single-rate method:
a. Fixed costs and variable costs can be allocated differently—fixed costs based on rates
calculated using practical capacity and budgeted usage and variable costs based on
budgeted rates and actual usage.
b. Fixed costs are allocated proportionately to the departments causing the incurrence of
those costs based on the budgeted usage of each department.
c. The costs allocated to a department are not affected by the usage by other departments.
Note: If capacity costs are the result of a long-term decision by top management, it may be
desirable to allocate to each department the cost of capacity used based on actual usage. The users
are then not allocated the costs of unused capacity.
15-10