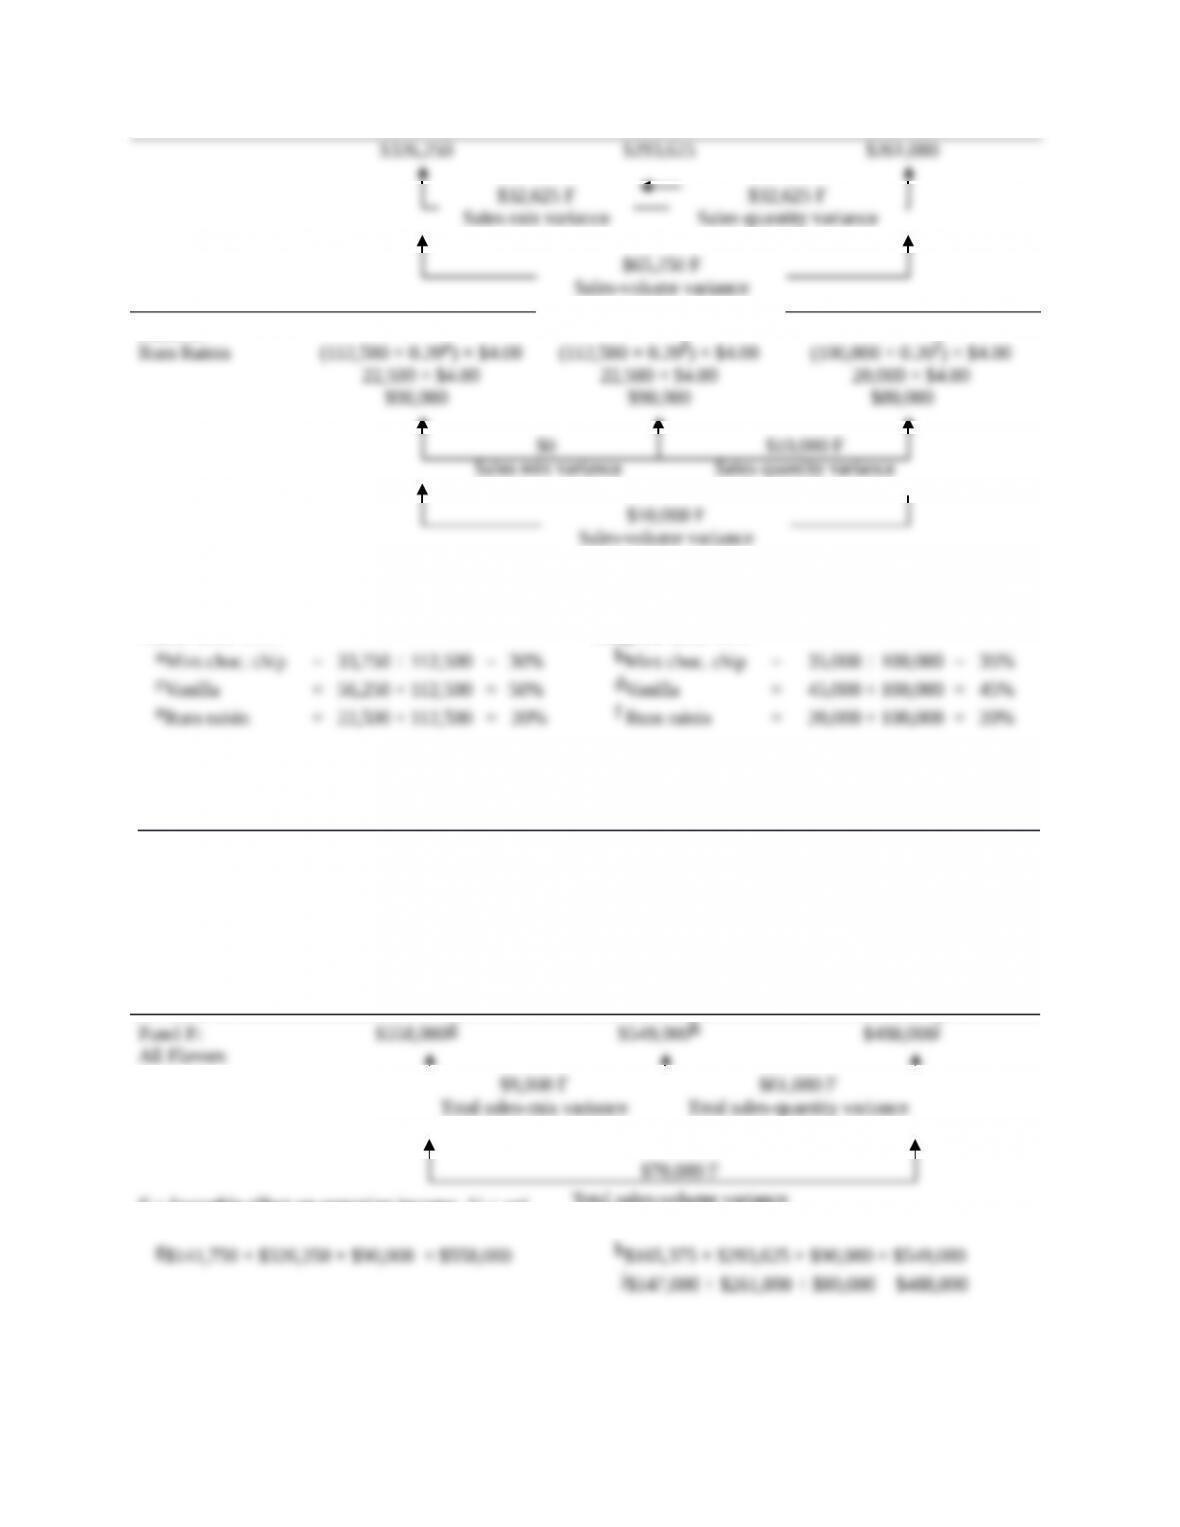
$326,250 $293,625 $261,000
Panel C:
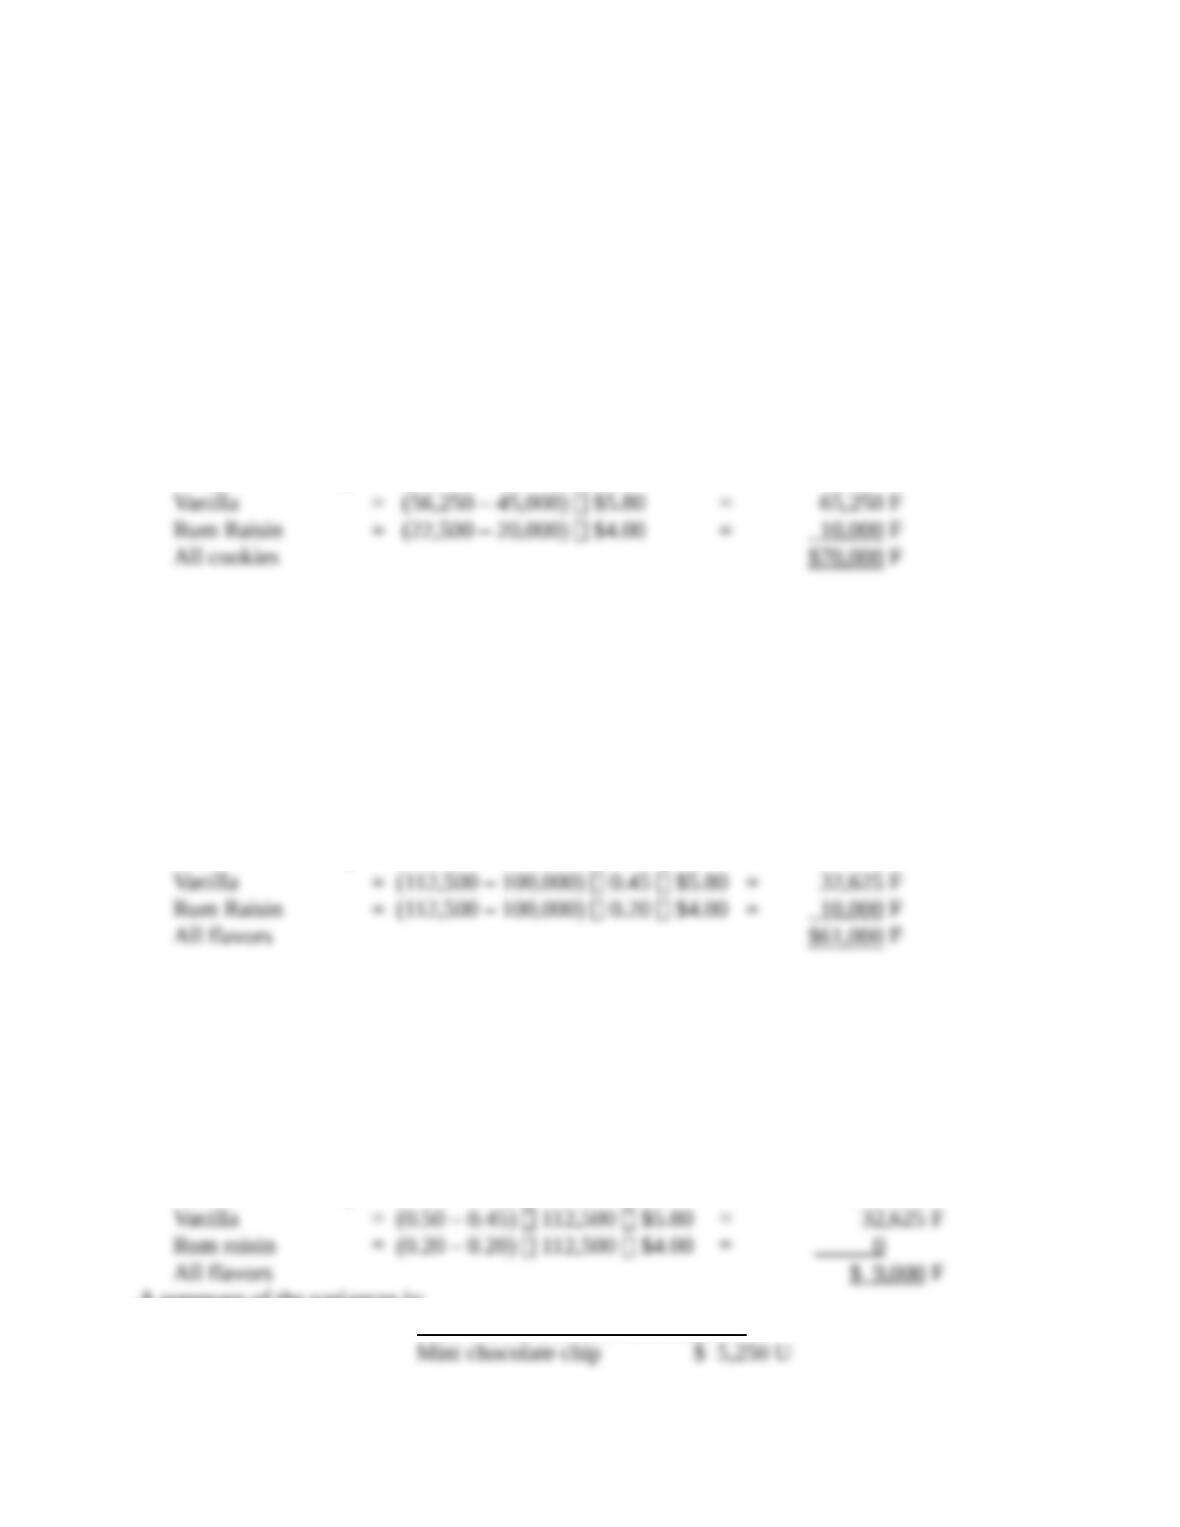
Rum Raisin
(112,500 × 0.20e) × $4.00
22,500 × $4.00
(112,500 × 0.20f) × $4.00
22,500 × $4.00
(100,000 × 0.20f) × $4.00
20,000 × $4.00
$90,000 $90,000 $80,000
F = favorable effect on operating income; U = unfavorable effect on operating income.
Actual Sales Mix:
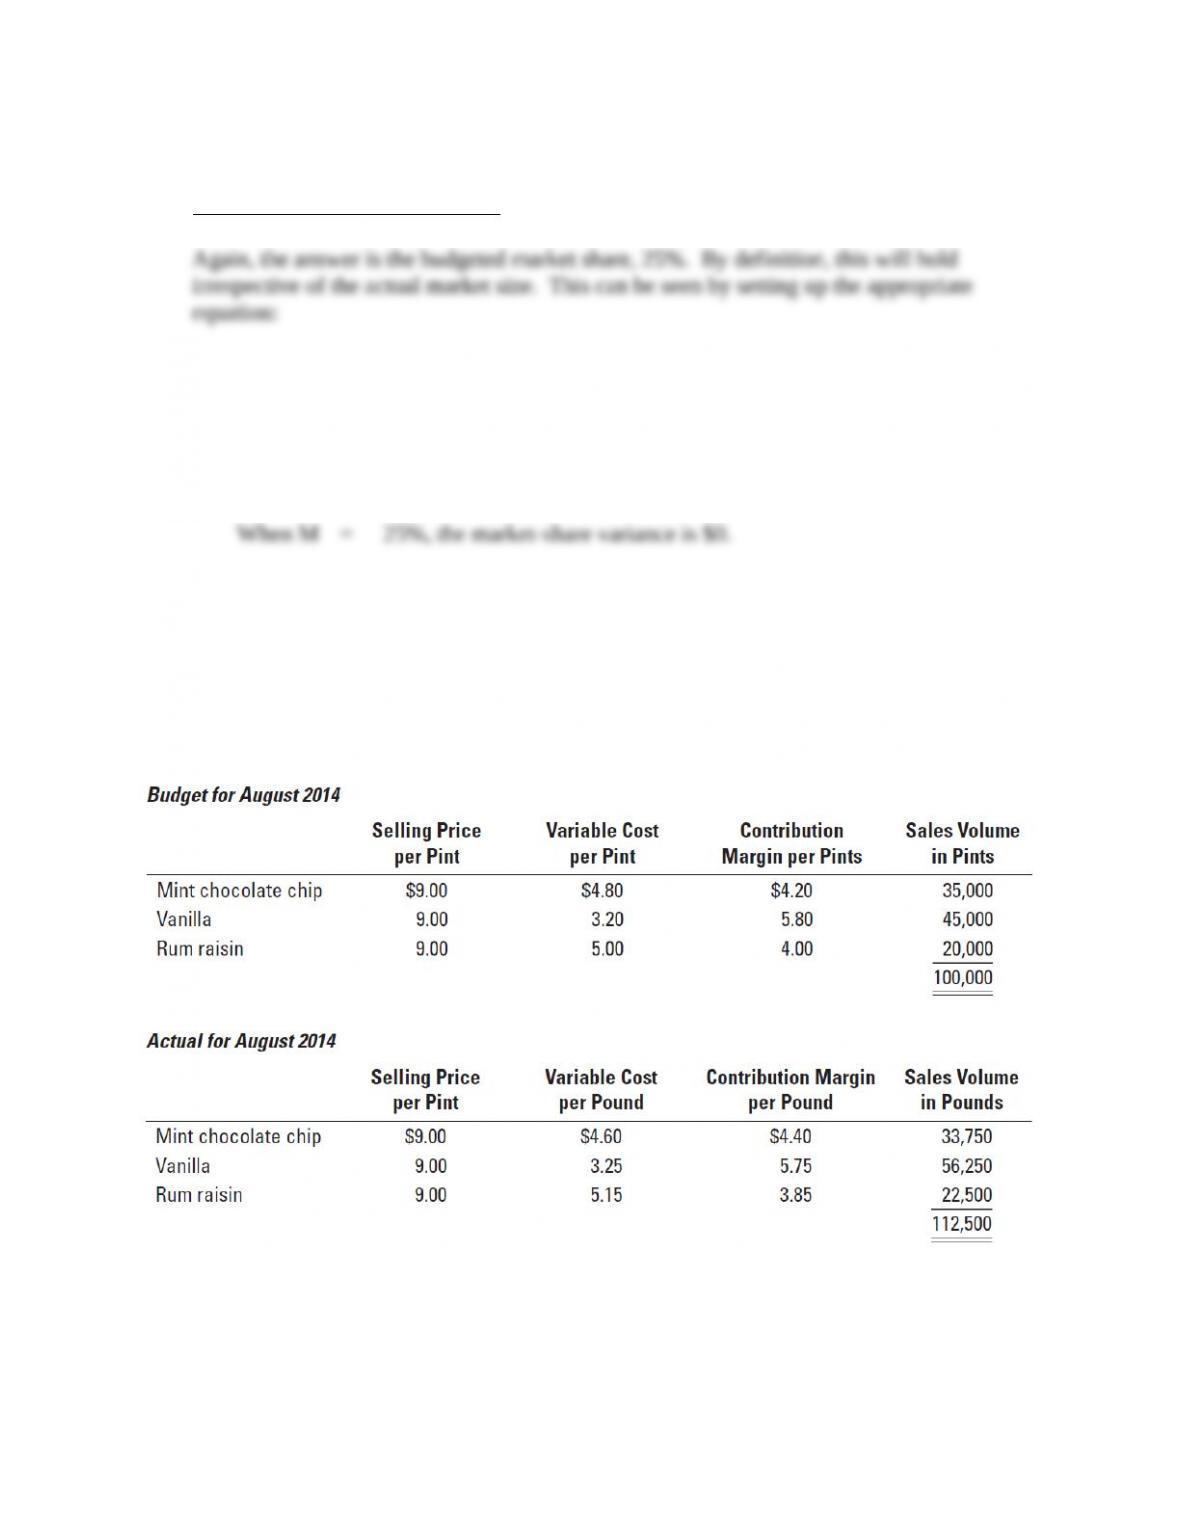
aMint choc. chip = 33,750 ÷ 112,500 = 30%
cVanilla = 56,250 ÷ 112,500 = 50%
eRum raisin = 22,500 ÷ 112,500 = 20%
Budgeted Sales Mix:
bMint choc. chip = 35,000 ÷ 100,000 = 35%
dVanilla = 45,000 ÷ 100,000 = 45%
f Rum raisin = 20,000 ÷ 100,000 = 20%
SOLUTION EXHIBIT 14-38 (Cont’d.)
Columnar Presentation of Sales-Volume, Sales-Quantity, and Sales-Mix Variances
for The Robin’s Basket
Flexible Budget:
Actual Pints of
All Flavors Sold
× Actual Sales Mix
× Budgeted Contribution
Margin per Pint
(1)
Actual Pounds of
All Cookies Sold
× Budgeted Sales Mix
× Budgeted Contribution
Margin per Pound
(2)
Static Budget:
Budgeted Pounds of
All Cookies Sold
× Budgeted Sales Mix
× Budgeted Contribution
Margin per Pound
(3)
Panel F: $558,000g $549,000h $488,000j
All Flavors
F = favorable effect on operating income; U = unfavorable effect on operating income.
g$141,750 + $326,250 + $90,000 = $558,000
h$165,375 + $293,625 + $90,000 = $549,000
j$147,000 + $261,000 + $80,000 = $488,000
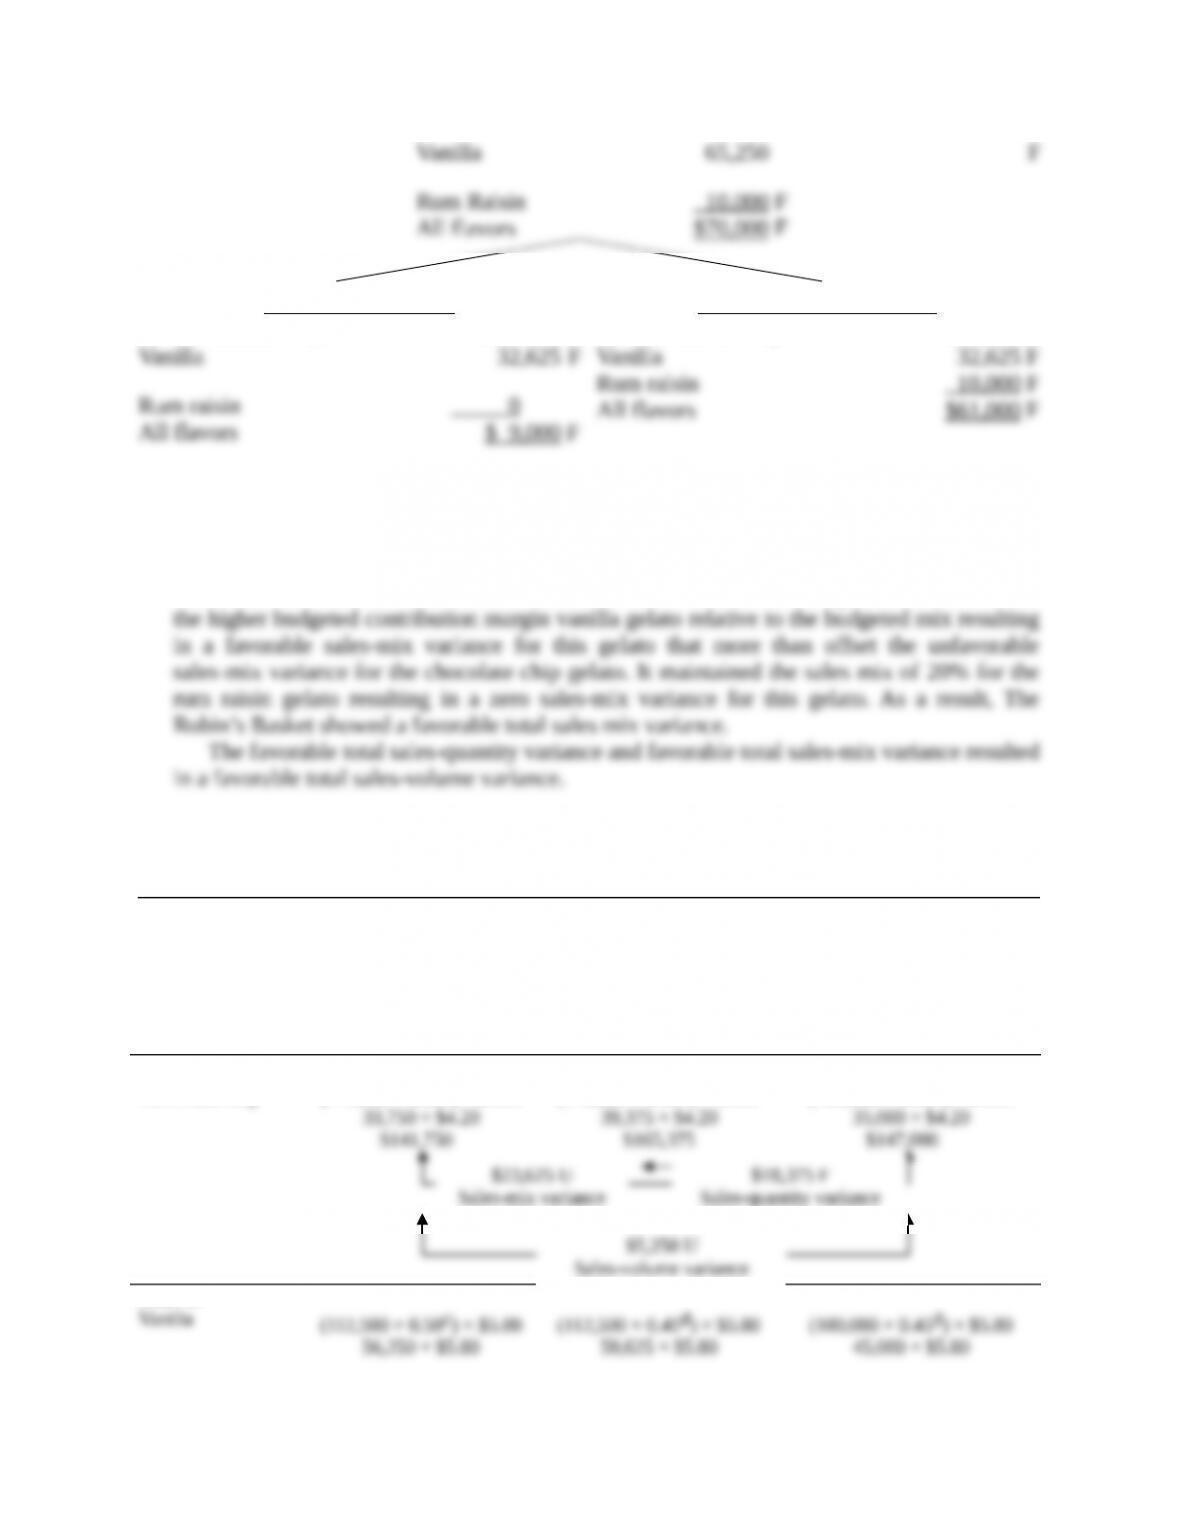
$32,625 F
Sales-mix variance
$32,625 F
Sales-quantity variance
$65,250 F
Sales-volume variance
$10,000 F
Sales-quantity variance
$0
Sales-mix variance
$10,000 F
Sales-volume variance
$70,000 F
Total sales-volume variance
$61,000 F
Total sales-quantity variance
$9,000 F
Total sales-mix variance
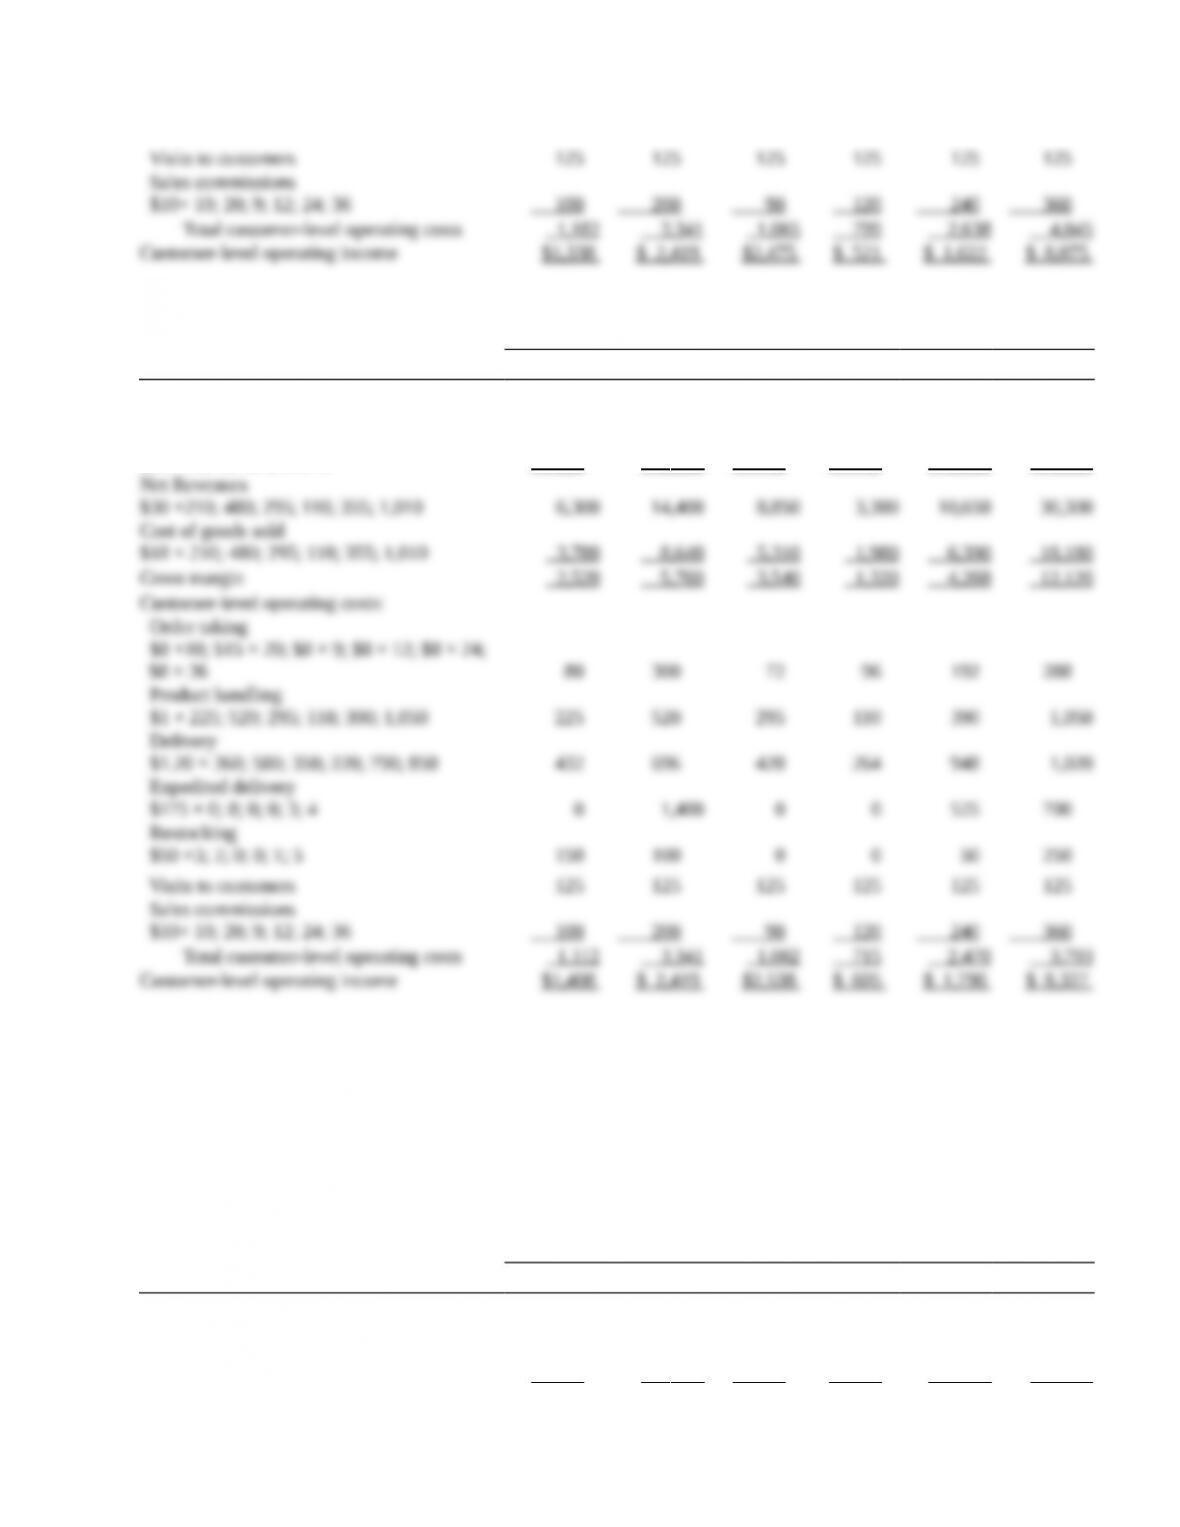
Visits to customers
125
125
125
125
125
125
Sales commissions
$10× 10; 20; 9; 12; 24; 36
100
200
90
120
240
360
Total customer-level operating costs
1,182
3,341
1,065
799
2,638
4,045
Customer-level operating income
$1,338
$ 2,419
$2,475
$ 521
$ 1,622
$ 8,075
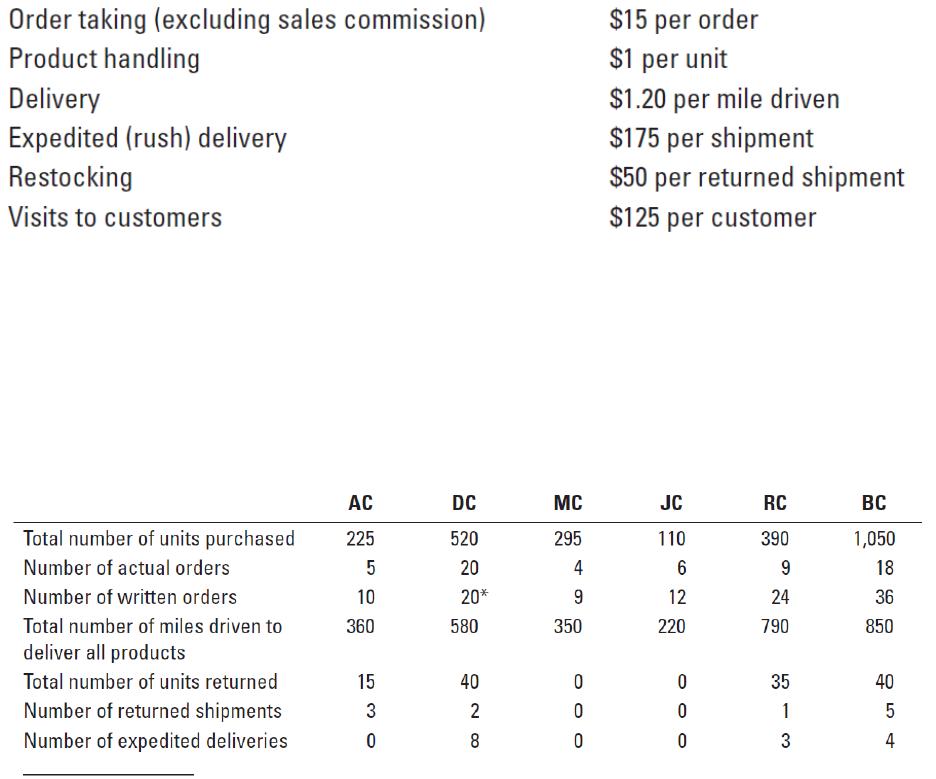
3. Customer level operating income based on actual order costs:
Customers
AC
DC
MC
JC
RC
BC
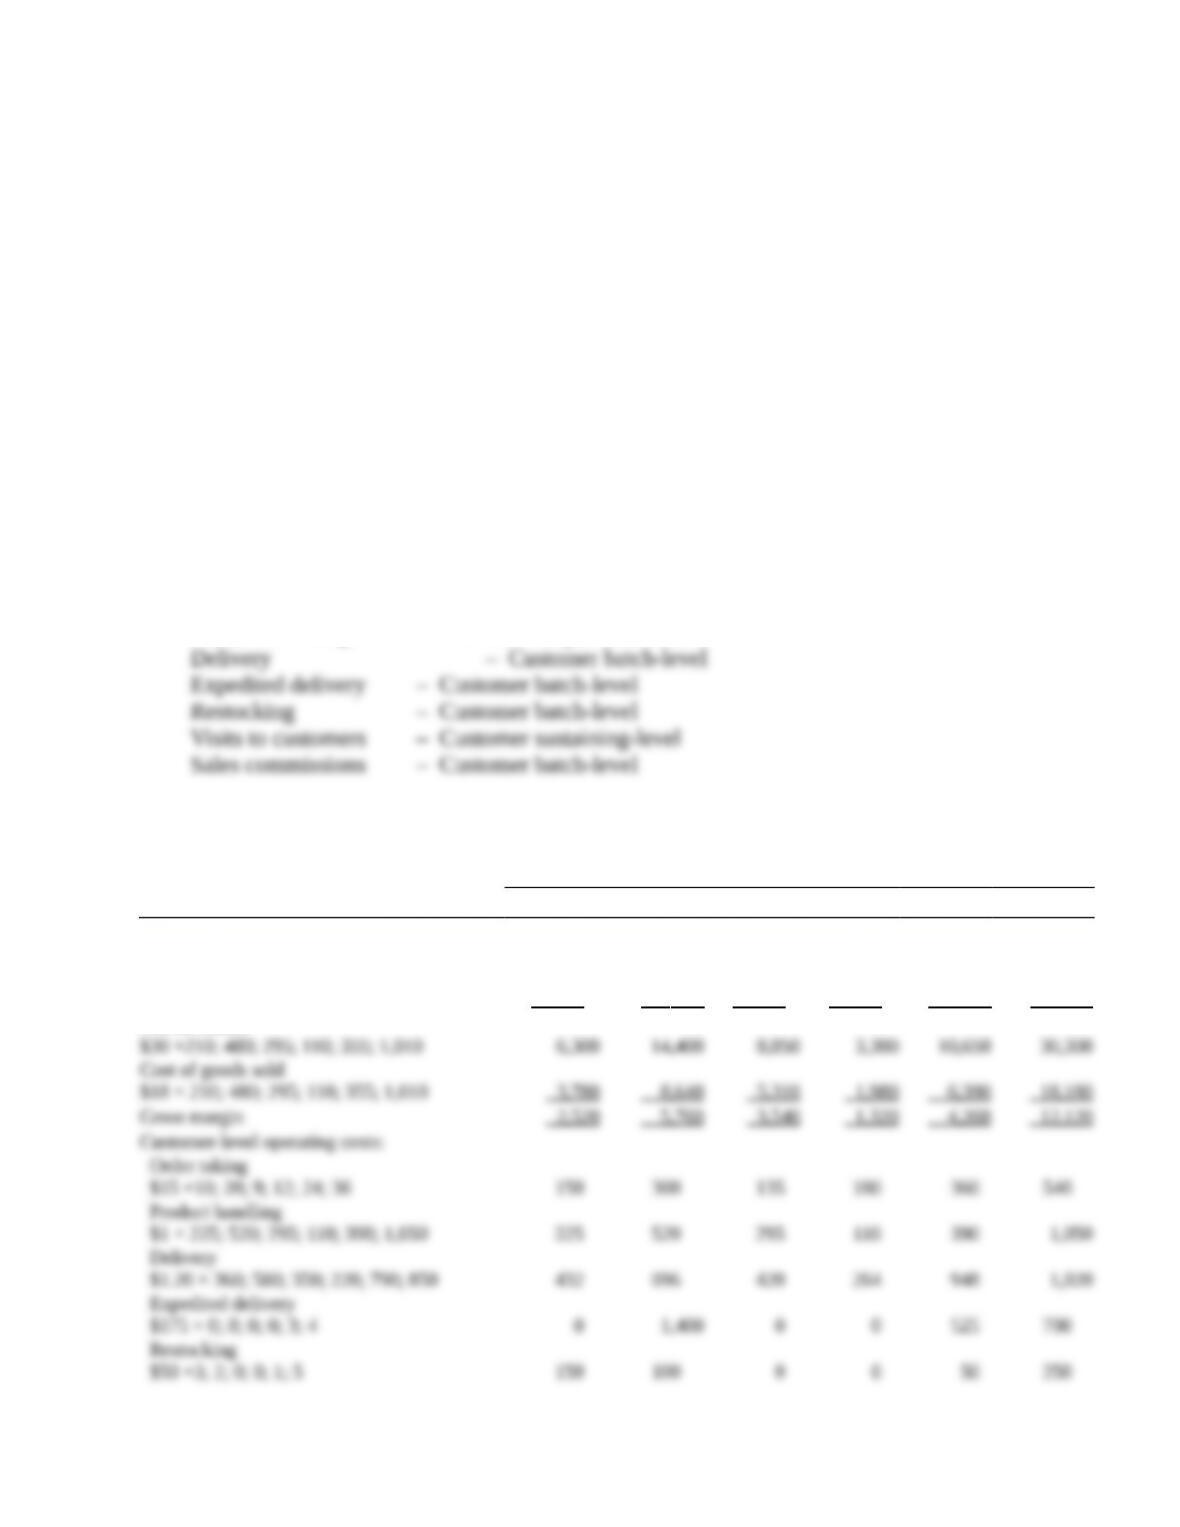
Revenues
$30 × 225; 520; 295; 110; 390; 1,050
$6,750
$15,600
$8,850
$3,300
$11,700
$31,500
Less: Returns
$30 ×15; 40; 0; 0; 35; 40
450
1,200
0
0
1,050
1,200
Net Revenues
$30 ×210; 480; 295; 110; 355; 1,010
6,300
14,400
8,850
3,300
10,650
30,300
Cost of goods sold
$18 × 210; 480; 295; 110; 355; 1,010
3,780
8,640
5,310
1,980
6,390
18,180
Gross margin
2,520
5,760
3,540
1,320
4,260
12,120
Customer-level operating costs:
Order taking
$8 ×10; $15 × 20; $8 × 9; $8 × 12; $8 × 24;
$8 × 36
80
300
72
96
192
288
Product handling
$1 × 225; 520; 295; 110; 390; 1,050
225
520
295
110
390
1,050
Delivery
$1.20 × 360; 580; 350; 220; 790; 850
432
696
420
264
948
1,020
Expedited delivery
$175 × 0; 8; 0; 0; 3; 4
0
1,400
0
0
525
700
Restocking
$50 ×3; 2; 0; 0; 1; 5
150
100
0
0
50
250
Visits to customers
125
125
125
125
125
125
Sales commissions
$10× 10; 20; 9; 12; 24; 36
100
200
90
120
240
360
Total customer-level operating costs
1,112
3,341
1,002
715
2,470
3,793
Customer-level operating income
$1,408
$ 2,419
$2,538
$ 605
$ 1,790
$ 8,327
Comparing the answers in requirements 2 and 3, it appears that operating income is higher than
expected, so the management of KC Corporation would be very pleased with the performance of
the salespeople for reducing order costs. Except for DC, all of the customers are more profitable
than originally reported.
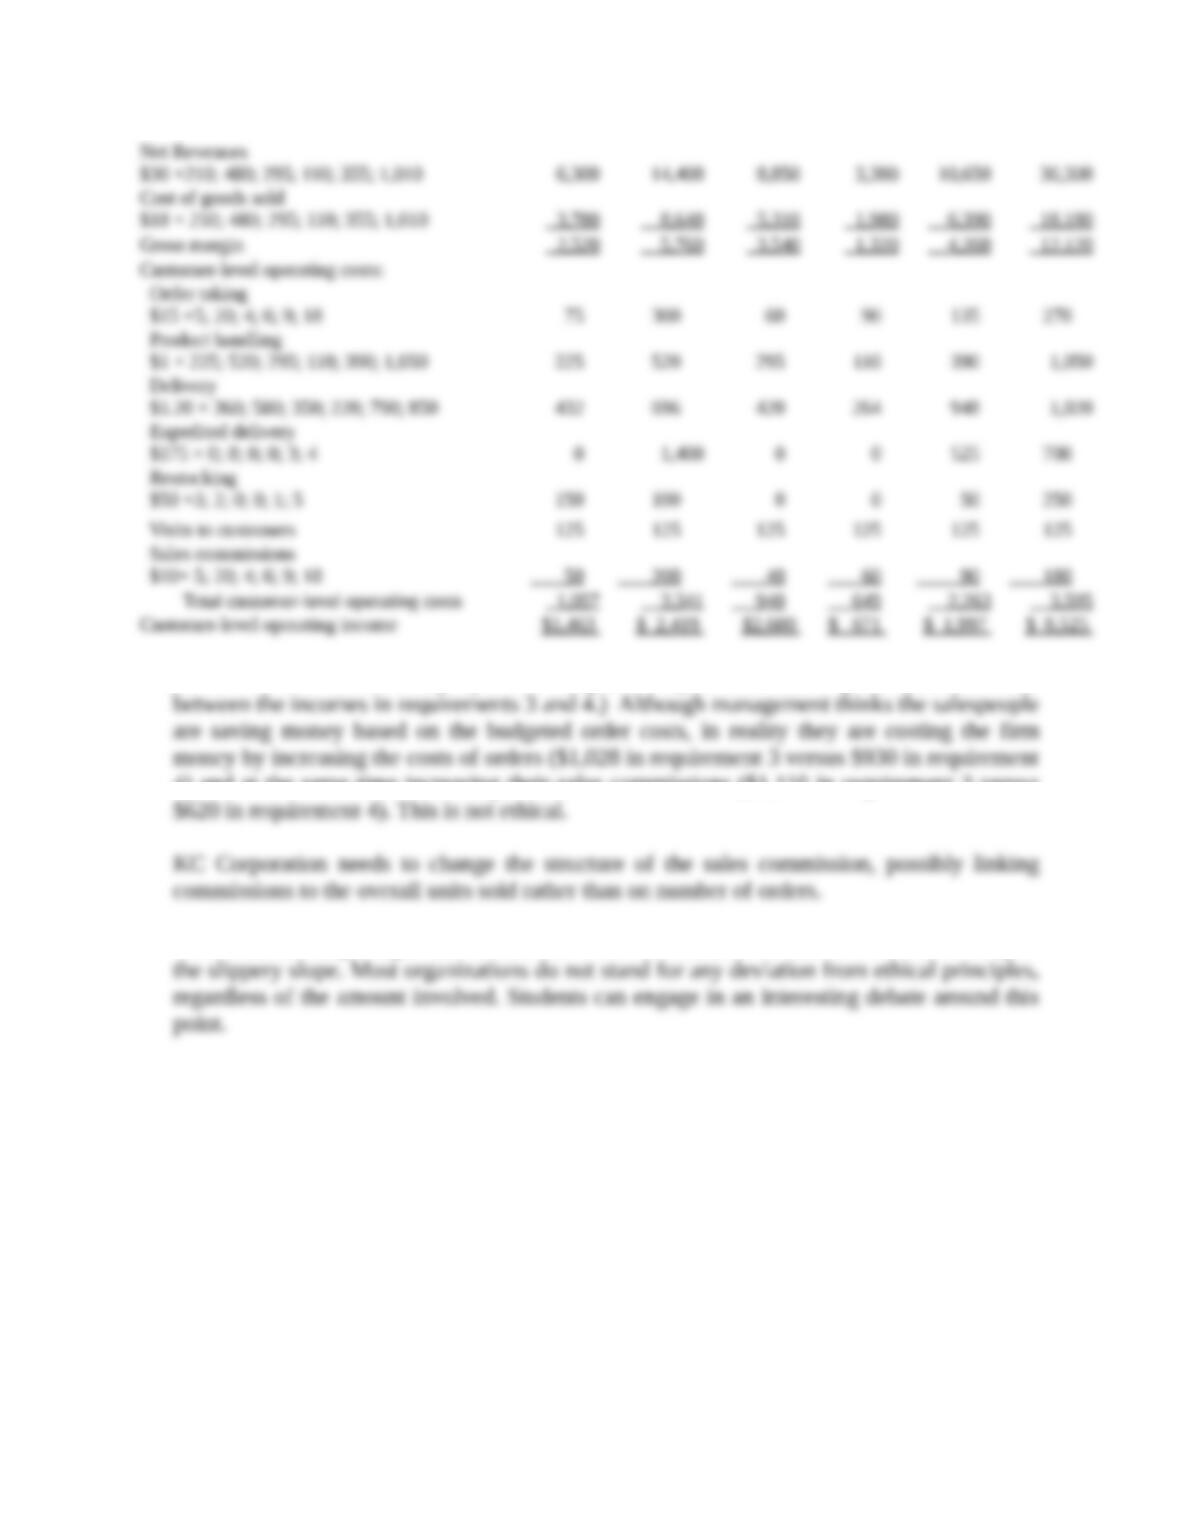
Customer-level operating income based on actual orders and adjusted commissions
Customers
AC
DC
MC
JC
RC
BC
Revenues
$30 × 225; 520; 295; 110; 390; 1,050
$6,750
$15,600
$8,850
$3,300
$11,700
$31,500
Less: Returns
450
1,200
0
0
1,050
1,200
$30 ×15; 40; 0; 0; 35; 40
Net Revenues
$30 ×210; 480; 295; 110; 355; 1,010
6,300
14,400
8,850
3,300
10,650
30,300
Cost of goods sold
$18 × 210; 480; 295; 110; 355; 1,010
3,780
8,640
5,310
1,980
6,390
18,180
Gross margin
2,520
5,760
3,540
1,320
4,260
12,120
Customer-level operating costs:
Order taking
$15 ×5; 20; 4; 6; 9; 18
75
300
60
90
135
270
Product handling
$1 × 225; 520; 295; 110; 390; 1,050
225
520
295
110
390
1,050
Delivery
$1.20 × 360; 580; 350; 220; 790; 850
432
696
420
264
948
1,020
Expedited delivery
$175 × 0; 8; 0; 0; 3; 4
0
1,400
0
0
525
700
Restocking
$50 ×3; 2; 0; 0; 1; 5
150
100
0
0
50
250
Visits to customers
125
125
125
125
125
125
Sales commissions
$10× 5; 20; 4; 6; 9; 18
50
200
40
60
90
180
Total customer-level operating costs
1,057
3,341
940
649
2,263
3,595
Customer-level operating income
$1,463
$ 2,419
$2,600
$ 671
$ 1,997
$ 8,525
5. The behavior of the salespeople is costing KC Corporation $588 in profit (the difference
between the incomes in requirements 3 and 4.) Although management thinks the salespeople
are saving money based on the budgeted order costs, in reality they are costing the firm money
by increasing the costs of orders ($1,028 in requirement 3 versus $930 in requirement 4) and
at the same time increasing their sales commissions ($1,110 in requirement 3 versus $620 in
requirement 4). This is not ethical.
KC Corporation needs to change the structure of the sales commission, possibly linking
commissions to the overall units sold rather than on number of orders.
Some students might argue that the amount is not material, but in matters of ethics be wary of
the slippery slope. Most organizations do not stand for any deviation from ethical principles,
regardless of the amount involved. Students can engage in an interesting debate around this
point.