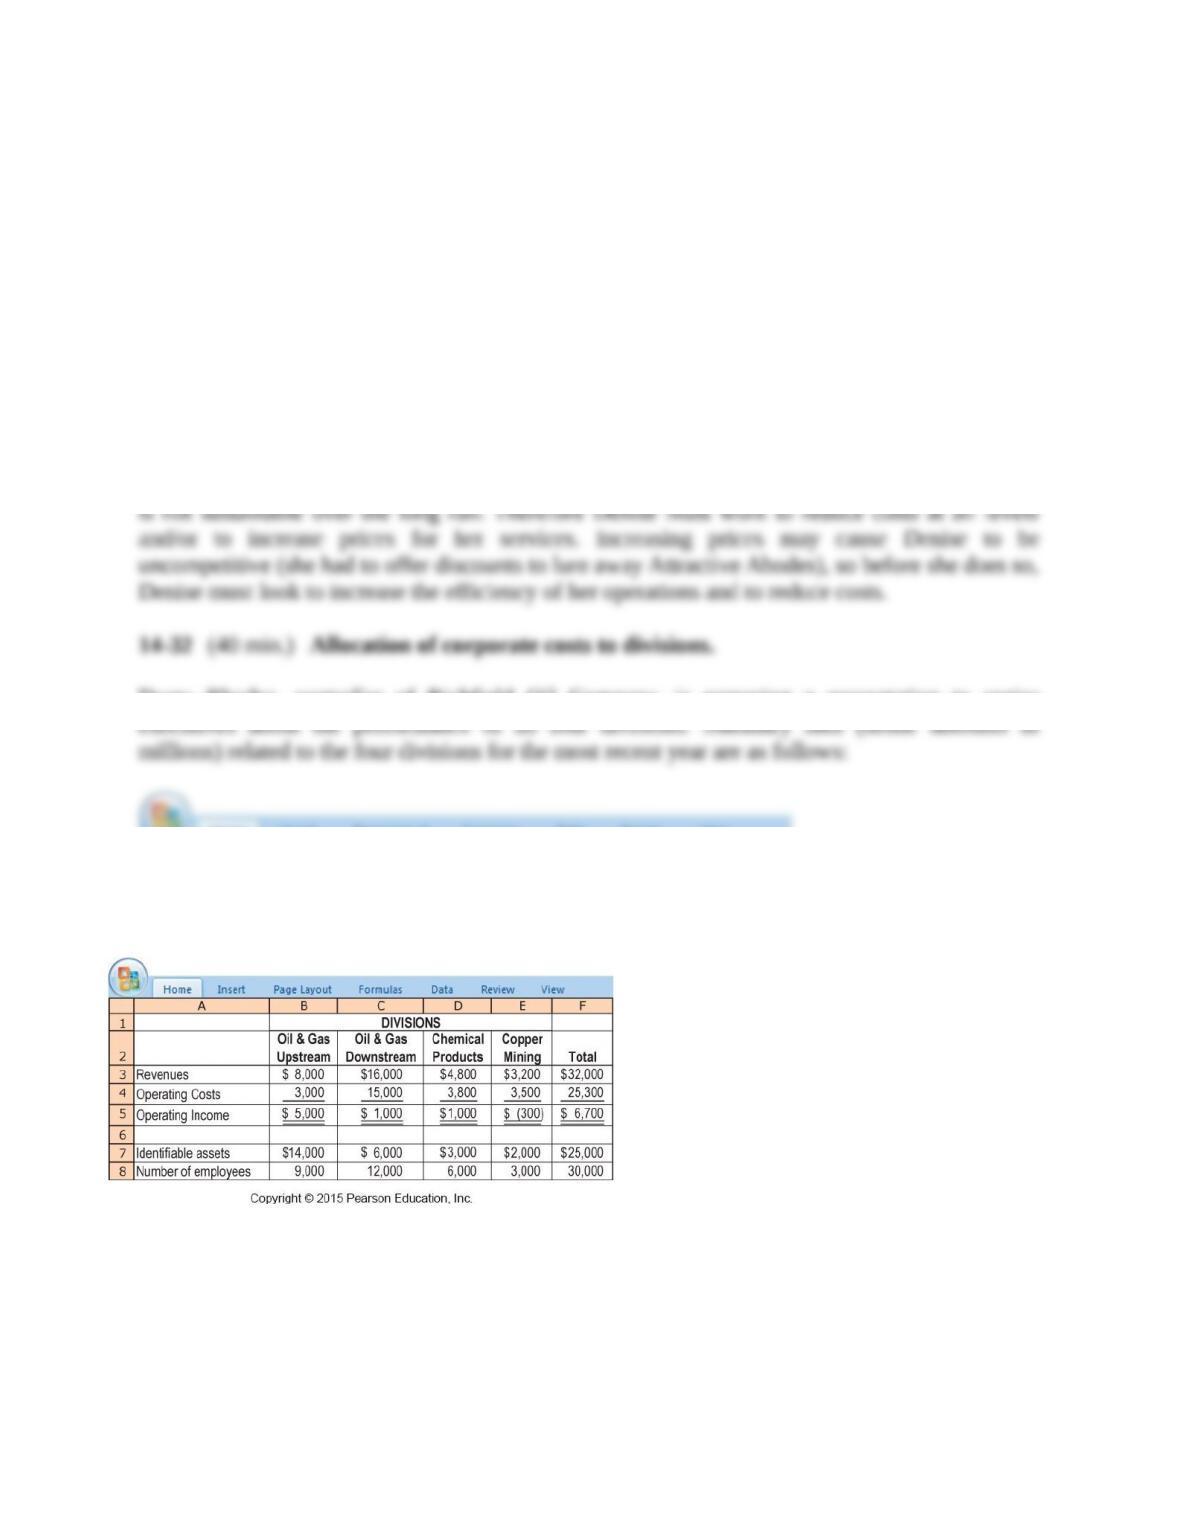

(Dollar amounts in millions)
Oil & Gas
Upstream
Oil & Gas
Downstream
Chemical
Products
Copper
Mining
Total
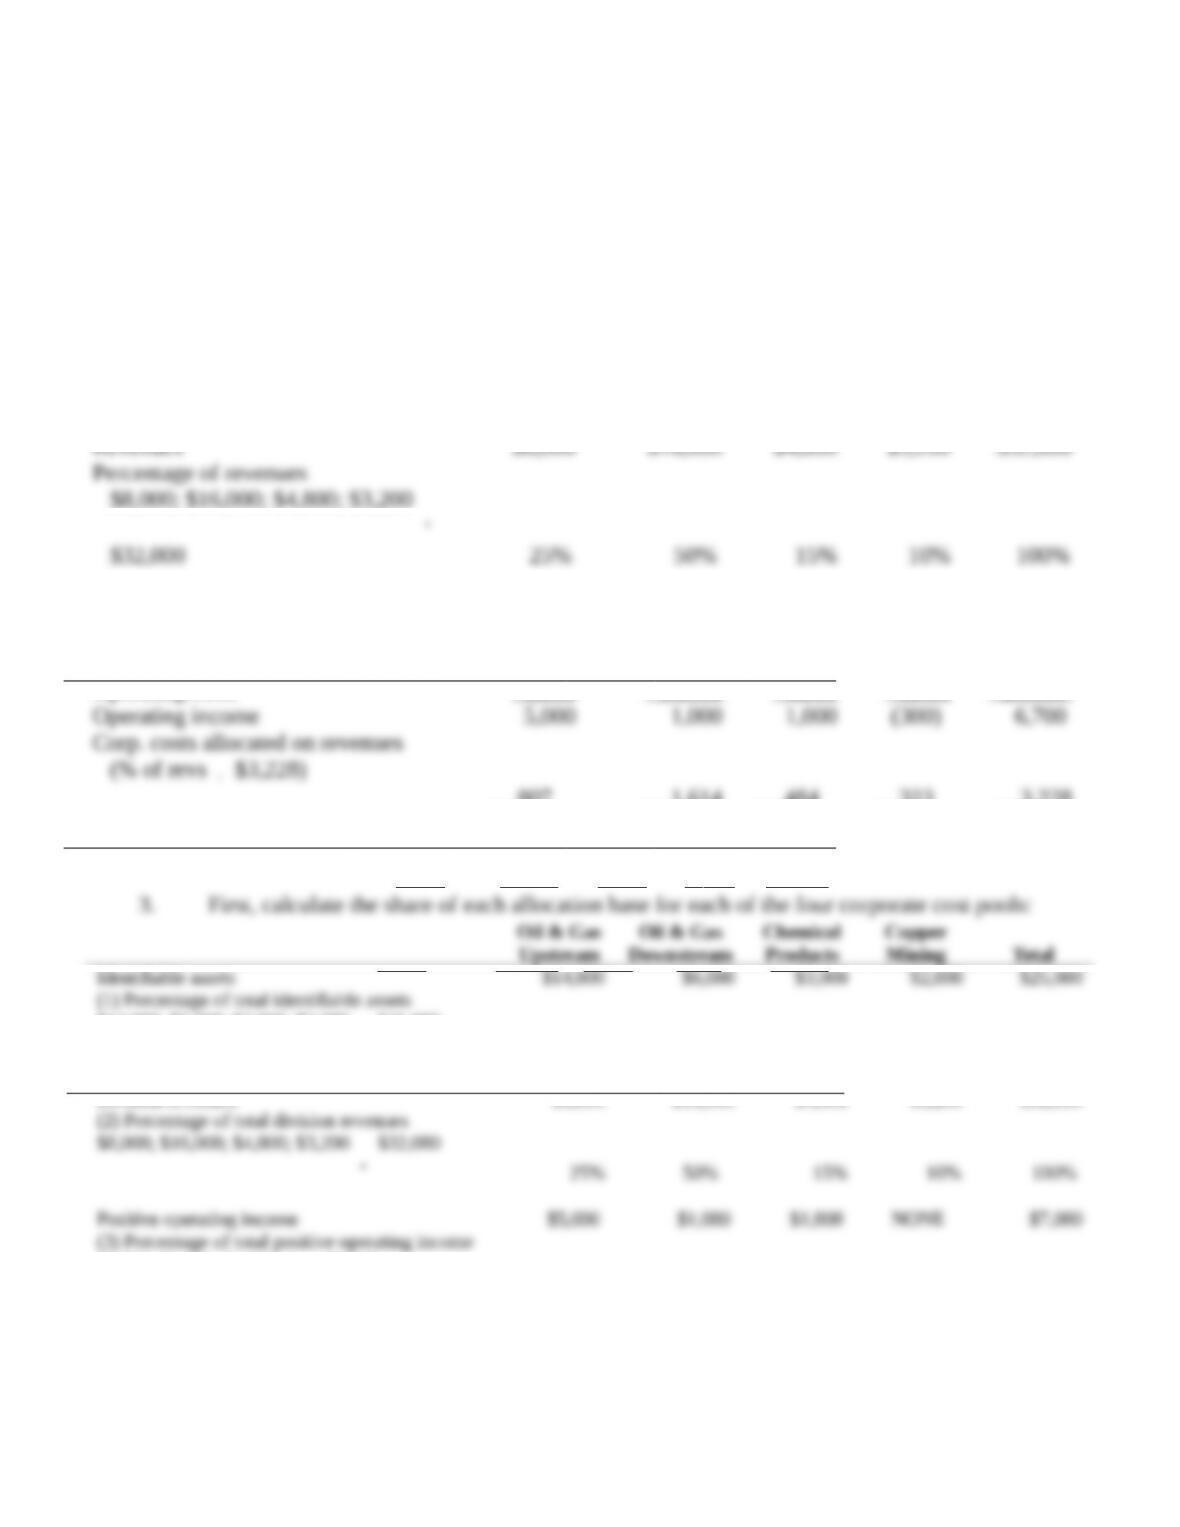
Revenues
$8,000.00
$16,000.00
$4,800.00
$3,200.00
$32,000
Operating Costs
3,000.00
15,000.00
3,800.00
3,500.00
25,300
Operating Income
5,000.00
1,000.00
1,000.00
(300.00)
6,700
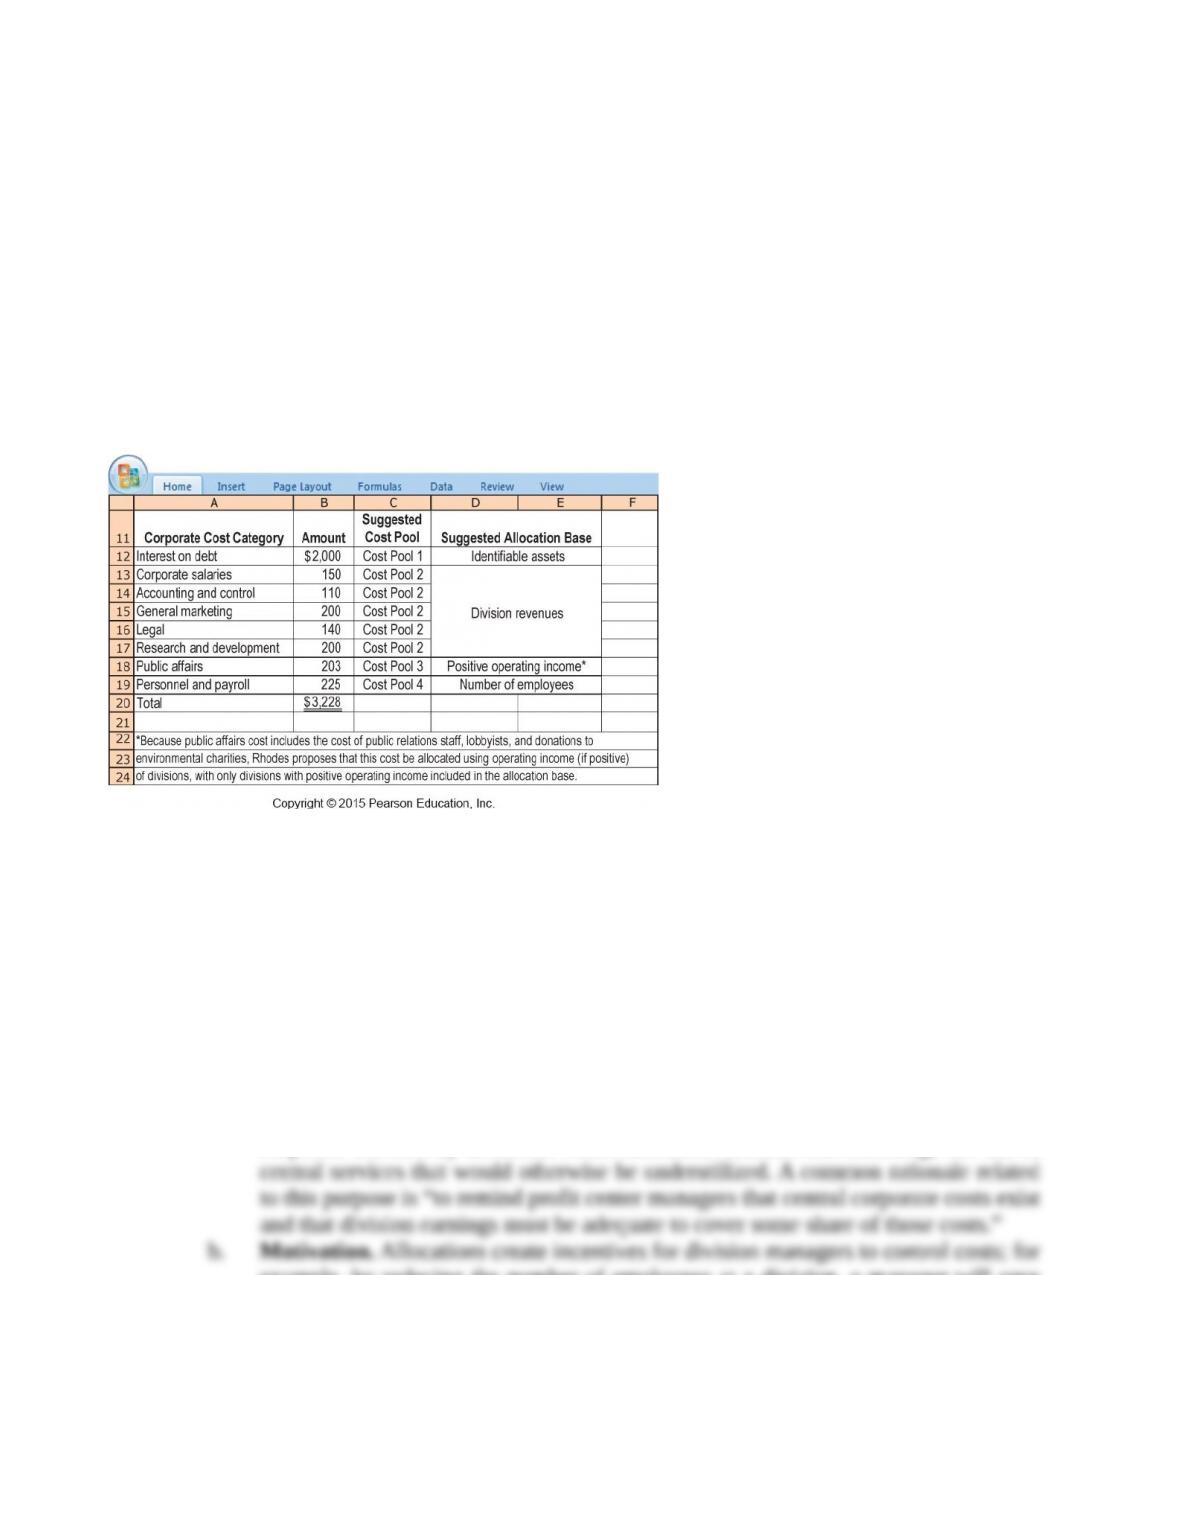
Cost Pool 1 Allocation ((1)
$2,000)
1,120.00
480.00
240.00
160.00
2,000
Cost Pool 2 Allocation ((2)
$800)
200.00
400.00
120.00
80.00
800
Cost Pool 3 Allocation ((3)
$203)
145.00
29.00
29.00
0.00
203
Cost Pool 4 Allocation ((4)
$225)
67.50
9
0.00
45.00
22.50
225
Division Income
$3,467.50
$ 1.00
$ 566.00
$ (562.50)
$ 3,472
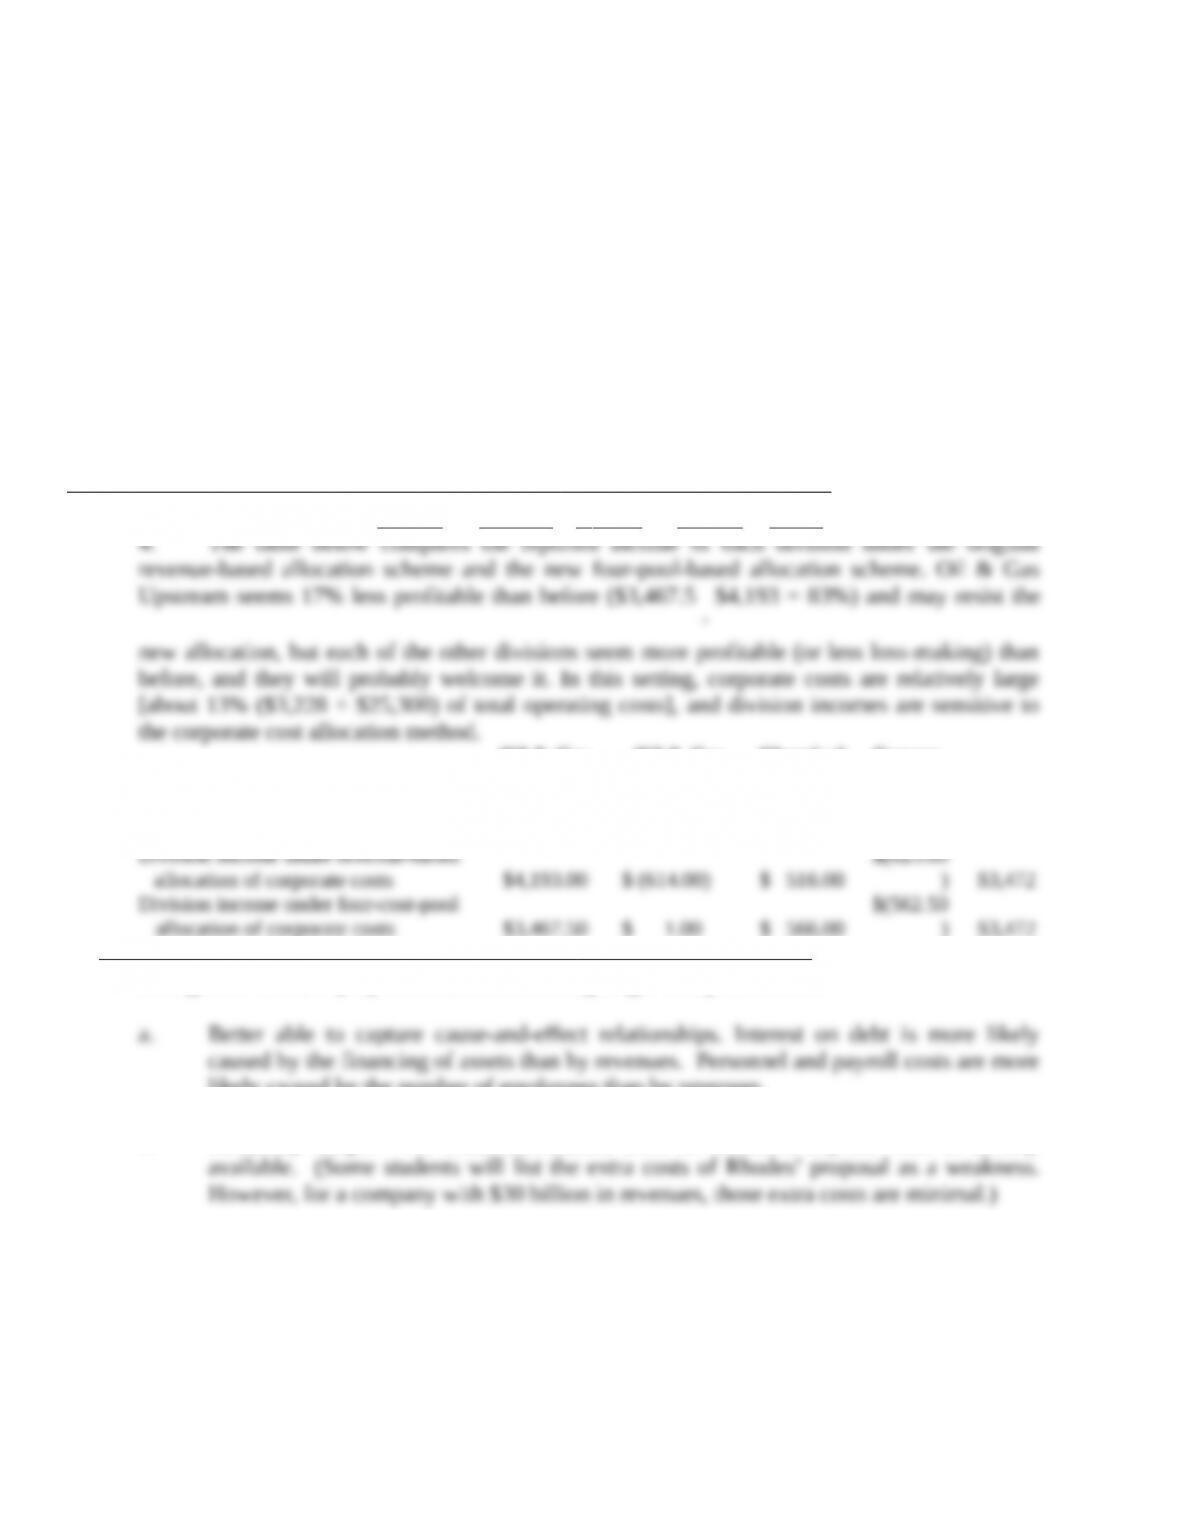
4. The table below compares the reported income of each division under the original revenue-
based allocation scheme and the new four-pool-based allocation scheme. Oil & Gas Upstream
seems 17% less profitable than before ($3,467.5
$4,193 = 83%) and may resist the new
allocation, but each of the other divisions seem more profitable (or less loss-making) than before,
and they will probably welcome it. In this setting, corporate costs are relatively large [about 13%
($3,228 ÷ $25,300) of total operating costs], and division incomes are sensitive to the corporate
cost allocation method.
(Dollar amounts in millions)
Oil & Gas
Upstream
Oil & Gas
Downstream
Chemical
Products
Copper
Mining
Total
Operating Income
(before corp. cost allocation)
$5,000.00
$1,000.00
$1,000.00
$(300.00)
$6,700
Division income under revenue-based
allocation of corporate costs
$4,193.00
$ (614.00)
$ 516.00
$(623.00)
$3,472
Division income under four-cost-pool
allocation of corporate costs
$3,467.50
$ 1.00
$ 566.00
$(562.50)
$3,472
Strengths of Rhodes’ proposal relative to existing single-cost pool method:
a. Better able to capture cause-and-effect relationships. Interest on debt is more likely caused
by the financing of assets than by revenues. Personnel and payroll costs are more likely
caused by the number of employees than by revenues.
b. Relatively simple. No extra information need be collected beyond what is already
available. (Some students will list the extra costs of Rhodes’ proposal as a weakness.
However, for a company with $30 billion in revenues, those extra costs are minimal.)
Weaknesses of Rhodes’ proposal relative to existing single–cost pool method:
a. May promote dysfunctional decision making. May encourage division managers to lease
or rent assets rather than to purchase assets, even where it is economical for Richfield Oil
to purchase them. This off-balance sheet financing will reduce the “identifiable assets” of
the division and thus will reduce the interest on debt costs allocated to the division.
(Richfield Oil could counteract this problem by incorporating leased and rented assets in
the “identifiable assets” base.)
Total
2,504,600
839,900
1,755,500
5,100,000
Operating income
$3,895,400
$ 460,100
$4,394,500
$ 8,750,000
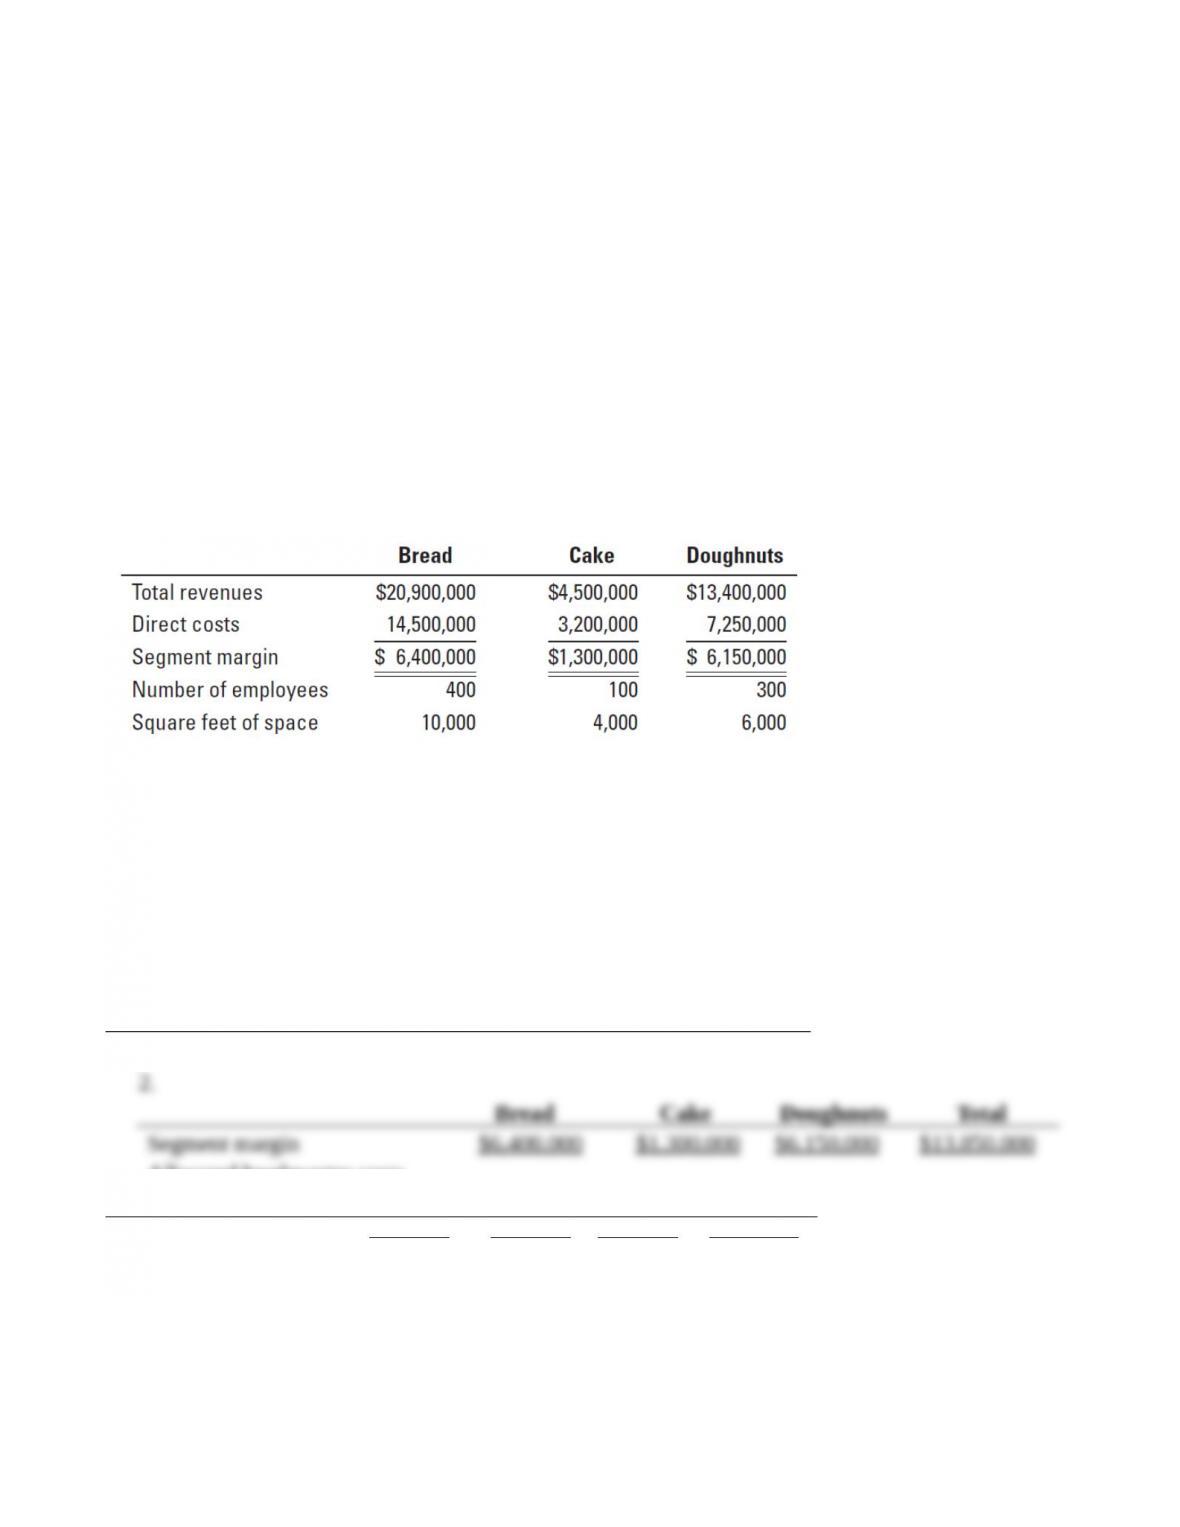
1HR costs: 400 ÷ 800 = 50%; 100 ÷ 800 = 12.5%; 300 ÷ 800 = 37.5%
2Accounting: $20,900,000 ÷ $38,800,000 = 53.9%; $4,500,000 ÷ $38,800,000 = 11.6%;
$13,400,000 ÷ $38,800,000 = 34.5%
3Rent and depreciation: 10,000 ÷ 20,000 = 50%; 4,000 ÷ 20,000 = 20%; 6,000 ÷ 20,000 = 30%
A cause-and-effect relationship may exist between Human Resources costs and the number of
employees at each division. Rent and depreciation costs may be related to square feet, except
that very expensive machines may require little square footage, which is inconsistent with this
choice of allocation base. The Accounting Department costs are probably related to the revenues
earned by each division—higher revenues mean more transactions and more accounting. Other
overhead costs are allocated arbitrarily.
3. The manager who suggested the new allocation bases probably works in the Cake
Division. Under the old scheme, the Cake Division shows an operating loss after allocating
headquarter costs because it is smaller, yet was charged an equal amount (a third) of headquarter
costs. The new allocation scheme shows an operating profit in the Cake Division, even after
allocating headquarter costs. The ABC method is a better way to allocate headquarter costs
because it uses cost allocation bases that, by and large, represent cause-and-effect relationships
between various categories of headquarter costs and the demands that different divisions place
on these costs.
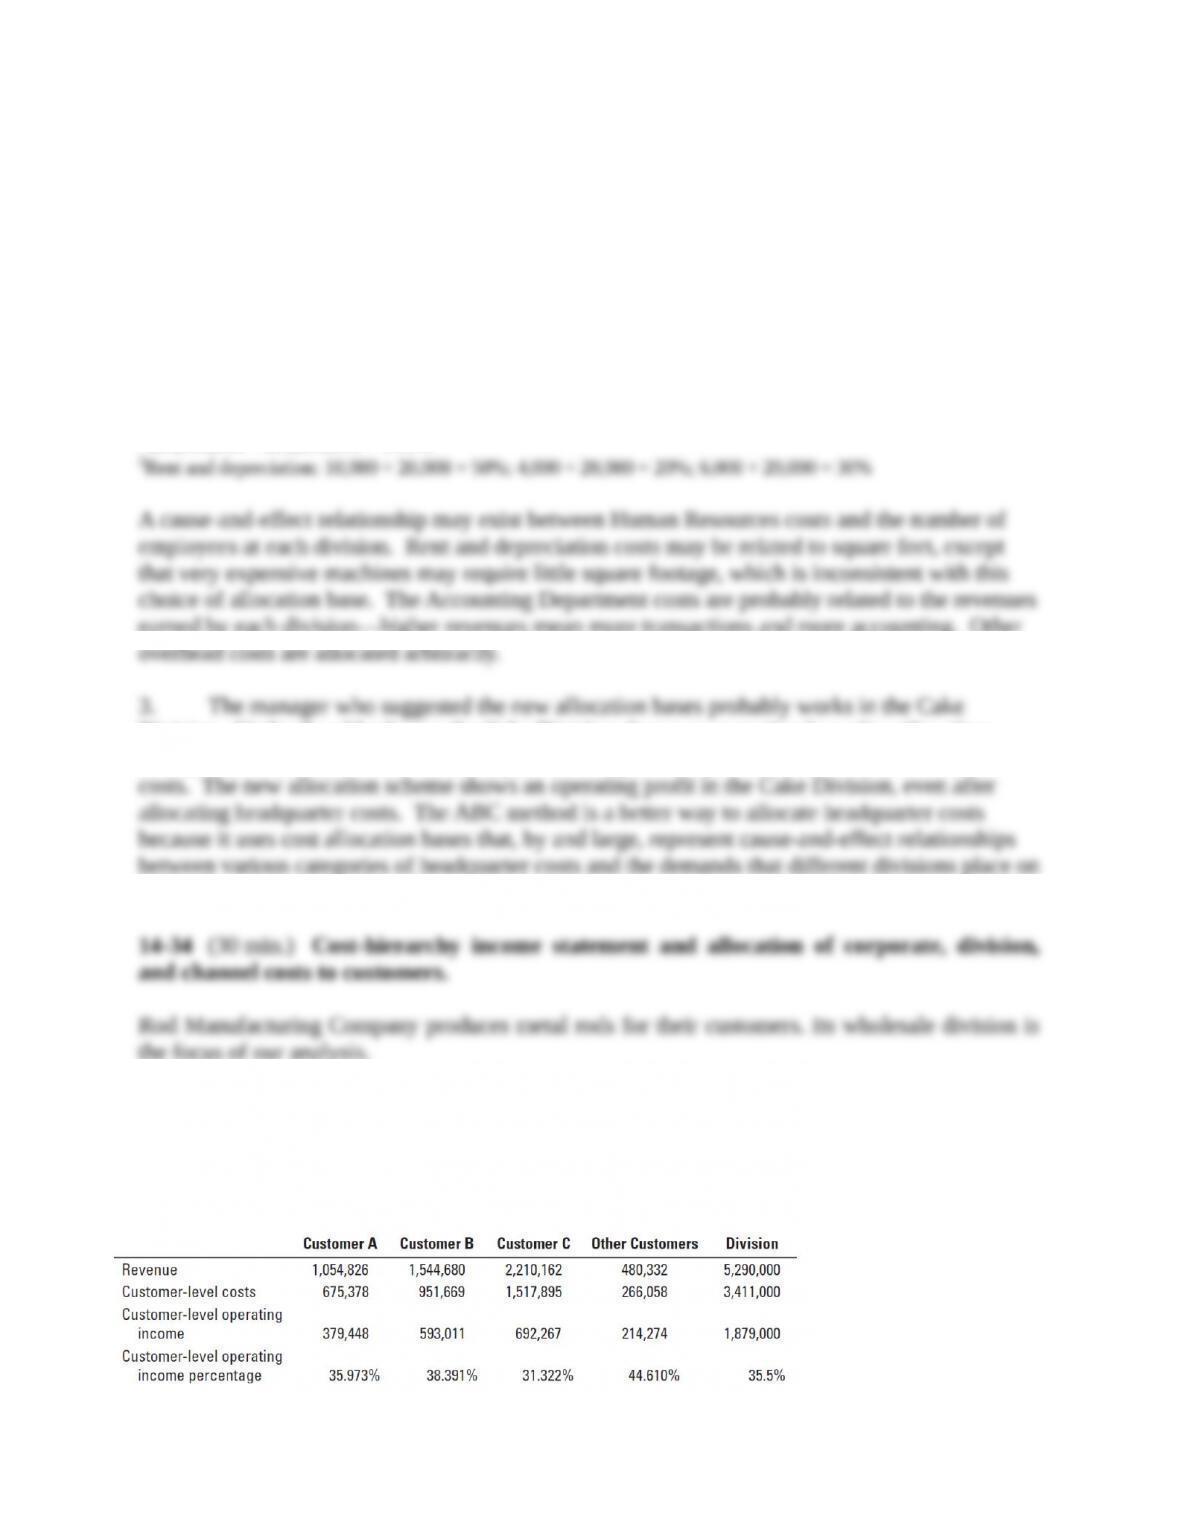
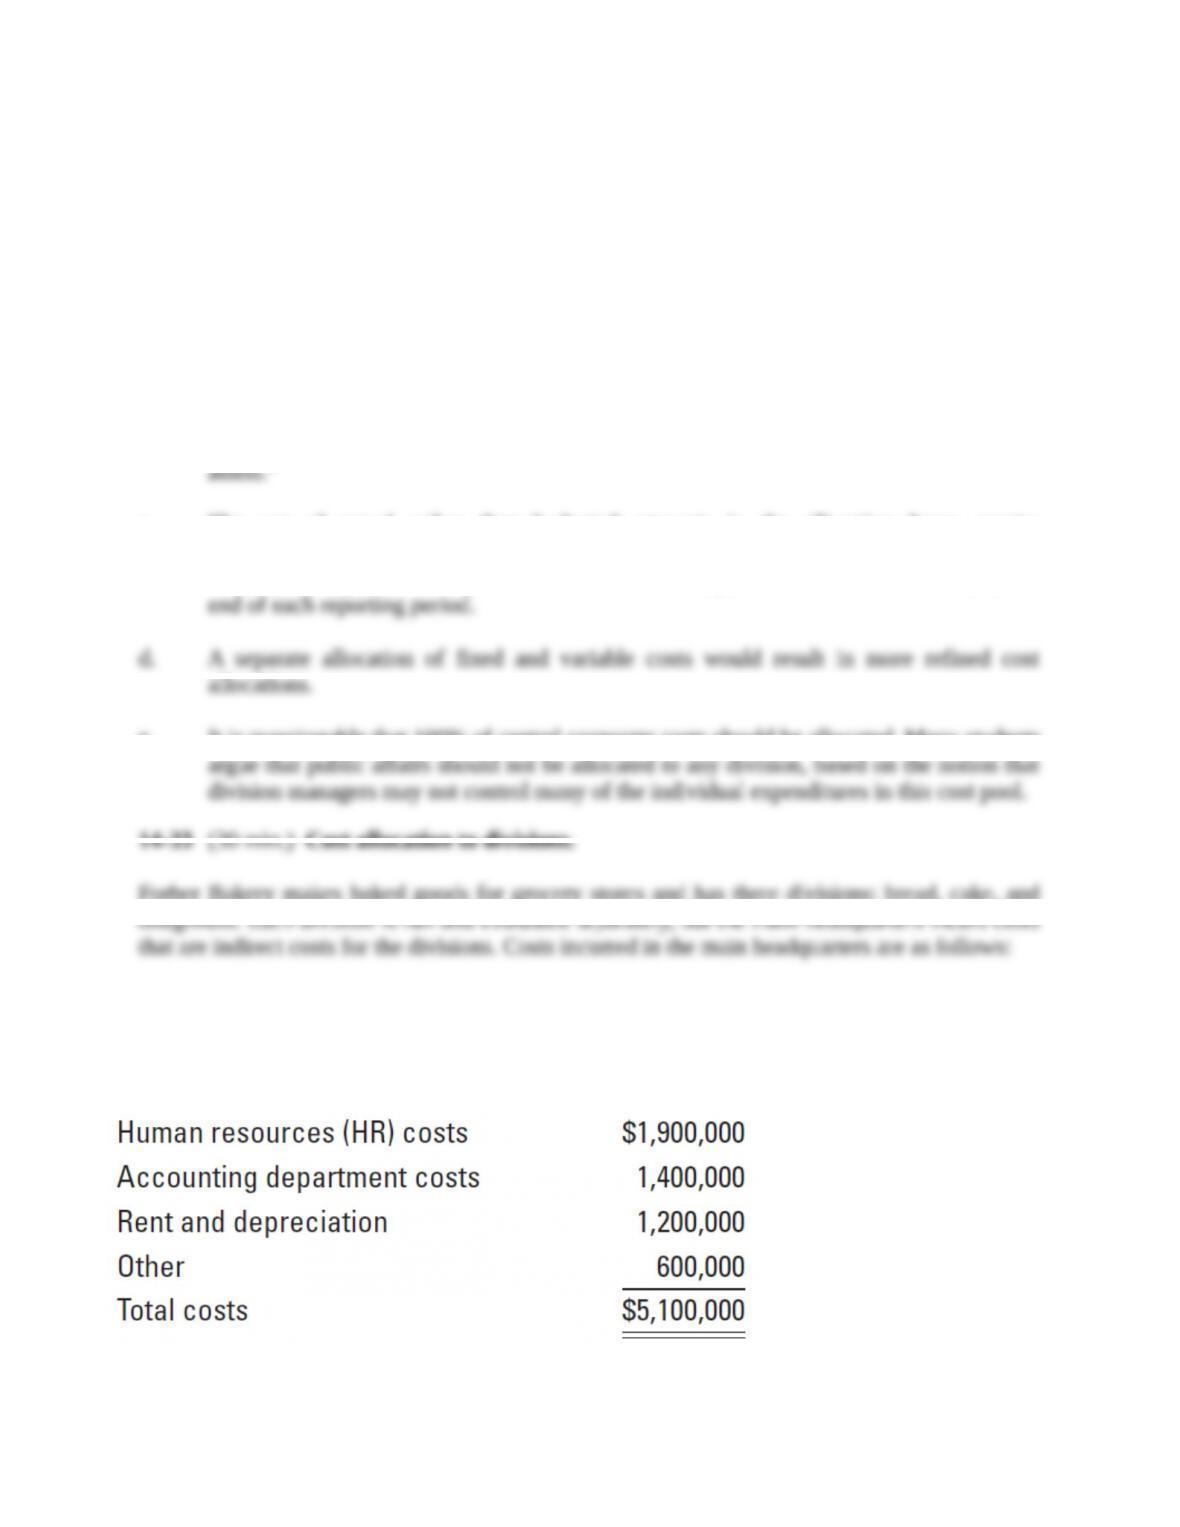
14-34 (30 min.) Cost-hierarchy income statement and allocation of corporate, division, and
channel costs to customers.
Rod Manufacturing Company produces metal rods for their customers. Its wholesale division is
the focus of our analysis.
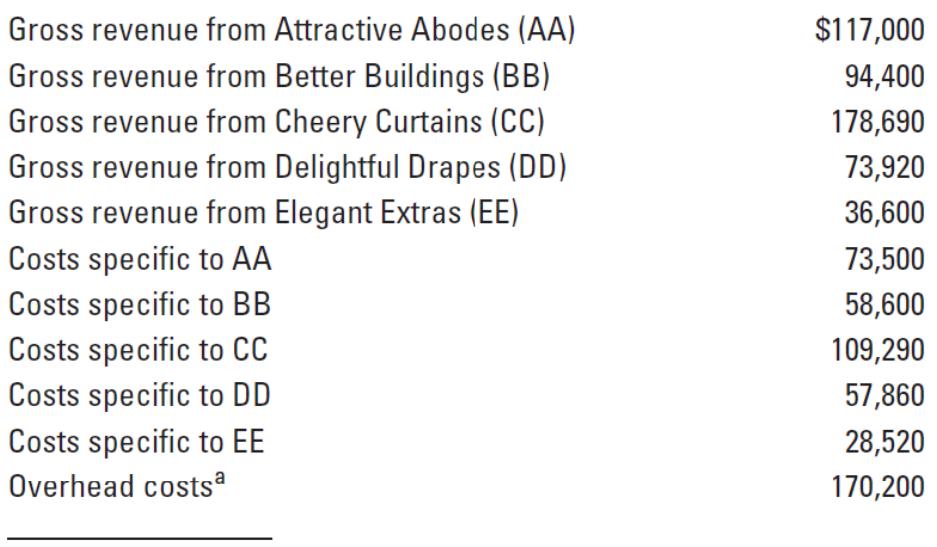
Management of the company wishes to analyze the profitability of the three key customers in
the division and has gathered the following information.
The company allocates wholesale channel costs to customers based on one cost pool and division
costs based on two cost pools as follows. Customer actions do not influence these costs.